MetaTreeMap: An Alternative Visualization Method for Displaying Metagenomic Phylogenic Trees
- PMID: 27336370
- PMCID: PMC4918957
- DOI: 10.1371/journal.pone.0158261
MetaTreeMap: An Alternative Visualization Method for Displaying Metagenomic Phylogenic Trees
Abstract
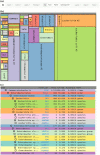
Metagenomic samples can contain hundreds or thousands of different species. The most common method to identify these species is to sequence the samples and then classify the reads to nodes along a phylogenic tree. Linear representations of trees with so many nodes face legibility issues. In addition, such views are not optimal for appreciating the read quantity assigned to each node. The problem is exaggerated when comparison between multiple samples is needed. MetaTreeMap adapts a visualization method that addresses these weaknesses. The tree is represented by nested rectangles that illustrate the number or percentage of assigned reads. MetaTreeMap implements various options specific to phylogenic trees that allow for quick overview and investigation of the information. More generally, the goal of this software is to provide the user with the ability to easily display phylogenic trees based on various quantities assigned to the nodes, such as read number, percentage or other values. The tool can be used online at http://metasystems.riken.jp/visualization/treemap/.
Conflict of interest statement
Figures


Similar articles
-
Visualizing phylogenetic trees using TreeView.Curr Protoc Bioinformatics. 2002 Aug;Chapter 6:Unit 6.2. doi: 10.1002/0471250953.bi0602s01. Curr Protoc Bioinformatics. 2002. PMID: 18792942
-
Paloverde: an OpenGL 3D phylogeny browser.Bioinformatics. 2006 Apr 15;22(8):1004-6. doi: 10.1093/bioinformatics/btl044. Epub 2006 Feb 24. Bioinformatics. 2006. PMID: 16500938
-
Dendroscope: An interactive viewer for large phylogenetic trees.BMC Bioinformatics. 2007 Nov 22;8:460. doi: 10.1186/1471-2105-8-460. BMC Bioinformatics. 2007. PMID: 18034891 Free PMC article.
-
Interactive visualization software for exploring phylogenetic trees and clades.Bioinformatics. 2008 Mar 15;24(6):868-9. doi: 10.1093/bioinformatics/btn038. Epub 2008 Feb 8. Bioinformatics. 2008. PMID: 18263642
-
Three-Dimensional Phylogeny Explorer: distinguishing paralogs, lateral transfer, and violation of "molecular clock" assumption with 3D visualization.BMC Bioinformatics. 2007 Jun 20;8:213. doi: 10.1186/1471-2105-8-213. BMC Bioinformatics. 2007. PMID: 17584922 Free PMC article.
Cited by
-
Recentrifuge: Robust comparative analysis and contamination removal for metagenomics.PLoS Comput Biol. 2019 Apr 8;15(4):e1006967. doi: 10.1371/journal.pcbi.1006967. eCollection 2019 Apr. PLoS Comput Biol. 2019. PMID: 30958827 Free PMC article.
-
Topo-phylogeny: Visualizing evolutionary relationships on a topographic landscape.PLoS One. 2017 May 1;12(5):e0175895. doi: 10.1371/journal.pone.0175895. eCollection 2017. PLoS One. 2017. PMID: 28459802 Free PMC article.
References
-
- Shneiderman B. Tree visualization with tree-maps: 2-d space-filling approach. ACM Transactions on Graphics. 1992. January;11(1):92–99. 10.1145/102377.115768 - DOI
MeSH terms
LinkOut - more resources
Full Text Sources
Other Literature Sources

