. 2016 Jun 23:7:11919.
doi: 10.1038/ncomms11919.

Arf6 controls retromer traffic and intracellular cholesterol distribution via a phosphoinositide-based mechanism

Affiliations

Arf6 controls retromer traffic and intracellular cholesterol distribution via a phosphoinositide-based mechanism

Catherine Marquer et al. Nat Commun. .

Abstract

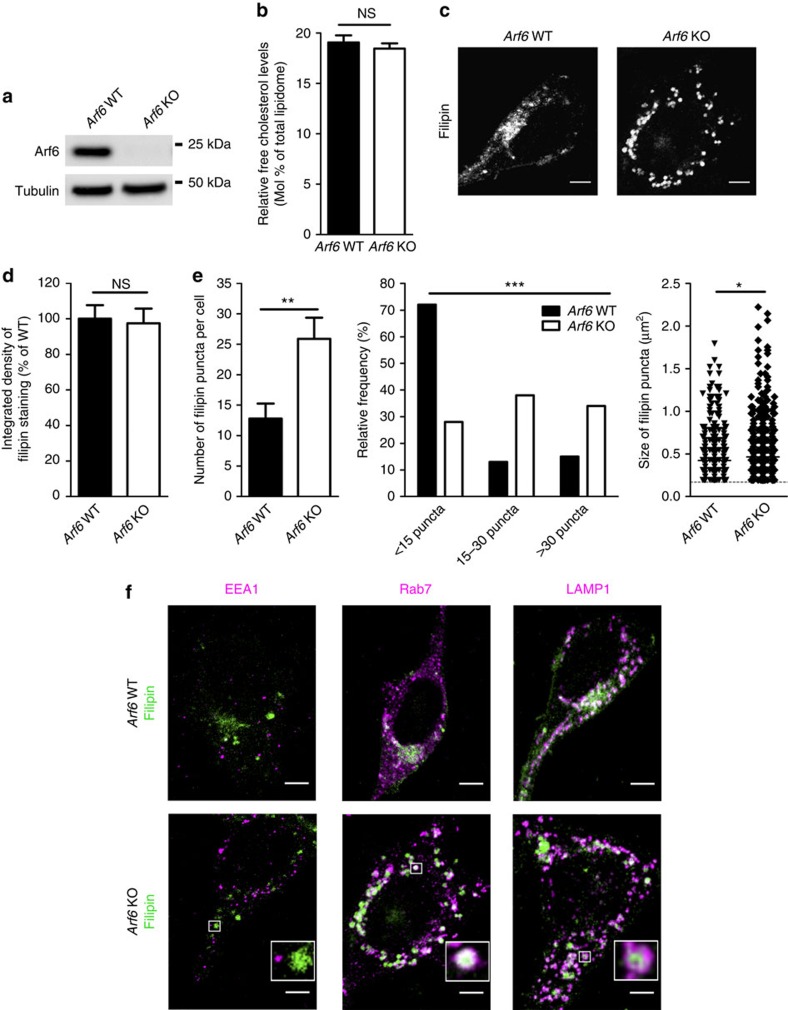
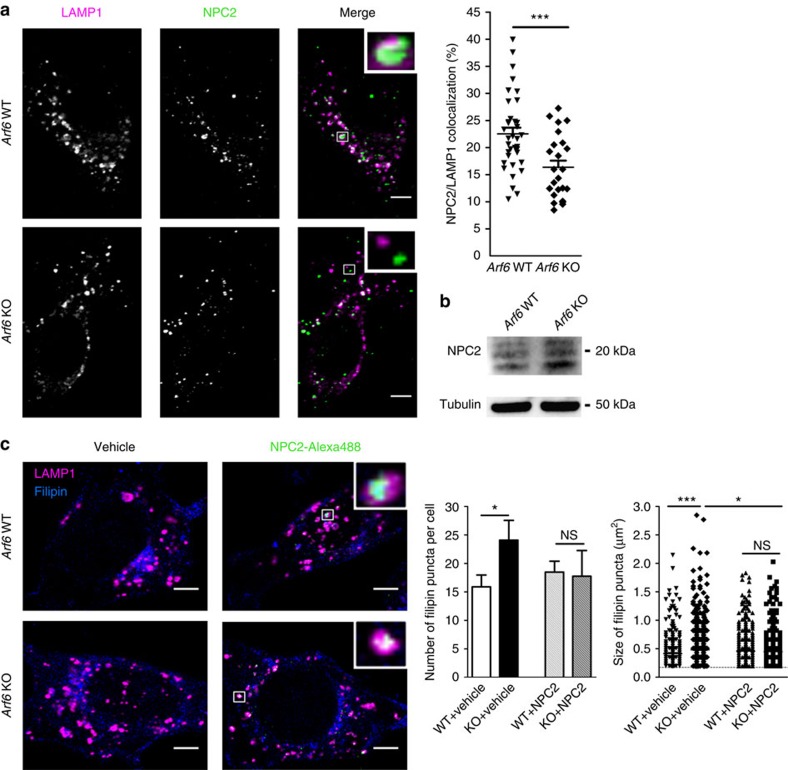
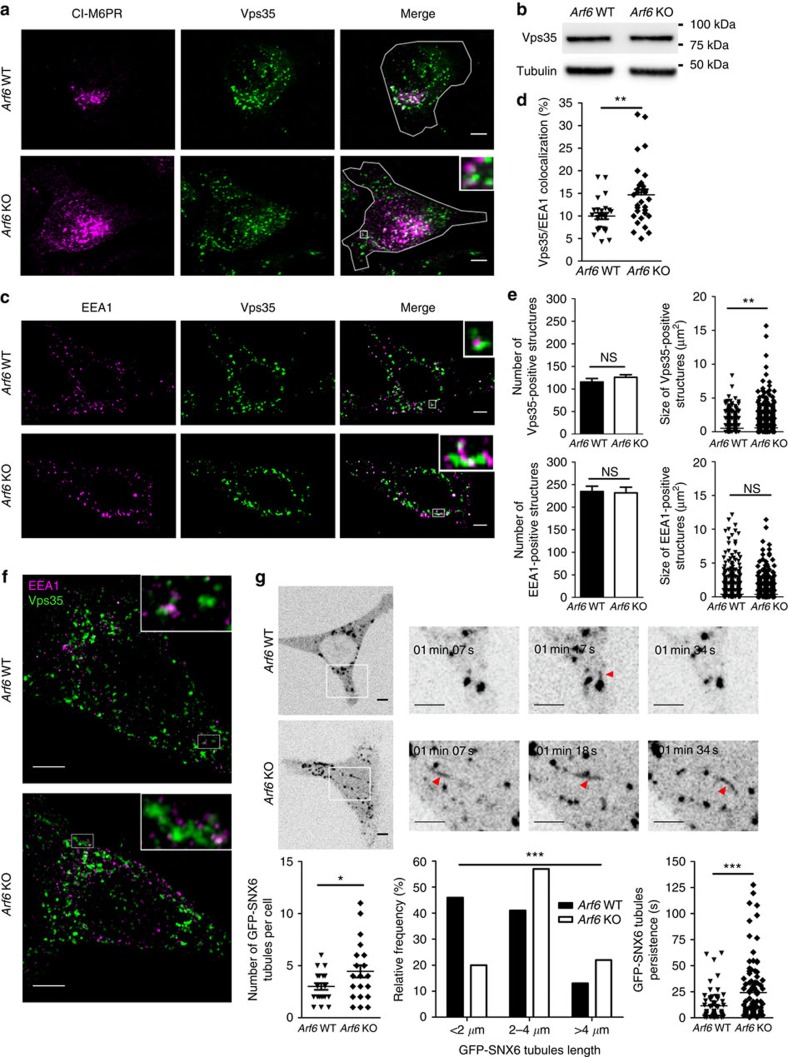
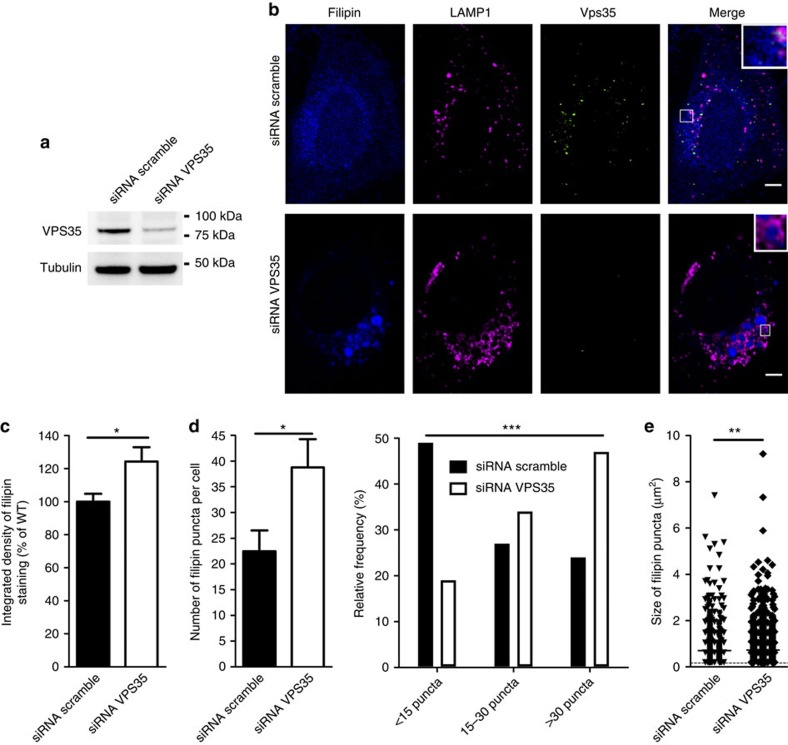
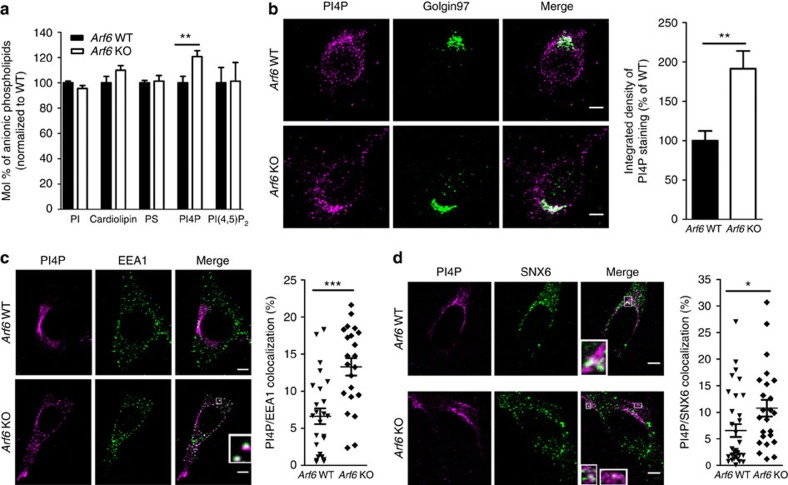
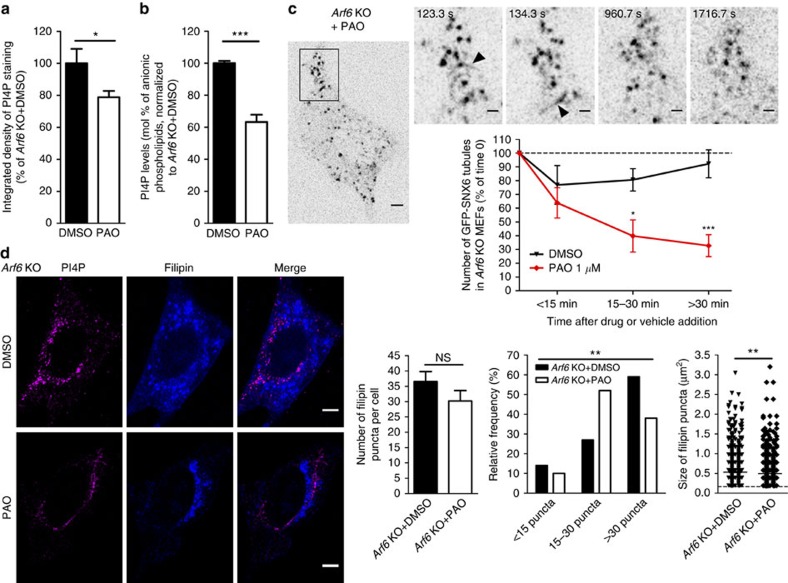
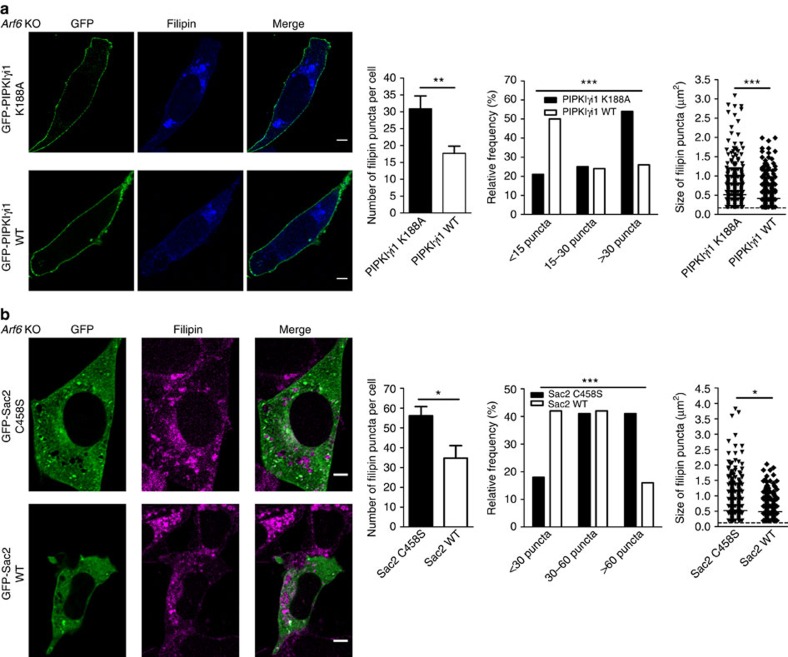
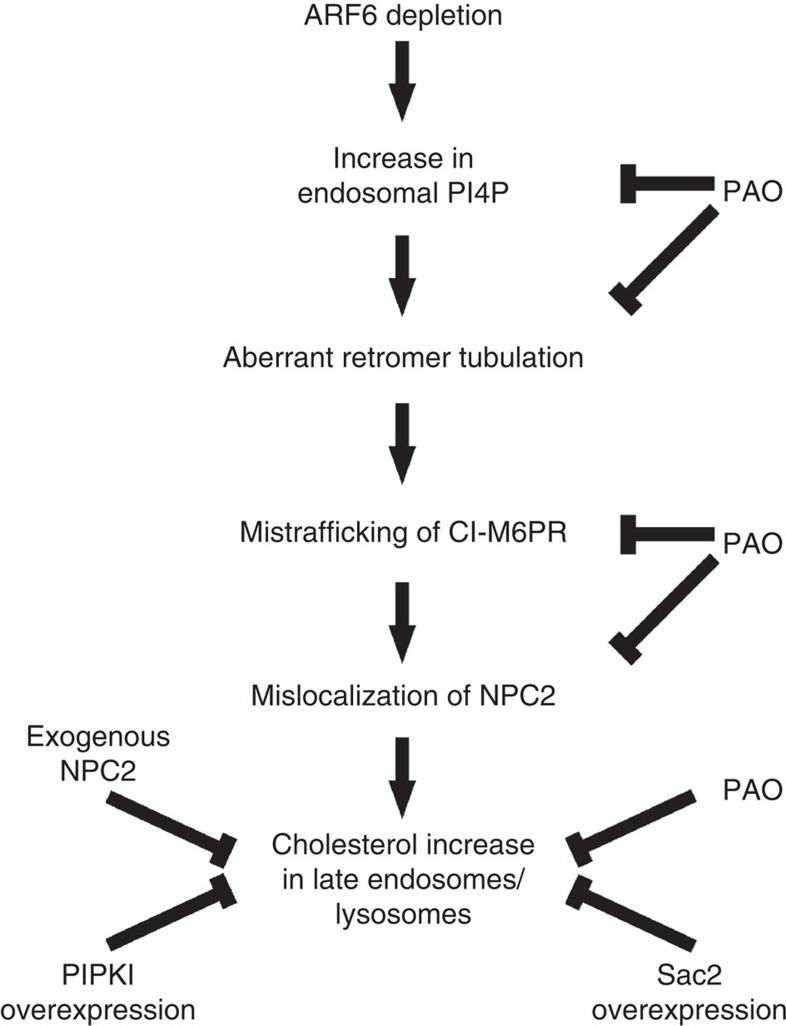
Small GTPases play a critical role in membrane traffic. Among them, Arf6 mediates transport to and from the plasma membrane, as well as phosphoinositide signalling and cholesterol homeostasis. Here we delineate the molecular basis for the link between Arf6 and cholesterol homeostasis using an inducible knockout (KO) model of mouse embryonic fibroblasts (MEFs). We find that accumulation of free cholesterol in the late endosomes/lysosomes of Arf6 KO MEFs results from mistrafficking of Niemann-Pick type C protein NPC2, a cargo of the cation-independent mannose-6-phosphate receptor (CI-M6PR). This is caused by a selective increase in an endosomal pool of phosphatidylinositol-4-phosphate (PI4P) and a perturbation of retromer, which controls the retrograde transport of CI-M6PR via sorting nexins, including the PI4P effector SNX6. Finally, reducing PI4P levels in KO MEFs through independent mechanisms rescues aberrant retromer tubulation and cholesterol mistrafficking. Our study highlights a phosphoinositide-based mechanism for control of cholesterol distribution via retromer.


Figures

Figure 1
Figure 1. Cholesterol is redistributed to late endosomes/lysosomes in Arf6 KO MEFs.
(a) Western blot analysis of endogenous Arf6 levels in Arf6Flox/Flox; Cre-ER MEFs treated with DMSO (Arf6 WT) or tamoxifen (Arf6 KO). Tubulin was used as an equal loading marker. (b) Cholesterol levels measured by LC–MS were similar in Arf6 WT (19.1±0.7 molar % of total lipidome,±indicates s.e.m., n=11) and KO cells (18.5±0.5 molar % of total lipidome, n=12). NS denotes P>0.05 in Student's t-test. (c) Representative confocal images of Arf6 WT and KO MEFs stained with filipin. Scale bar, 5 μm. (d) Normalized integrated densities of filipin staining were similar in Arf6 WT (100±8%,±indicates s.e.m., n=32 cells from three experiments) and Arf6 KO cells (98±8%, n=42 cells from four experiments). NS denotes P>0.05 in Student's t-test. (e) Quantification of filipin puncta in Arf6 WT and KO cells. Left panel, number of puncta per cell in Arf6 WT (13±2 puncta per cell,±indicates s.e.m., n=39 cells from 3 experiments) and Arf6 KO cells (26±3 puncta per cell, n=29 cells from 3 experiments). **P<0.01 in Student's t-test. Middle panel, frequency distribution of the number of filipin puncta per cell. ***P<0.001 in χ2-test. Right panel, scatter dot blot of the size of filipin puncta in Arf6 WT (0.42±0.01 μm2,±indicates s.e.m., 498 puncta from 39 cells) and KO cells (0.47±0.01 μm2, 749 puncta from 29 cells). *P<0.05 in Mann–Whitney test. (f) Representative immunostainings for EEA1, Rab7 or LAMP1 (magenta) of Arf6 WT or KO cells labelled with filipin (green). Scale bar, 5 μm. NS, not significant.
Figure 2
Figure 2. NPC2 mistrafficking causes cholesterol redistribution in Arf6 KO MEFs.
(a) Left panel, representative confocal images of Arf6 WT and KO cells immunostained for endogenous LAMP1 (magenta) and NPC2 (green). Scale bar, 5 μm. Right panel, NPC2/LAMP1 co-localization levels in Arf6 WT (23±1%,±indicates s.e.m., n=36 cells from three experiments) and Arf6 KO cells (16±1%, n=24 cells from three experiments). ***P<0.001 in Student's t-test. (b) Western blot analysis of endogenous NPC2 levels in Arf6 WT and KO cells. Tubulin was used as an equal loading marker. NPC2 protein levels were similar (P>0.05 in Student's t-test) in Arf6 WT (100±6%,±indicates s.e.m., n=3) and KO cells (110±26%, n=3). (c) NPC2-Alexa488 (green) or vehicle was added to the culture media of Arf6 WT and KO cells for 24 h. Cells were then washed, fixed and stained for endogenous LAMP1 (magenta) and cholesterol (with filipin, blue). Left panel, representative confocal images. Scale bar, 5 μm. Inset shows that exogenous NPC2 reaches the LAMP1 compartment. Center and right panel, quantification of filipin puncta. Center, number of filipin puncta in vehicle-treated Arf6 WT (16±2 puncta per cell,±indicates s.e.m., n=34 cells, three experiments), vehicle-treated KO (24±3 puncta per cell, n=35 cells, three experiments), NPC2-treated Arf6 WT (18±2 puncta per cell, n=36 cells, three experiments) and NPC2-treated KO cells (18±5 puncta per cell, n=28 cells, three experiments). NS and * stand for P>0.05 and P<0.05, respectively, in t-test with Welch's correction. Right, scatter dot blot of the size of filipin puncta of vehicle-treated Arf6 WT (0.41±0.01 μm2,±indicates s.e.m., 540 puncta from 34 cells), vehicle-treated Arf6 KO (0.48±0.01 μm2, 843 puncta from 35 cells), NPC2-treated Arf6 WT (0.46±0.01 μm2, 663 puncta from 36 cells) and NPC2-treated Arf6 KO cells (0.45±0.01 μm2, 496 puncta from 28 cells). NS denote P>0.05, *P<0.05 and ***P<0.001 in Mann–Whitney test, respectively. NS, not significant.
Figure 3
Figure 3. Retromer function is impaired in Arf6 KO MEFs.
(a) Representative maximum intensity projections of Arf6 WT and KO cells immunostained for CI-M6PR (magenta) and Vps35 (green). Scale bar, 5 μm. (b) Western blot analysis of Vps35 levels in Arf6 WT (100±5%, n=5) and KO cells (113±5%, n=5), P>0.05 in Student's t-test. Tubulin was used as an equal loading marker. (c) Representative confocal images of Arf6 WT and KO cells immunostained for EEA1 (magenta) and Vps35 (green). Scale bar, 5 μm. (d) Levels of Vps35/EEA1 co-localization in Arf6 WT (10±1%, n=26 cells) and KO cells (15±1%, n=30 cells). **P<0.01 in t-test with Welch's correction. (e) Top left panel, number of Vps35 puncta in Arf6 WT (116±8 puncta per cell, n=28 cells) and KO cells (126±6 puncta per cell, n=28 cells). ns stands for P>0.05 in Student's t-test. Top right, size of Vps35 puncta in WT (0.53±0.01 μm2, 3,241 puncta) and KO cells (0.59±0.01 μm2, 3,529 puncta). ** stands for P<0.01 in Mann–Whitney test. Bottom left, number of EEA1 puncta in WT (235±12 puncta per cell, n=28 cells) and KO cells (232±13 puncta per cell, n=23 cells). Bottom right, size of EEA1 puncta in WT (0.40±0.01 μm2, 6,571 puncta) and KO cells (0.39±0.01 μm2, 5,334 puncta). ns stands for P>0.05 in Student's t-test (left) and Mann–Whitney test (right). (f) Maximum intensity projections of 3D SIM z-stacks of Arf6 WT and KO cells immunostained for EEA1 (magenta) and Vps35 (green). Scale bar, 5 μm. (g) Spinning-disk confocal imaging of Arf6 WT and KO MEFs expressing GFP-SNX6. Top panel, representative images. Scale bar, 5 and 1 μm (insets). Arrows indicate tubules. Lower panel, quantification of GFP-SNX6 tubules. Left, number of GFP-SNX6 tubules in Arf6 WT (3±0.3 tubules per cell, n=21 cells) and KO cells (4.5±0.6 tubules per cell, n=22 cells). *P<0.05 in t-test with Welch's correction. Center, frequency distribution of GFP-SNX6 tubules length in Arf6 WT (2.6±0.2 μm, n=63 tubules) and KO cells (3.2±0.2 μm, n=97 tubules). ***P<0.001 in χ2-test. Right, persistence of GFP-SNX6 tubules in Arf6 WT (11.6±1.8 s, n=62 tubules) and KO cells (24.1±2.9 s, n=97 tubules). ***P<0.001 in t-test with Welch's correction. All values are given as mean±s.e.m.
Figure 4
Figure 4. Cholesterol is redistributed to late endosomes/lysosomes in VPS35 KD HeLa cells.
(a) Western blot analysis of VPS35 levels in HeLa cells transfected with scramble or VPS35 siRNA. Tubulin was used as an equal loading marker. (b) Representative confocal images of HeLa cells transfected with scramble or VPS35 siRNA, immunostained for LAMP1 (magenta) and VPS35 (green) and labelled with filipin (blue). Scale bar, 5 μm. (c) Normalized integrated densities of filipin staining in scramble (100±5%,±indicates s.e.m., n=29 cells, three experiments) and VPS35 siRNA cells (124±9%, n=28 cells, three experiments). *P<0.05 in t-test with Welch's correction. (d) Quantification (left) and frequency distribution (right) of the number of filipin puncta in scramble (22±4 puncta per cell, ± indicates s.e.m., n=33 cells, three experiments) and VPS35 siRNA cells (39±5 puncta per cell, n=32 cells, three experiments). *P<0.05 in Student's t-test and ***P<0.001 in χ2-test. (e) Scatter dot blot of the size of filipin puncta in scramble (0.71±0.03 μm2, ± indicates s.e.m., 741 puncta from 33 cells) and VPS35 siRNA cells (0.73±0.02 μm2, 1,241 puncta from 32 cells). **P<0.01 in Mann–Whitney test.
Figure 5
Figure 5. PI4P is increased in Arf6 KO cells and accumulates in retromer-positive endosomes.
(a) Bar diagram showing lipid levels in Arf6 WT and KO cells. Measurements were made by anionic exchange HPLC with suppressed conductivity detection, expressed in molar percentage of total anionic phospholipid measured and normalized to Arf6 WT levels. PI4P levels were increased in Arf6 KO cells (121±5%, ± indicates s.e.m., n=9) compared with controls (100±5%, n=9). **P<0.01 in Student's t-test. (b) Left, representative confocal images of Arf6 WT and KO cells immunostained for PI4P (magenta) and Golgin97 (green). Scale bar, 5 μm. Right, normalized integrated densities of PI4P staining were increased in Arf6 KO cells (191±23%, ± indicates s.e.m., n=27 cells, three experiments) compared to controls (100±12%, n=22 cells, three experiments). **P<0.01 in t-test with Welch's correction. (c) Left, representative confocal images of Arf6 WT and KO cells immunostained for PI4P (magenta) and EEA1 (green). Scale bar, 5 μm. Right, PI4P/EEA1 co-localization levels in Arf6 WT (7±1%, ± indicates s.e.m., n=25 cells, three experiments) and KO cells (13±1%, n=22 cells, three experiments). ***P<0.001 in Student's t-test. (d) Left, representative confocal images of Arf6 WT and KO cells immunostained for PI4P (magenta) and SNX6 (green). Scale bar, 5 μm. Right, PI4P/SNX6 co-localization levels in WT (7±1%, ± indicates s.e.m., n=33 cells, three experiments) and KO cells (11±2%, n=24 cells, three experiments). *P<0.05 in Student's t-test.
Figure 6
Figure 6. Lowering PI4P levels with PAO rescues excessive retromer tubulation and cholesterol accumulation in LE/LYS in Arf6 KO cells.
(a) Normalized integrated densities of PI4P staining (see d) of Arf6 KO cells treated with DMSO (100±9%,±indicates s.e.m., n=22 cells, 3 experiments) or PAO (79±4%, n=29 cells, three experiments). *P<0.05 in t-test with Welch's correction. (b) Bar diagram showing PI4P levels in DMSO- and PAO-treated Arf6 KO cells. Measurements were made by anionic exchange HPLC with suppressed conductivity detection, expressed in molar percentage of measured lipids and normalized to DMSO-treated Arf6 KO levels. PI4P levels were decreased in PAO-(63±5%, ± indicates s.e.m., n=4) compared with DMSO-treated controls (100±1%, n=4). ***P<0.001 in Student's t-test. (c) Kinetic following of GFP-SNX6 tubulation in Arf6 KO MEFs treated with DMSO or PAO by spinning-disk live imaging. Top panel, representative images of Arf6 KO cells after different times of PAO treatment. Arrows indicate tubules. Scale bar, 5 and 1 μm (zoom-ins). Lower panel, quantification of the number of GFP-SNX6 tubules after DMSO (black, n=9 cells, four experiments) or PAO treatment (red, n=9 cells, four experiments), normalized to the number of tubules before the treatment. *P<0.05 and ***P<0.001 in two-way ANOVA with Bonferroni post-tests, respectively. (d) Left, representative immunostaining for PI4P (magenta) of Arf6 KO cells treated with DMSO or PAO and labelled with filipin (blue). Scale bar, 5 μm. Middle, quantification of the absolute number and relative distribution of filipin puncta in DMSO-(37±3 puncta/cell,±indicates s.e.m., n=37 cells, 4 experiments) or PAO-(30±3 puncta per cell, n=29 cells, four experiments) treated Arf6 KO cells. NS denotes P>0.05 in Student's t-test. **P<0.01 in χ2-test. Right, size of filipin puncta in DMSO-(0.53±0.01 μm2,±indicates s.e.m., 1,352 puncta, 37 cells) or PAO-(0.50±0.01 μm2, 876 puncta, 29 cells) treated Arf6 KO cells. **P<0.01 in Mann–Whitney test. NS, not significant.
Figure 7
Figure 7. Lowering PI4P levels through GFP-PIPKIγi1 or GFP-Sac2 overexpression rescues cholesterol redistribution in Arf6 KO cells.
(a) Left, representative confocal images of Arf6 KO cells expressing the K188A mutant (top) or the wild-type (bottom) GFP-PIPKIγi1 (green) labelled with filipin (blue). Scale bar, 5 μm. Center, quantification of the absolute number and relative distribution of filipin puncta in Arf6 KO cells expressing K188A GFP-PIPKIγi1 (31±4 puncta per cell,±indicates s.e.m., n=24 cells, three experiments) or WT GFP-PIPKIγi1 (18±2 puncta per cell, n=38 cells, five experiments). **P<0.01 in t-test with Welch's correction. ***P<0.001 in χ2-test. Right, size of filipin puncta in Arf6 KO cells expressing K188A GFP-PIPKIγi1 (0.51±0.01 μm2,±indicates s.e.m., 742 puncta, 24 cells) or WT GFP-PIPKIγi1 (0.42±0.01 μm2, 671 puncta, 38 cells). ***P<0.001 in Mann–Whitney test. (b) Left, representative confocal images of Arf6 KO cells expressing the C458S mutant (top) or the wild-type (bottom) GFP-Sac2 (green) and labelled with filipin (magenta). Scale bar, 5 μm. Center, quantification of the absolute number and relative distribution of filipin puncta in Arf6 KO cells expressing C458S GFP-Sac2 (56±5 puncta per cell,±indicates s.e.m., n=27 cells, three experiments) or WT GFP-Sac2 (35±6 puncta per cell, n=12 cells, three experiments). *P<0.05 in Student's t-test. ***P<0.001 in χ2-test. Right, size of filipin puncta in Arf6 KO cells expressing C458S GFP-Sac2 (0.52±0.01 μm2, ± indicates s.e.m., 1,517 puncta, 27 cells) or WT GFP-Sac2 (0.48±0.02 μm2, 417 puncta, 12 cells). *P<0.05 in Mann–Whitney test.
Figure 8
Figure 8. Model of Arf6 regulation of cholesterol homeostasis.
Arf6 controls an endosomal pool of PI4P and regulates retromer tubules dynamics in the endosome-to-TGN pathway, consequently impacting CI-M6PR and NPC2 localization (see also text). PAO: PI4K inhibitor.

References

    1. Gillingham A. K. & Munro S. The small G proteins of the Arf family and their regulators. Annu. Rev. Cell Dev. Biol. 23, 579–611 (2007). - PubMed
    1. D'Souza-Schorey C., Li G., Colombo M. I. & Stahl P. D. A regulatory role for ARF6 in receptor-mediated endocytosis. Science 267, 1175–1178 (1995). - PubMed
    1. Peters P. J. et al. Overexpression of wild-type and mutant ARF1 and ARF6: distinct perturbations of nonoverlapping membrane compartments. J. Cell Biol. 128, 1003–1017 (1995). - PMC - PubMed
    1. Donaldson J. G. Multiple roles for Arf6: sorting, structuring, and signalling at the plasma membrane. J. Biol. Chem. 278, 41573–41576 (2003). - PubMed
    1. D'Souza-Schorey C. & Chavrier P. ARF proteins: roles in membrane traffic and beyond. Nat. Rev. Mol. Cell Biol. 7, 347–358 (2006). - PubMed

Publication types