

NUPR1, a new target in liver cancer: implication in controlling cell growth, migration, invasion and sorafenib resistance
- PMID: 27336713
- PMCID: PMC5143401
- DOI: 10.1038/cddis.2016.175
NUPR1, a new target in liver cancer: implication in controlling cell growth, migration, invasion and sorafenib resistance
Abstract
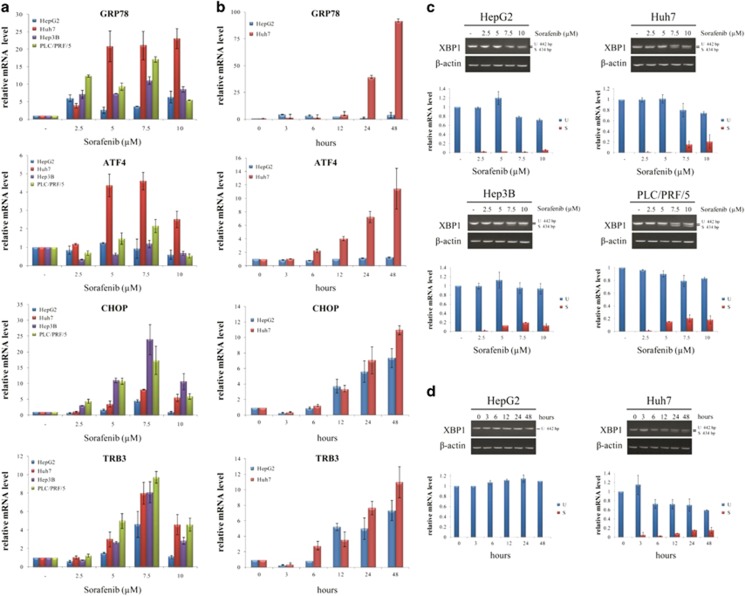
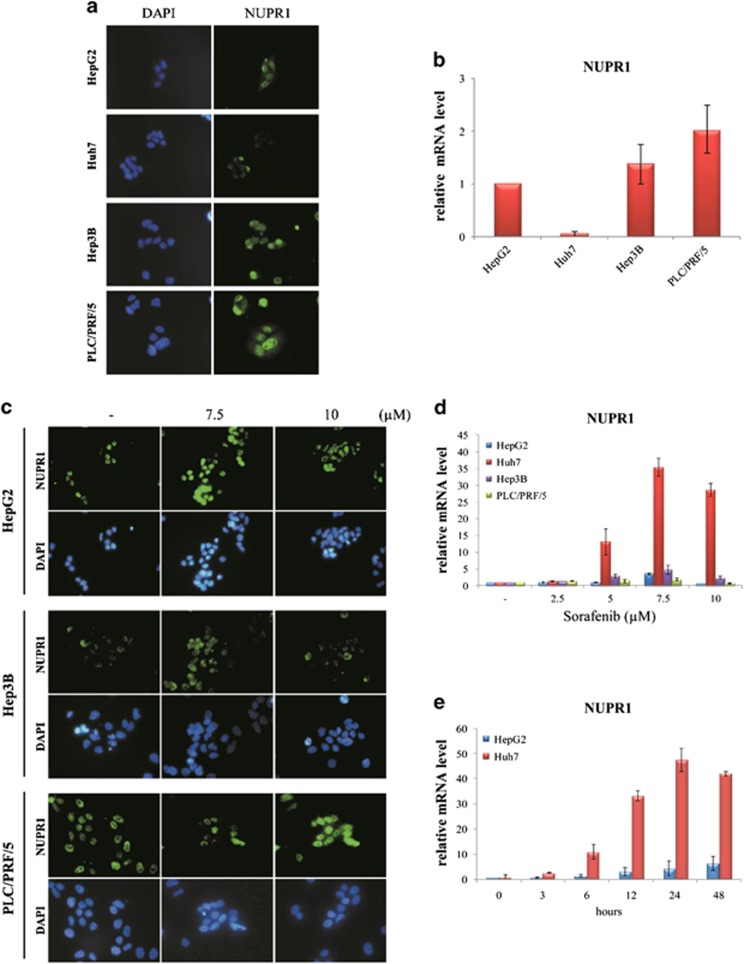
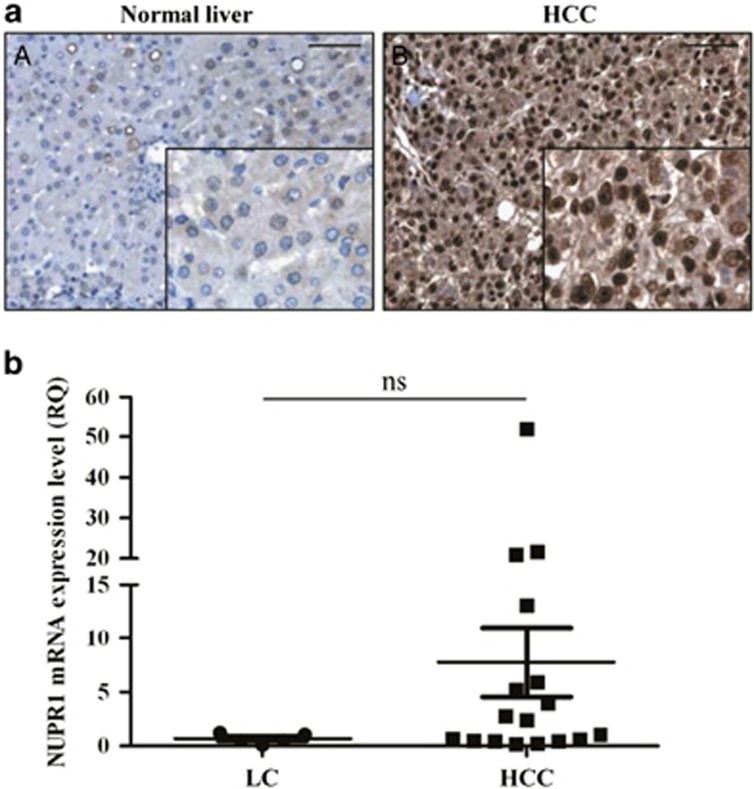
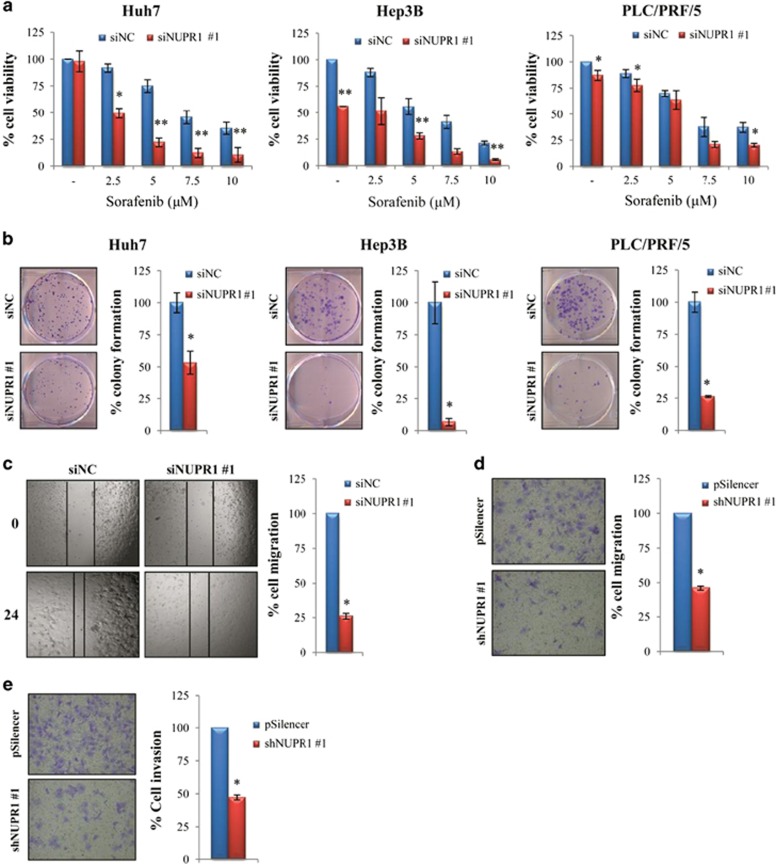
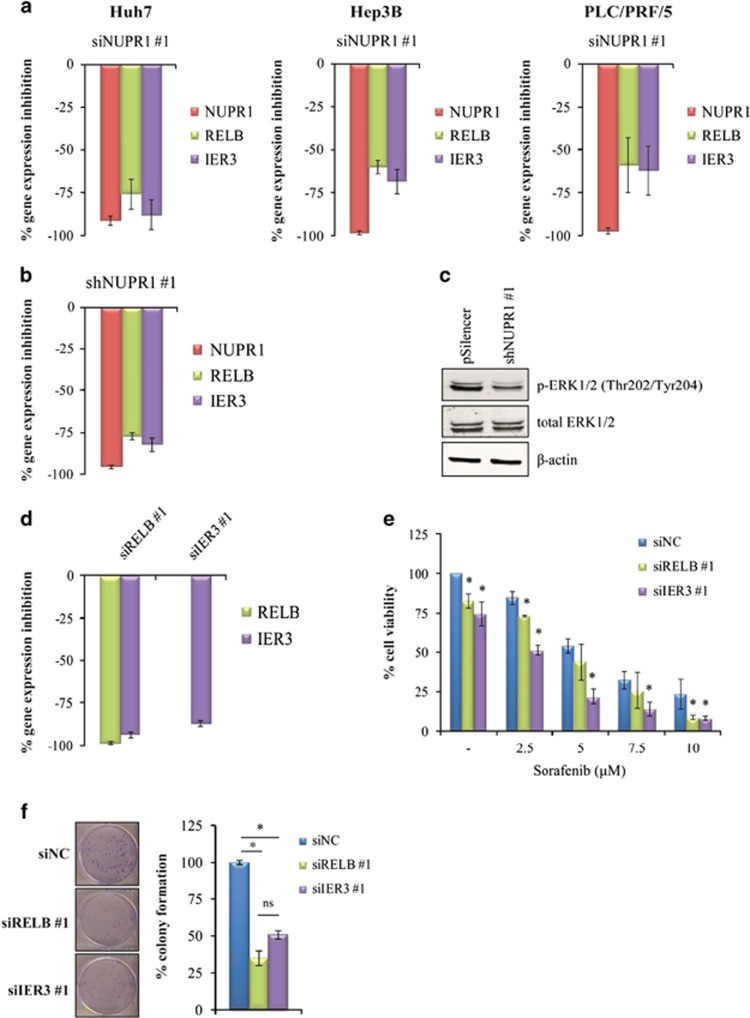
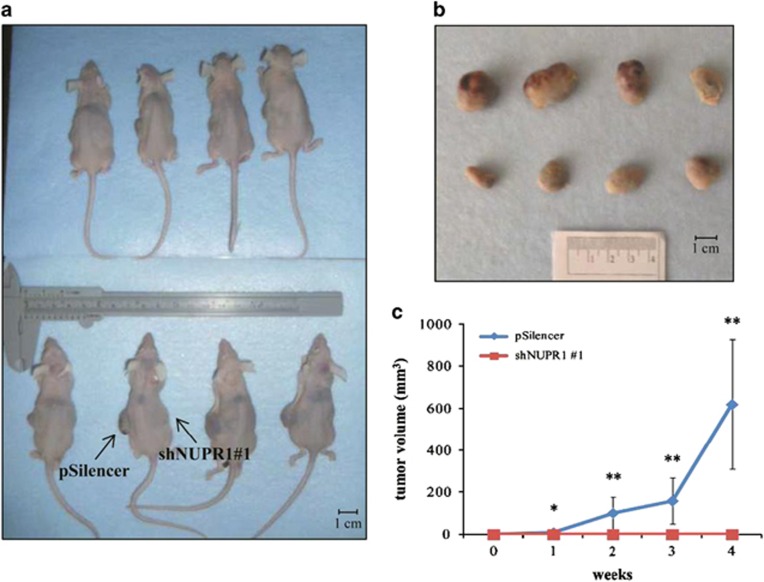
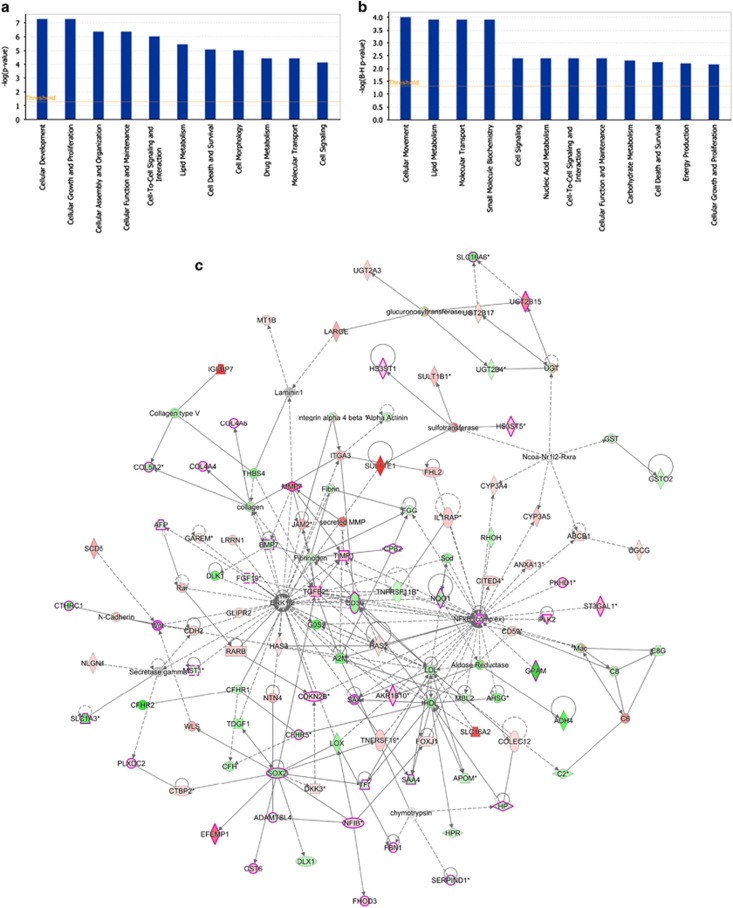
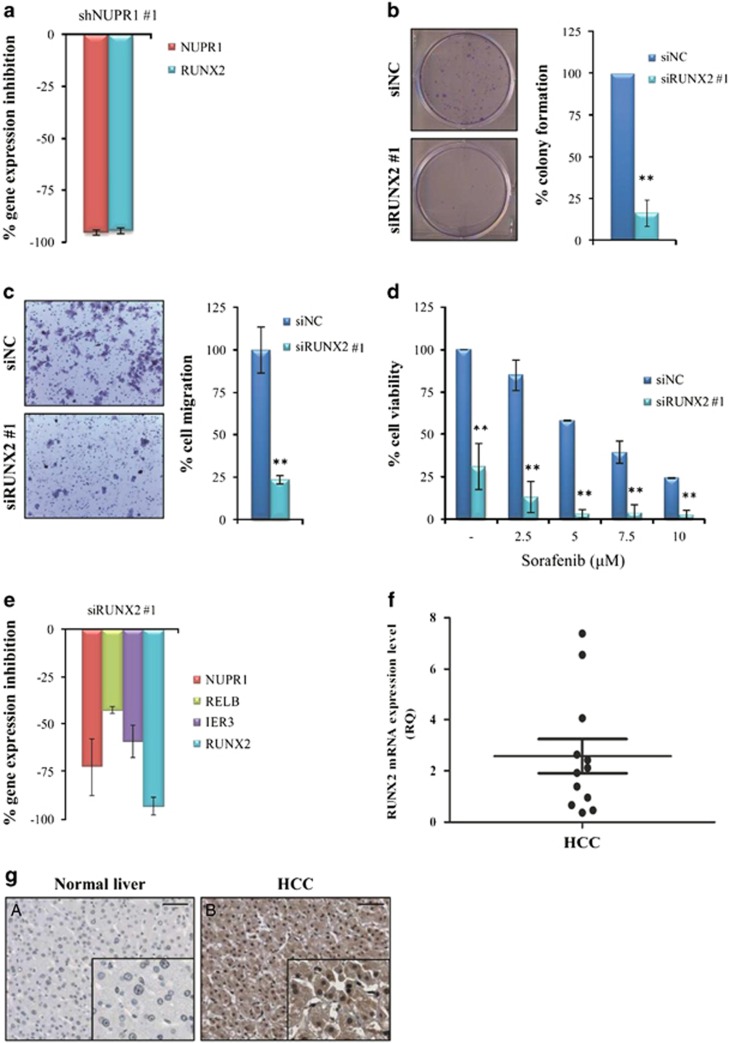
Sorafenib, an oral multikinase inhibitor, is the only approved agent for the treatment of advanced hepatocellular carcinoma (HCC). However, its benefits are modest, and as its mechanisms of action remain elusive, a better understanding of its anticancer effects is needed. Based on our previous study results, we investigated here the implication of the nuclear protein 1 (NUPR1) in HCC and its role in sorafenib treatment. NUPR1 is a stress-inducible protein that is overexpressed in various malignancies, but its role in HCC is not yet fully understood. We found that NUPR1 expression was significantly higher in primary human HCC samples than in the normal liver. Knockdown of NUPR1 significantly increased cell sensitivity to sorafenib and inhibited the cell growth, migration and invasion of HCC cells, both in vitro and in vivo. Moreover, NUPR1 silencing influenced the expression of RELB and IER3 genes. Unsurprisingly, RELB and IER3 knockdown also inhibited HCC cell viability, growth and migration. Using gene expression profiling of HCC cells following stable NUPR1 knockdown, we found that genes functionally involved in cell death and survival, cellular response to therapies, lipid metabolism, cell growth and proliferation, molecular transport and cellular movement were mostly suppressed. Network analysis of dynamic gene expression identified NF-κB and ERK as downregulated gene nodes, and several HCC-related oncogenes were also suppressed. We identified Runt-related transcription factor 2 (RUNX2) gene as a NUPR1-regulated gene and demonstrated that RUNX2 gene silencing inhibits HCC cell viability, growth, migration and increased cell sensitivity to sorafenib. We propose that the NUPR1/RELB/IER3/RUNX2 pathway has a pivotal role in hepatocarcinogenesis. The identification of the NUPR1/RELB/IER3/RUNX2 pathway as a potential therapeutic target may contribute to the development of new treatment strategies for HCC management.
Figures
Similar articles
-
A microRNA-7/growth arrest specific 6/TYRO3 axis regulates the growth and invasiveness of sorafenib-resistant cells in human hepatocellular carcinoma.Hepatology. 2018 Jan;67(1):216-231. doi: 10.1002/hep.29478. Epub 2017 Nov 29. Hepatology. 2018. PMID: 28833396
-
The NUPR1/p73 axis contributes to sorafenib resistance in hepatocellular carcinoma.Cancer Lett. 2021 Oct 28;519:250-262. doi: 10.1016/j.canlet.2021.07.026. Epub 2021 Jul 24. Cancer Lett. 2021. PMID: 34314755
-
NUPR1 is a novel potential biomarker and confers resistance to sorafenib in clear cell renal cell carcinoma by increasing stemness and targeting the PTEN/AKT/mTOR pathway.Aging (Albany NY). 2021 May 24;13(10):14015-14038. doi: 10.18632/aging.203012. Epub 2021 May 24. Aging (Albany NY). 2021. PMID: 34030133 Free PMC article.
-
NUPR1 and its potential role in cancer and pathological conditions (Review).Int J Oncol. 2021 May;58(5):21. doi: 10.3892/ijo.2021.5201. Epub 2021 Mar 24. Int J Oncol. 2021. PMID: 33760183 Review.
-
The mechanisms of sorafenib resistance in hepatocellular carcinoma: theoretical basis and therapeutic aspects.Signal Transduct Target Ther. 2020 Jun 10;5(1):87. doi: 10.1038/s41392-020-0187-x. Signal Transduct Target Ther. 2020. PMID: 32532960 Free PMC article. Review.
Cited by
-
BET inhibitor suppresses migration of human hepatocellular carcinoma by inhibiting SMARCA4.Sci Rep. 2021 Jun 3;11(1):11799. doi: 10.1038/s41598-021-91284-2. Sci Rep. 2021. PMID: 34083693 Free PMC article.
-
The interplay of transcriptional coregulator NUPR1 with SREBP1 promotes hepatocellular carcinoma progression via upregulation of lipogenesis.Cell Death Discov. 2022 Oct 28;8(1):431. doi: 10.1038/s41420-022-01213-z. Cell Death Discov. 2022. PMID: 36307402 Free PMC article.
-
NUPR1 promotes the proliferation and metastasis of oral squamous cell carcinoma cells by activating TFE3-dependent autophagy.Signal Transduct Target Ther. 2022 Apr 25;7(1):130. doi: 10.1038/s41392-022-00939-7. Signal Transduct Target Ther. 2022. PMID: 35462576 Free PMC article.
-
CircRNA HIPK3 promotes the progression of oral squamous cell carcinoma through upregulation of the NUPR1/PI3K/AKT pathway by sponging miR-637.Ann Transl Med. 2021 May;9(10):860. doi: 10.21037/atm-21-1908. Ann Transl Med. 2021. PMID: 34164494 Free PMC article.
-
Transcriptional alterations of protein coding and noncoding RNAs in triple negative breast cancer in response to DNA methyltransferases inhibition.Cancer Cell Int. 2021 Sep 26;21(1):515. doi: 10.1186/s12935-021-02213-2. Cancer Cell Int. 2021. PMID: 34565361 Free PMC article.
References
-
- Wilhelm SM, Carter C, Tang L, Wilkie D, McNabola A, Rong H et al. Bay 43-9006 exhibits broad spectrum oral antitumor activity and targets the Raf/MEK/ERK pathway and receptor tyrosine kinases involved in tumor progression and angiogenesis. Cancer Res 2004; 64: 7099–7109. - PubMed
-
- Liu L, Cao Y, Chen C, Zhang X, McNabola A, Wilkie D et al. Sorafenib blocks the RAF/MEK/ERK pathway, inhibits tumor angiogenesis, and induces tumor cell apoptosis in hepatocellular carcinoma model PLC/PRF/5. Cancer Res 2006; 66: 11851–11858. - PubMed
-
- Tai WT, Cheng AL, Shiau CW, Huang HP, Huang JW, Chen PJ et al. Signal transducer and activator of transcription 3 is a major kinase-independent target of sorafenib in hepatocellular carcinoma. J Hepatol 2011; 55: 1041–1048. - PubMed
-
- Yi P, Higa A, Taouji S, Bexiga MG, Marza E, Arma D et al. Sorafenib-mediated targeting of the AAA+ ATPase p97/VCP leads to disruption of the secretory pathway, endoplasmic reticulum stress, and hepatocellular cancer cell death. Mol Cancer Ther 2012; 11: 2610–2620. - PubMed
MeSH terms
Substances
LinkOut - more resources
Full Text Sources
Other Literature Sources
Medical
Molecular Biology Databases
Research Materials
Miscellaneous
