. 2016 Jun 23:5:e16691.
doi: 10.7554/eLife.16691.

Set1/COMPASS and Mediator are repurposed to promote epigenetic transcriptional memory

Affiliations

Set1/COMPASS and Mediator are repurposed to promote epigenetic transcriptional memory

Agustina D'Urso et al. Elife. .

Abstract

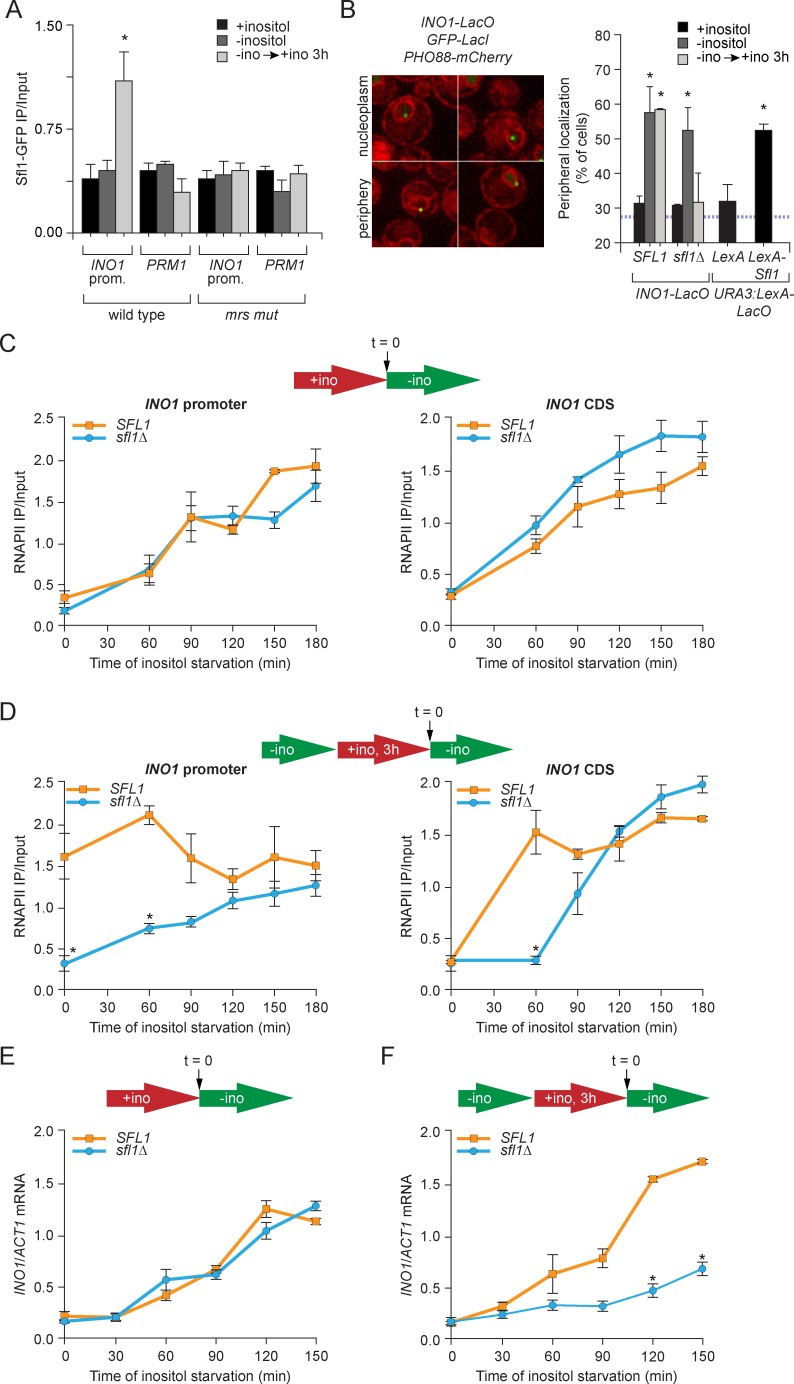
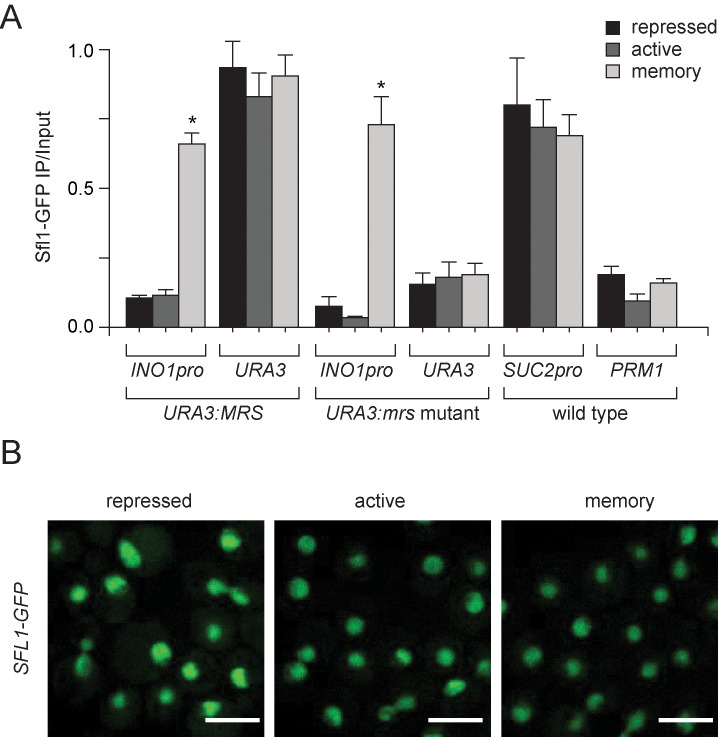
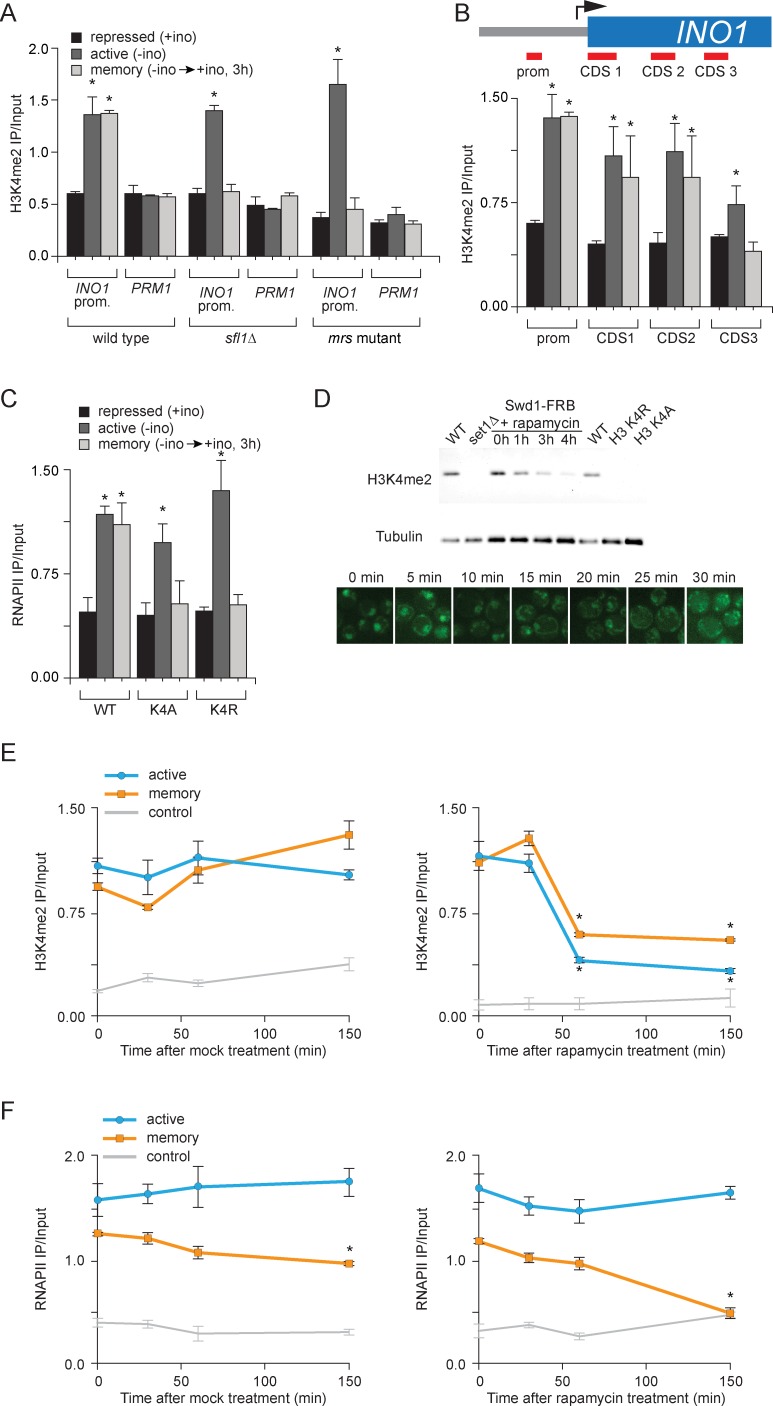
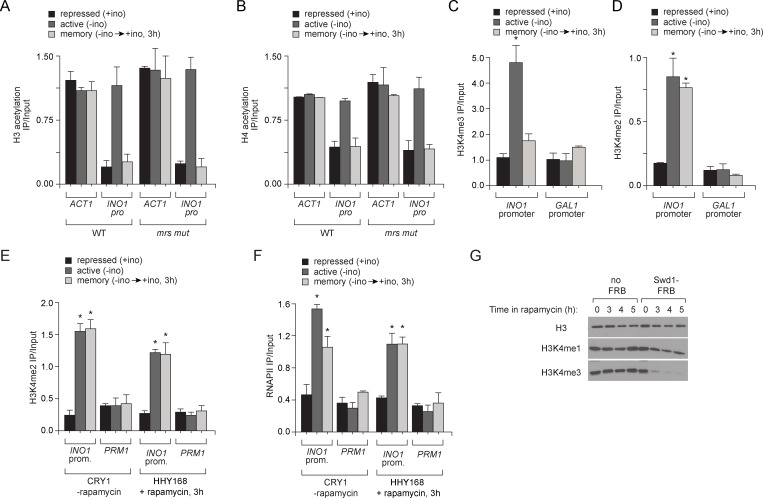
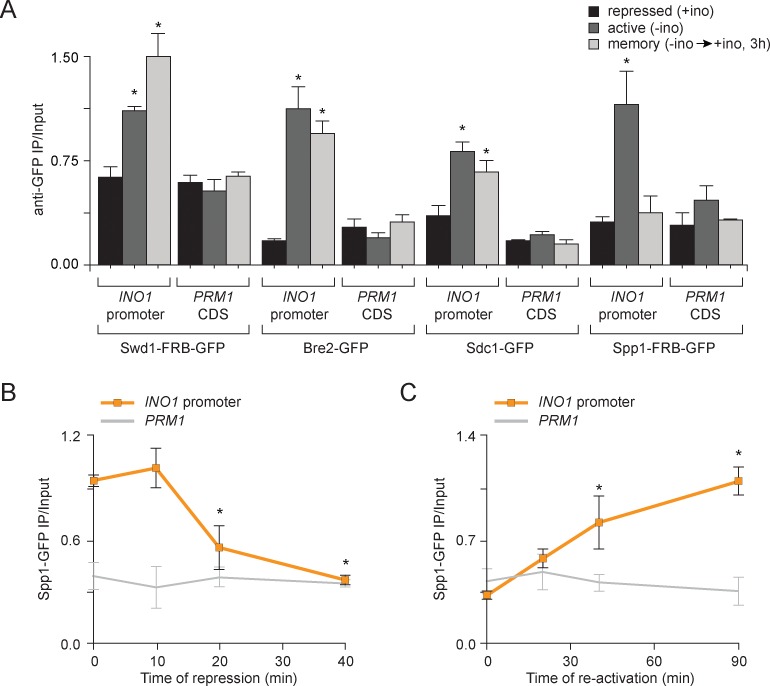
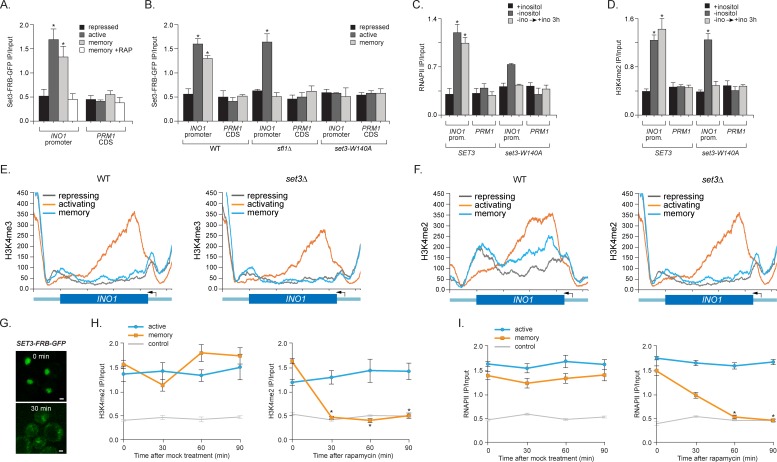
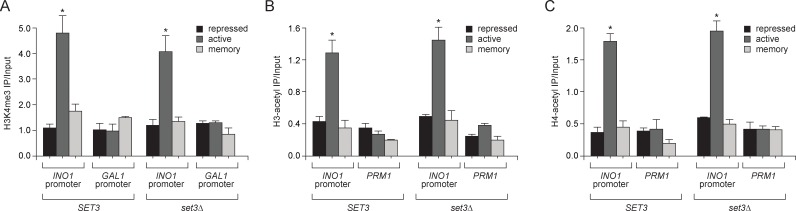
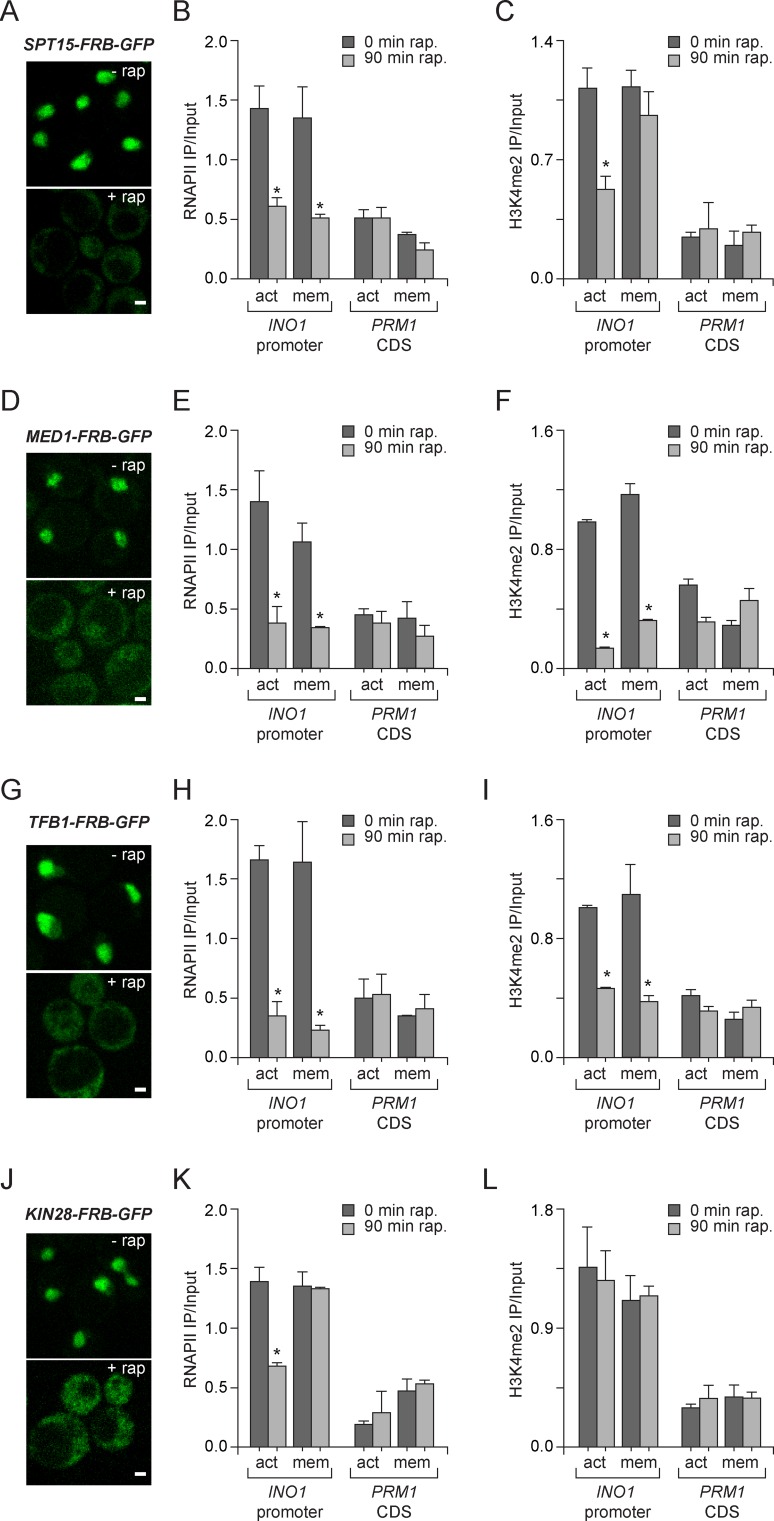
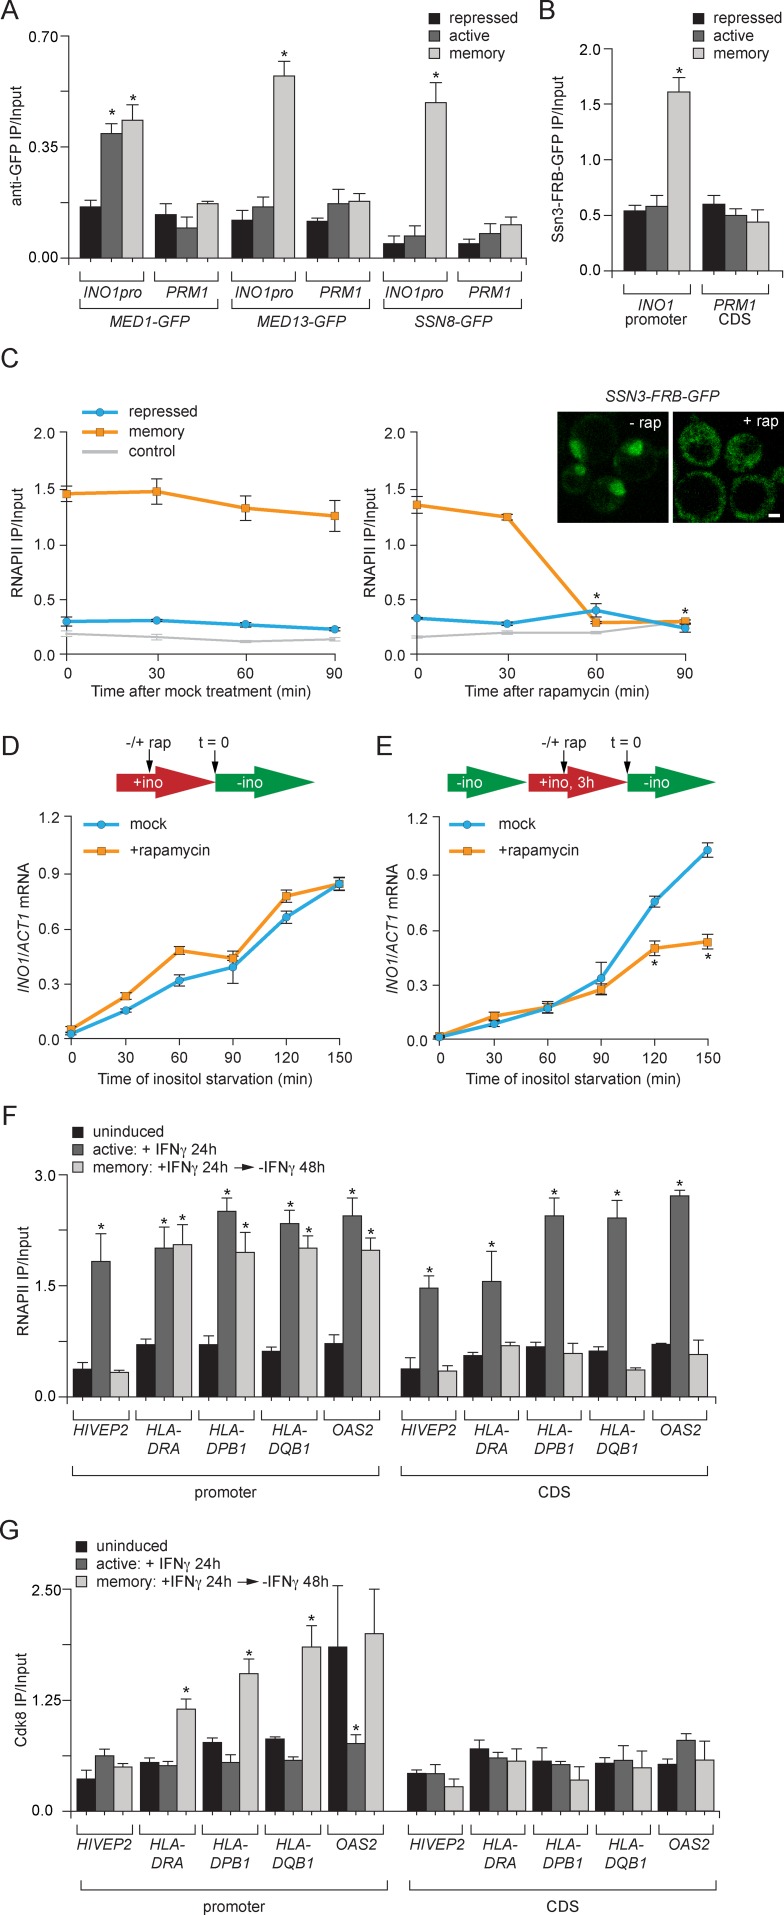
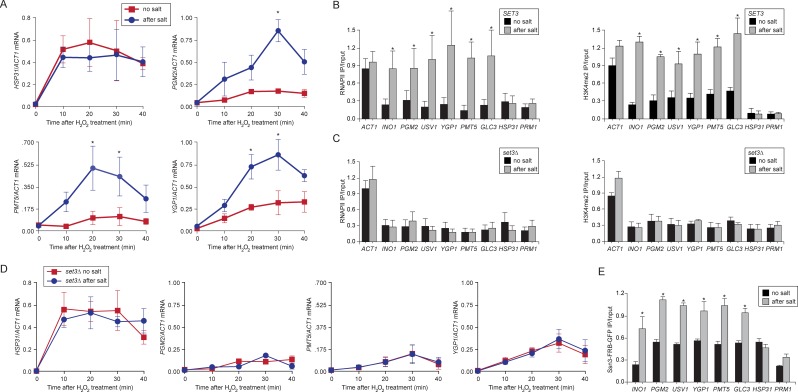
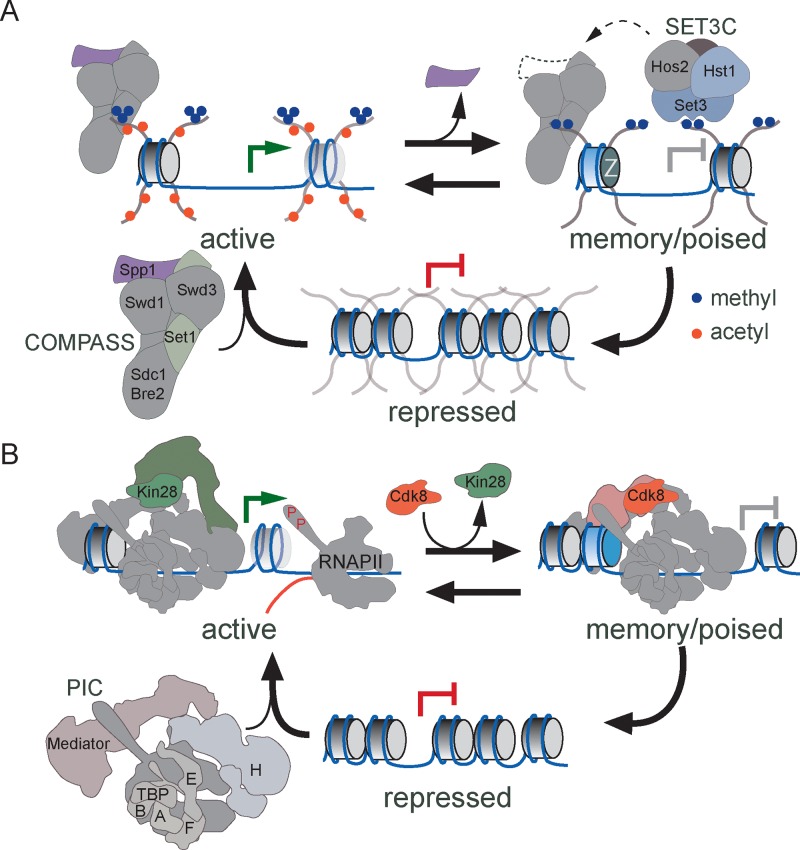
In yeast and humans, previous experiences can lead to epigenetic transcriptional memory: repressed genes that exhibit mitotically heritable changes in chromatin structure and promoter recruitment of poised RNA polymerase II preinitiation complex (RNAPII PIC), which enhances future reactivation. Here, we show that INO1 memory in yeast is initiated by binding of the Sfl1 transcription factor to the cis-acting Memory Recruitment Sequence, targeting INO1 to the nuclear periphery. Memory requires a remodeled form of the Set1/COMPASS methyltransferase lacking Spp1, which dimethylates histone H3 lysine 4 (H3K4me2). H3K4me2 recruits the SET3C complex, which plays an essential role in maintaining this mark. Finally, while active INO1 is associated with Cdk8(-) Mediator, during memory, Cdk8(+) Mediator recruits poised RNAPII PIC lacking the Kin28 CTD kinase. Aspects of this mechanism are generalizable to yeast and conserved in human cells. Thus, COMPASS and Mediator are repurposed to promote epigenetic transcriptional poising by a highly conserved mechanism.

Keywords: Mediator; S. cerevisiae; cell biology; chromatin; chromosomes; epigenetics; genes; histone; human; nuclear architecture; transcription.


Conflict of interest statement

AS: Reviewing editor, eLife.

The other authors declare that no competing interests exist.

Figures

Figure 1.
Figure 1.. Sfl1 binds to the MRS to promote transcriptional memory.
(A) Chromatin immunoprecipitation (ChIP) of Sfl1-GFP from wild type and mrs mutant INO1 strains, quantified relative to the input fraction using primers to amplify the INO1 promoter (−348 to −260) or the PRM1 CDS, a repressed locus. The averages of three biological replicates are shown ± standard error of the mean. *p<0.05, compared with repressing conditions (Student’s t-test). (B) Left: representative confocal micrographs of INO1-LacO in a strain expressing GFP-LacI and PHO88-mCherry scored as either nucleoplasmic or nuclear periphery. Right: quantified chromatin localization of the percentage of the population in which the indicated locus colocalized with the nuclear envelope. INO1-LacO in either a wild type or sfl1∆ strain was localized in cells grown in repressing (+inositol), activating (-inositol) or memory conditions (switched from medium lacking inositol to medium containing 100 μM inositol for 3 hr (−ino → +ino). *p<0.05, compared with repressing conditions (Student’s t-test). URA3:LexA-LacO was localized in cells expressing either LexA or LexA-Sfl1 grown under repressing conditions. *p<0.05, compared with LexA alone (Student’s t-test). The hatched blue line indicates the baseline for this assay (Brickner and Walter, 2004). (C and D) ChIP of RNA polymerase II from wild-type and slf1∆ cells fixed at indicated time points during activation (C) and reactivation (D). At time = 0, cells were shifted from repressing medium containing 100 μM inositol (red arrow in schematic) to medium without inositol (green arrow in schematic). For reactivation, cells were shifted from activating medium to repressing medium containing 100 μM inositol for 3 hr. Left panels were quantified relative to input using the INO1 promoter primer set (-348 to -260, relative to the ATG); right panels were quantified relative to input using INO1 coding sequence primer set (+663 to +798, relative to ATG). *p<0.05, compared with the repressing condition (Student’s t-test). (E and F) INO1 activation (E) or reactivation (F) in wild type and sfl1∆ cells (schematic as in C and D). Cells were harvested at the indicated time points, and INO1 mRNA levels were quantified relative to ACT1 mRNA levels by RT-qPCR. The averages of three biological replicates are shown ± standard error of the mean. *p<0.05, compared with the same time point in the SFL1 strain (Student’s t-test). DOI: http://dx.doi.org/10.7554/eLife.16691.003
Figure 1—figure supplement 1.
Figure 1—figure supplement 1.. Sfl1 binding to the INO1 promoter is regulated by its context.
(A) Chromatin immunoprecipitation (ChIP) of Sfl1-GFP from cells having the MRS or mrs mutant inserted beside URA3 grown under the indicated conditions. The recovery of the INO1 promoter, URA3, the SUC2 promoter and PRM1 was quantified by qPCR relative to input. Averages of three biological replicates and standard error of the mean. *p<0.05, compared with repressing condition (Student’s t-test). (B) Confocal sum projections of stacks of SFL1-GFP cells grown under the indicated conditions, imaged using identical settings. Scale bar = 5 µm. DOI: http://dx.doi.org/10.7554/eLife.16691.004
Figure 2.
Figure 2.. H3K4 dimethylation is an essential memory mark that is deposited by COMPASS.
(A and B) Chromatin immunoprecipitation using anti-H3K4me2 from wild-type, sfl1∆ or mrs mutant strains grown under repressing, activating or memory conditions, quantified using the INO1 promoter primer set (−348 to −260) or, as a negative control, the PRM1 CDS primer set. *p<0.05, compared with the repressing condition (Student’s t-test). (B) Recovery was quantified relative to input fractions using the promoter primer set or three different primer sets at the following postitions: pro, -348 to -260; CDS1, +41 to +161; CDS2, +361 to +499; CDS3, +663 to +798. (C) ChIP using anti-RNAPII from wild type and histone mutant (H3K4A or H3K4R) strains grown under repressing, activating and memory conditions using primers to the INO1 promoter or PRM1 CDS. *p<0.05, compared with the repressing condition (Student’s t-test). (D) Top: immunoblot against H3K4me2 or Tubulin in whole cell extracts from the indicated strains. A strain expressing Rpl13-FKBP and having the COMPASS subunit Swd1 tagged with FRB-GFP was treated with 1 µg/ml rapamycin. Bottom: confocal micrographs of Swd1-FRB-GFP at the indicated times after addition of rapamycin. (E and F) ChIP of H3K4me2 (E) and RNAPII (F) from Swd1-FRB-GFP strain grown under activation (-ino) or memory conditions (−ino → +ino) using primers to amplify the INO1 promoter or the PRM1 CDS. Cells were fixed at the indicated times after addition of either DMSO (mock) or rapamycin. *p<0.05, compared with t = 0 (Student’s t-test). DOI: http://dx.doi.org/10.7554/eLife.16691.005
Figure 2—figure supplement 1.
Figure 2—figure supplement 1.. Chromatin signature of transcriptional memory.
Chromatin immunoprecipitation (ChIP) using anti-acetyl H3 (A), anti-acetyl H4 (B), anti-H3K4me3 (C) and anti-H3K4me2 (D) from either wild-type or mrs mutant strains grown under repressing, activating or memory conditions. ACT1 coding sequence serves as a positive control and GAL1 promoter serves as a negative control. *p<0.05, compared with the repressing condition (Student’s t-test). (E and F) Chromatin immunoprecipitation (ChIP) using anti-H3K4me2 (E) or anti-RNAPII (F) for CRY1 cells and HHY168 cells after 3 hr of rapamycin treatment. (G) Immunoblots against histone H3, H3K4me1 and H3K4me3 from lysates prepared from HHY168 (no FRB) or ADY23 (Swd1-FRB-GFP) at the indicated times after addition of 1 µg/ml rapamycin. DOI: http://dx.doi.org/10.7554/eLife.16691.006
Figure 3.
Figure 3.. Transcriptional memory leads to remodeling of COMPASS.
(A) ChIP against COMPASS subunits Swd1-GFP, Bre2-GFP, Sdc1-GFP, and Spp1-GFP from cells grown under repressing, activating or memory conditions. (B and C) ChIP against Spp1-GFP at the indicated times either after shifting cells from activating to repressing conditions (B) or after shifting cells back from repressing to activating conditions following 3 hr of repression (C). All ChIP experiments are averages of three biological replicates ± standard error of the mean, quantified relative to input using primers to amplify the INO1 promoter (−348 to −260) or the PRM1 CDS. *p<0.05, compared with the repressing condition (A) or compared with the 0 min time point (B and C) (Student’s t-test). DOI: http://dx.doi.org/10.7554/eLife.16691.007
Figure 4.
Figure 4.. Set3 recruitment to the INO1 promoter under memory conditions requires both Sfl1 and the PHD finger.
(A) ChIP against Set3-GFP from cells grown under repressing, activating or memory conditions +/- rapamycin. (B) ChIP against SET3-GFP from wild type, sfl1∆ or set3-W140A cells grown under repressing, activating or memory conditions. (C and D) ChIP against RNAPII (C) and H3K4me2 (D) from wild type an set3-W140A strains grown under repressing, activating or memory conditions. For A–D, *p<0.05, compared with the repressing condition (Student’s t-test). (E and F) ChIP sequencing against H3K4me3 (E) and H3K4me2 (F) from wild type (left) and set3∆ (right) strains grown under repressing, activating and memory conditions using primers to amplify the INO1 promoter (−348 to −260) or the PRM1 CDS. (G) Confocal micrographs of Set3-FRB-GFP at the indicated times after addition of rapamycin. (H and I) ChIP of H3K4me2 (H) and RNAPII (I) from Set3-FRB-GFP strain grown under activation (-ino) or memory conditions (−ino → +ino). Cells were fixed at the indicated times after addition of either DMSO (mock) or rapamycin. All ChIP experiments were quantified by qPCR and are plotted as averages of three biological replicates ± standard error of the mean. *p<0.05, compared with t=0 (Student’s t-test). DOI: http://dx.doi.org/10.7554/eLife.16691.008
Figure 4—figure supplement 1.
Figure 4—figure supplement 1.. Loss of Set3 has no effect on histone acetylation or H3K4me3 at the INO1 promoter.
(A) Chromatin immunoprecipitation (ChIP) using anti-H3K4me3 (A), anti-acetyl H3 (B) and anti-acetyl H4 (C) from either wild-type or set3Δ grown under repressing, activating or memory conditions. GAL1 promoter and PRM1 serve as a negative controls. *p<0.05, compared with the repressing condition (Student’s t-test). DOI: http://dx.doi.org/10.7554/eLife.16691.010
Figure 5.
Figure 5.. Molecular requirements for PIC assembly during transcriptional memory.
(A, D, G and J) Confocal micrographs of the indicated proteins fused to FRB-GFP before or after treatment with rapamycin for 90 min. (B, E, H and K) ChIP against RNAPII from strains expressing Spt15-FRB-GFP (B), Med1-FRB-GFP (E), TFB1-FRB-GFP (H) or Kin28-FRB-GFP (K), grown under either activating or memory conditions, before or after treatment 1 µg/ml of rapamycin. (C, F, I and L) ChIP against H3K4me2 from strains expressing Spt15-FRB-GFP (C), Med1-FRB-GFP (F), TFB1-FRB-GFP (I) or Kin28-FRB-GFP (L), grown under either activating or memory conditions, before or after treatment 1 µg/ml of rapamycin. All ChIP experiments are averages of three biological replicates ± standard error of the mean, quantified as in panel 1A, using primers to amplify the INO1 promoter (−348 to −260) or the PRM1 CDS. Mock treatment had no effect (not shown). *p<0.05, compared with 0 min rapamycin (Student’s t-test). DOI: http://dx.doi.org/10.7554/eLife.16691.011
Figure 6.
Figure 6.. Transcriptional memory leads to Ssn3/Cdk8-dependent poised preinitiation complex.
(A) ChIP against Med1-GFP, Med13-GFP or Ssn8-GFP from cells grown under repressing, activating or memory conditions. (B) ChIP against Ssn3-FRB-GFP from cells grown in repressing, activating or memory conditions. (A and B) *p<0.05, compared with the repressing condition (Student’s t-test). (C) ChIP against RNAPII from strains expressing Ssn3-FRB-GFP grown under either repressing or memory conditions, before or after treatment 1 µg/ml of rapamycin using primers to amplify the INO1 promoter (−348 to −260) or the PRM1 CDS. Inset: confocal micrographs of Ssn3-FRB-GFP expressing cells before or after treatment with 1 mg/ml of rapamycin for 30 min. *p<0.05, compared with t = 0 (Student’s t-test). (D and E) INO1 activation (D) or reactivation (E) in Ssn3-FRB-GFP cells. For activation at time = 0, cells were shifted from medium containing 100 μM inositol (repressing conditions; red arrow in schematic) to medium without inositol (activating conditions; green arrow in schematic). For reactivation, cells were shifted from activating medium to repressing medium containing 100 μM inositol for 3 hr. Cells were treated ±1 µg/ml rapamycin for 45 min before transferring to activating conditions. Cells were harvested at the indicated time points, and INO1 mRNA levels were quantified relative to ACT1 mRNA levels by RT-qPCR. The averages of three biological replicates are shown ± standard error of the mean. *p<0.05, compared with the same time point in the mock-treated culture (Student’s t-test). (F and G) ChIP against RNAPII (F) or Cdk8 (G) from HeLa cells before, during (24 hr) or 48 hr after treatment with 50 ng/mL Interferon-γ. Recovery of the indicated promoters or coding sequences (CDS) of genes that exhibit transcriptional memory (HLA-DRA, HLA-DPB1, HLA-DQB1 and OAS2) and a gene that does not (HIVEP2) was quantified relative to input by qPCR. *p<0.05, compared with the uninducing condition (Student’s t-test). (A-F) Averages of three biological replicates ± standard error of the mean. DOI: http://dx.doi.org/10.7554/eLife.16691.012
Figure 7.
Figure 7.. Salt-induced transcriptional memory leads to dimethylation of H3K4 and binding of poised RNAPII.
(A) mRNA levels of three genes that exhibit transcriptional memory (PGM2, PMT5 & YGP1) and one gene that does not (HSP31) at the indicated times after treatment with 0.5mM H2O2. Prior to treatment with H2O2, cells were grown either in rich media (no salt; red lines) or treated with 0.7M NaCl for 1 hr and then allowed to recover for 2 hr in rich media (after salt; blue lines). mRNA levels were quantified relative to ACT1 by RT-qPCR. Shown are the averages of three biological replicates ± standard error of the mean. *p<0.05, compared with the same time point in the no salt culture (Student’s t-test). (B) mRNA levels of three genes that exhibit transcriptional memory (PGM2, PMT5 & YGP1) and one gene that does not (HSP31) from set3∆ mutant cells at the indicated times after treatment with 0.5 mM H2O2 same data as in (A). (C and D) ChIP against RNAPII (C), H3K4me2 (D) from wild-type and set3∆ cells grown either in the absence of salt (no salt) or treated with 0.7M NaCl for 1 hr and allowed to recover for 2 hr in rich medium (after salt). (E) ChIP against Ssn3-FRB-GFP cells grown either in the absence of salt (no salt) or treated with 0.7M NaCl for 1 hr and allowed to recover for 2 hr in rich medium (after salt). All ChIP experiments are averages of three biological replicates ± standard error of the mean, quantified as in panel 1A, using primers to amplify the promoters of the indicated genes. *p<0.05, compared with the no salt condition (Student’s t-test). DOI: http://dx.doi.org/10.7554/eLife.16691.013
Figure 8.
Figure 8.. Models for transcriptional memory.
(A) Set1/COMPASS remodeling during INO1 transcriptional memory. Nucleosomes associated with repressed INO1 in the nucleoplasm are hypoacetylated and unmethylated. Active INO1 is targeted to the nuclear periphery, nucleosomes are acetylated (orange circles) and H3K4 is trimethylated (blue circles) by COMPASS. During memory, INO1 remains associated with the nuclear pore complex, acetylation is lost, H2A.Z is incorporated and H3K4 is dimethylated by a remodeled form of COMPASS lacking the Spp1 subunit (purple). H3K4me2 recruits Set3C, which promotes the persistence of H3K4me2 by feedback on COMPASS recruitment or remodeling. (B) Cdk8+ Mediator promotes transcriptional poising. Upon activation, Cdk8- Mediator and the PIC bind to the INO1 promoter. TFIIK (Kin28/Cdk7) phosphorylates Serine 5 on the carboxy terminal domain of RNAPII to initiate transcription. During memory, Kin28 is lost and Cdk8+ Mediator is recruited. Cdk8+ Mediator promotes PIC recruitment but initiation is blocked by the absence of Kin28, poising the promoter for future activation. DOI: http://dx.doi.org/10.7554/eLife.16691.014

Similar articles

Cited by

References

    1. Ahmed S, Brickner DG, Light WH, Cajigas I, McDonough M, Froyshteter AB, Volpe T, Brickner JH. DNA zip codes control an ancient mechanism for gene targeting to the nuclear periphery. Nature Cell Biology. 2010;12:111–118. doi: 10.1038/ncb2011. - DOI - PMC - PubMed
    1. Akoulitchev S, Chuikov S, Reinberg D. TFIIH is negatively regulated by cdk8-containing mediator complexes. Nature. 2000;407:102–106. doi: 10.1038/35024111. - DOI - PubMed
    1. Ardehali MB, Mei A, Zobeck KL, Caron M, Lis JT, Kusch T. Drosophila Set1 is the major histone H3 lysine 4 trimethyltransferase with role in transcription. The EMBO Journal. 2011;30:2817–2828. doi: 10.1038/emboj.2011.194. - DOI - PMC - PubMed
    1. Bancerek J, Poss ZC, Steinparzer I, Sedlyarov V, Pfaffenwimmer T, Mikulic I, Dölken L, Strobl B, Müller M, Taatjes DJ, Kovarik P. CDK8 kinase phosphorylates transcription factor STAT1 to selectively regulate the interferon response. Immunity. 2013;38:250–262. doi: 10.1016/j.immuni.2012.10.017. - DOI - PMC - PubMed
    1. Berry DB, Gasch AP. Stress-activated genomic expression changes serve a preparative role for impending stress in yeast. Molecular Biology of the Cell. 2008;19:4580–4587. doi: 10.1091/mbc.E07-07-0680. - DOI - PMC - PubMed

MeSH terms

Substances