

Blood and Intestine eQTLs from an Anti-TNF-Resistant Crohn's Disease Cohort Inform IBD Genetic Association Loci
- PMID: 27336838
- PMCID: PMC4931595
- DOI: 10.1038/ctg.2016.34
Blood and Intestine eQTLs from an Anti-TNF-Resistant Crohn's Disease Cohort Inform IBD Genetic Association Loci
Abstract
Objectives: Genome-wide association studies (GWAS) have identified loci reproducibly associated with inflammatory bowel disease (IBD) and other immune-mediated diseases; however, the molecular mechanisms underlying most of genetic susceptibility remain undefined. Expressional quantitative trait loci (eQTL) of disease-relevant tissue can be employed in order to elucidate the genes and pathways affected by disease-specific genetic variance.
Methods: In this study, we derived eQTLs for human whole blood and intestine tissues of anti-tumor necrosis factor-resistant Crohn's disease (CD) patients. We interpreted these eQTLs in the context of published IBD GWAS hits to inform on the disease process.
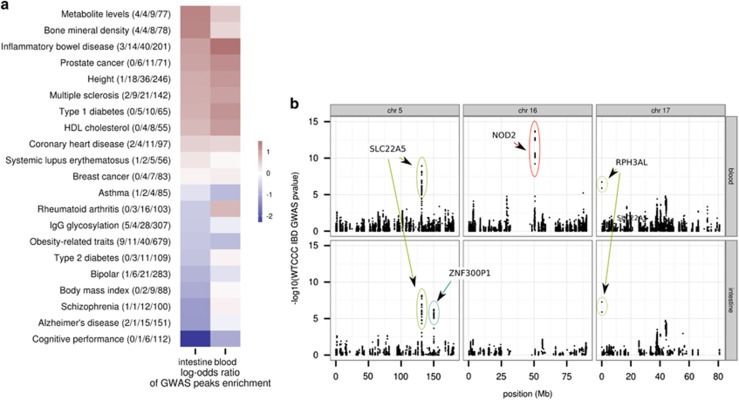
Results: At 10% false discovery rate, we discovered that 5,174 genes in blood and 2,063 genes in the intestine were controlled by a nearby single-nucleotide polymorphism (SNP) (i.e., cis-eQTL), among which 1,360 were shared between the two tissues. A large fraction of the identified eQTLs were supported by the regulomeDB database, showing that the eQTLs reside in regulatory elements (odds ratio; OR=3.44 and 3.24 for blood and intestine eQTLs, respectively) as opposed to protein-coding regions. Published IBD GWAS hits as a whole were enriched for blood and intestine eQTLs (OR=2.88 and 2.05; and P value=2.51E-9 and 0.013, respectively), thereby linking genetic susceptibility to control of gene expression in these tissues. Through a systematic search, we used eQTL data to inform 109 out of 372 IBD GWAS SNPs documented in National Human Genome Research Institute catalog, and we categorized the genes influenced by eQTLs according to their functions. Many of these genes have experimentally validated roles in specific cell types contributing to intestinal inflammation.
Conclusions: The blood and intestine eQTLs described in this study represent a powerful tool to link GWAS loci to a regulatory function and thus elucidate the mechanisms underlying the genetic loci associated with IBD and related conditions. Overall, our eQTL discovery approach empirically identifies the disease-associated variants including their impact on the direction and extent of expression changes in the context of disease-relevant cellular pathways in order to infer the functional outcome of this aspect of genetic susceptibility.
Figures


References
-
- Guo C, D'Ippolito AM, Reddy TE. From prescription to transcription: genome sequence as drug target. Cell 2015; 162: 16–17. - PubMed
-
- Mathews RJ, Robinson JI, Battellino M et al. Evidence of NLRP3-inflammasome activation in rheumatoid arthritis (RA); genetic variants within the NLRP3-inflammasome complex in relation to susceptibility to RA and response to anti-TNF treatment. Ann Rheum Dis 2014; 73: 1202–1210. - PubMed
-
- Krausgruber T, Saliba D, Ryzhakov G et al. IRF5 is required for late-phase TNF secretion by human dendritic cells. Blood 2010; 115: 4421–4430. - PubMed
-
- Neurath MF. Cytokines in inflammatory bowel disease. Nat Rev Immunol 2014; 14: 329–342. - PubMed
LinkOut - more resources
Full Text Sources
Other Literature Sources
