. 2016 Jun 23;11(6):e0157813.
doi: 10.1371/journal.pone.0157813. eCollection 2016.

Nanoparticles Effectively Target Rapamycin Delivery to Sites of Experimental Aortic Aneurysm in Rats

Affiliations

Nanoparticles Effectively Target Rapamycin Delivery to Sites of Experimental Aortic Aneurysm in Rats

Takuro Shirasu et al. PLoS One. .

Abstract

Several drugs targeting the pathogenesis of aortic aneurysm have shown efficacy in model systems but not in clinical trials, potentially owing to the lack of targeted drug delivery. Here, we designed a novel drug delivery system using nanoparticles to target the disrupted aortic aneurysm micro-structure. We generated poly(ethylene glycol)-shelled nanoparticles incorporating rapamycin that exhibited uniform diameter and long-term stability. When injected intravenously into a rat model in which abdominal aortic aneurysm (AAA) had been induced by infusing elastase, labeled rapamycin nanoparticles specifically accumulated in the AAA. Microscopic analysis revealed that rapamycin nanoparticles were mainly distributed in the media and adventitia where the wall structures were damaged. Co-localization of rapamycin nanoparticles with macrophages was also noted. Rapamycin nanoparticles injected during the process of AAA formation evinced significant suppression of AAA formation and mural inflammation at 7 days after elastase infusion, as compared with rapamycin treatment alone. Correspondingly, the activities of matrix metalloproteinases and the expression of inflammatory cytokines were significantly suppressed by rapamycin nanoparticle treatment. Our findings suggest that the nanoparticle-based delivery system achieves specific delivery of rapamycin to the rat AAA and might contribute to establishing a drug therapy approach targeting aortic aneurysm.


Conflict of interest statement

Competing Interests: The authors have declared that no competing interests exist.

Figures

Fig 1
Fig 1. Structure and properties of rapamycin-incorporated nanoparticles.
(A) Illustration showing that rapamycin-incorporated nanoparticles (rapamycin nanoparticles) are synthesized by mixing an equal mass of rapamycin and poly(ethylene glycol)-b-poly(γ-benzyl L-glutamate) (PEG-b-PBLG). Rapamycin is incorporated into the core of the PEG-shelled nanoparticle. (B) The diameter of nanoparticles measured by a Zetasizer. The size of the nanoparticles formed solely with PEG-b-PBLG was 42 nm (dotted line), whereas that of the rapamycin nanoparticles was 106 nm (solid line). (C) Time-course of the scattered light intensity of rapamycin nanoparticles under physiological conditions. Rapamycin nanoparticles are stable over the first 2 days. Data represent the means ± standard deviation (s.d.).
Fig 2
Fig 2. Flow-charts of the studies to analyze distribution and therapeutic effect of rapamycin nanoparticles.
(A) Flow-chart of the study on the distribution of rapamycin nanoparticles to abdominal aortic aneurysm (AAA). (B) Flow-chart of the study on the therapeutic effect of rapamycin nanoparticles to suppress the formation of AAA.
Fig 3
Fig 3. Accumulation of Alexa647-labeled rapamycin nanoparticles in the AAA rat model.
(A) Representative images of macroscopic distribution of Alexa647 in the aorto-iliac specimens as imaged using the IVIS® imaging system. Abundant signals of Alexa647 were specifically distributed in the AAA at 4, 8, 16, and 24 hours after injection of Alexa647-labeled rapamycin nanoparticles (red-staining, at 1, 4, 8, and 24 hours, n = 4; at 16 hours, n = 3). (B) The plasma clearance of rapamycin nanoparticles in the rat model. The residual ratio of rapamycin nanoparticles in the plasma was high at 1 hour after injection. (C) Fluorescence intensities of the lysates of AAA and the thoracic aorta are shown as adjusted absorbance values. The values of AAA were significantly higher than those of the thoracic aorta at 8, 16, and 24 hours after injection. Data represent the means ± s.d. N.C. indicates negative control. *p < 0.05, †p < 0.01 (unpaired Student’s t-test).
Fig 4
Fig 4. Microscopic distribution of Alexa647-labeled rapamycin nanoparticles in the rat AAA.
(A) Confocal laser scanning micrograph of the rat AAA 7-days post induction and 24 hours after injection of the Alexa647-labeled rapamycin nanoparticles. Note the abundant accumulation of Alexa647-labeled rapamycin nanoparticles (red dots) distributed in the media and adventitia with progressive destruction of the wall structure. Nuclei are stained by Hoechst33342 (blue dots), and elastic laminae of the media are visualized by intrinsic fluorescence (green). L indicates the lumen, scale bar = 500 μm. (B) Micrograph of the cross sections stained for CD68 (green). Co-localization with Alexa647-labelled rapamycin nanoparticles (red dots) appears as a yellow color. The majority of nanoparticle dots were co-localized with CD68-positive cells (S1A Fig). Scale bar = 10 μm. (C) Micrograph of the cross sections stained for αSMA (green). There is little co-localization with Alexa647-labeled rapamycin nanoparticles (red dots, S1B Fig). Scale bar = 10 μm.
Fig 5
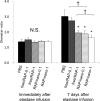
Fig 5. Therapeutic efficacy of rapamycin nanoparticles in the AAA rat model.
The diameter of the abdominal aorta in the rat AAA model was measured before, immediately after, and 7 days after elastase infusion. The diameter ratio is expressed for each rat as the ratio of the diameter after elastase infusion to the diameter before elastase infusion. During the process of AAA formation, the rats received intravenous injections of following suspension or solvent (n = 6/group); i) phosphate buffered saline (PBS), ii) 0.1 mg/kg free rapamycin (free/RAP-0.1), iii) 1 mg/kg free rapamycin (free/RAP-1), iv) 0.1 mg/kg rapamycin nanoparticles (RAP/nano-0.1), or v) 1 mg/kg rapamycin nanoparticles (RAP/nano-1). RAP/nano-0.1 and RAP/nano-1 enhanced the inhibitory effect on AAA enlargement compared with free/RAP-0.1 and free/RAP-1, respectively. Data represent the means ± s.d. N.S. indicates no significant difference, *p < 0.05 (Dunnett’s test), †p < 0.01 (unpaired Student’s t-test).
Fig 6
Fig 6. Histopathological findings of AAAs after treatment with rapamycin nanoparticles.
Low power field images (A-E, scale bar = 500 μm) and high power field images (F-O, scale bar = 100 μm) of the rat AAA at 7 days after elastase infusion. The sections were stained by hematoxylin-eosin (A-J) or via the Elastica van Gieson method (K-O). During the process of AAA development, the rats received intravenous injections of PBS (A,F,K), free/RAP-0.1 (B,G,L), free/RAP-1 (C,H,M), RAP/nano-1 (D,I,N), or RAP/nano-1 (E,J,O). The size of the AAA after injections of RAP/nano-0.1 (D) and RAP/nano-1 (E) are smaller than those after the other injections (A–C). Considerable numbers of inflammatory cells are observed in the AAA after injections of PBS (F), free/RAP-0.1 (G), and free/RAP-1 (H), with concomitant destruction of the medial elastic laminae (K–M). L indicates the lumen.
Fig 7
Fig 7. Immunohistological findings of AAA after treatment by rapamycin nanoparticles.
(A–E) Micrographs of the rat AAA at 7 days after elastase infusion; the sections were immunostained for CD68 (brown). Abundant infiltrations of CD68-positive cells are observed in the AAA after injections of PBS (A), free/RAP-0.1 (B) and free/RAP-1 (C), whereas scarce after injections of RAP/nano-0.1 (D) and RAP/nano-1 (E). To quantify the density of CD68-positive cells in AAA wall, CD68-positive cell density of each section was calculated (F). Black dots represent the specific values in each group. Long and short bars represent mean and standard deviation, respectively. *p < .05. (G–K) Micrographs of AAA at 7 days after elastase infusion; the sections were stained for α-smooth muscle actin (αSMA, brown). The density of αSMA-positive cells in the media markedly decreased in the AAA after injections of PBS (G), free/RAP-0.1 (H), and free/RAP-1 (I), while that was preserved in the AAA after injections of RAP/nano-0.1 (J) and RAP/nano-1 (K). Scale bar = 50 μm. *p < 0.05 (Dunnett’s test).
Fig 8
Fig 8. Gelatinase activities and expression of inflammation-related factors in AAA homogenates after treatment of rapamycin nanoparticles.
(A) Gelatin zymography of AAA lysates. The rats were subjected to elastase infusion, and 7 days later, AAA samples were collected. During the process of AAA formation, the rats received intravenous injections of PBS (n = 3), free/RAP-1 (n = 3), or RAP/nano-1 (n = 3). Gelatinase activities at 64, 72, and 92 kD represent matrix metalloproteinase-2 (MMP-2), latent form MMP-2 (pro-MMP-2), and latent form MMP-9 (pro-MMP-9), respectively. The MMP marker containing MMP-2, pro-MMP-2, and pro-MMP-9 was applied in the most right lane (M). (B–D) Gelatinase activities of MMP-9 (B), pro-MMP-2 (C), and pro-MMP-2 (D) were quantified by densitometry. In the expressions of pro-MMP-2 and MMP-2, the values after injections of RAP/nano-1 were significantly reduced as compared with those after injections of PBS and free/RAP-1. Contrarily, no differences were detected in the activities of pro-MMP-9 between the 3 treatments. Profiler array analyses of AAA at 7 days after elastase infusion revealed significant findings in expressions of interleukin (IL)-1α (E), IL-1β (F), and cytokine-induced neutrophil chemoattractant (CINC)-1 (G). The expression of IL-1α, IL-1β, and CINC-1 were significantly suppressed in the AAA after injections of RAP/nano-1 as compared with those after injections of PBS and free/RAP-1 (n = 3 for each). The experiments were repeated 3 times. In panels B–G, black dots represent the specific values in each group. Long and short bars represent mean and standard deviation, respectively. Error bars denote s.d. *p < 0.05, †p < 0.01 (unpaired Student’s t-test).

Similar articles

Cited by

References

    1. Singh K, Bønaa KH, Jacobsen BK, Bjørk L, Solberg S. Prevalence of and risk factors for abdominal aortic aneurysms in a population-based study: The Tromsø Study. Am J Epidemiol. 2001;154(3):236–244. - PubMed
    1. Brewster DC, Cronenwett JL, Hallett JW Jr, Johnston KW, Krupski WC, Matsumura JS, et al. Guidelines for the treatment of abdominal aortic aneurysms. Report of a subcommittee of the Joint Council of the American Association for Vascular Surgery and Society for Vascular Surgery. J Vasc Surg. 2003;37(5):1106–1117. - PubMed
    1. 2011 Writing Group Members, 2005 Writing Committee Members, ACCF/AHA Task Force Members. 2011 ACCF/AHA Focused Update of the Guideline for the Management of patients with peripheral artery disease (Updating the 2005 Guideline): a report of the American College of Cardiology Foundation/American Heart Association Task Force on practice guidelines. Circulation. 2011;124(18):2020–2045. 10.1161/CIR.0b013e31822e80c3 - DOI - PubMed
    1. Thompson RW, Geraghty PJ, Lee JK. Abdominal aortic aneurysms: basic mechanisms and clinical implications. Curr Probl Surg. 2002;39(2):110–230. - PubMed
    1. Baxter BT, Terrin MC, Dalman RL. Medical management of small abdominal aortic aneurysms. Circulation. 2008;117(14):1883–1889. 10.1161/CIRCULATIONAHA.107.735274 - DOI - PMC - PubMed