. 2016 Jun 23:7:11653.
doi: 10.1038/ncomms11653.

MAIT cells are activated during human viral infections

Collaborators, Affiliations

MAIT cells are activated during human viral infections

Bonnie van Wilgenburg et al. Nat Commun. .

Abstract

Mucosal-associated invariant T (MAIT) cells are abundant in humans and recognize bacterial ligands. Here, we demonstrate that MAIT cells are also activated during human viral infections in vivo. MAIT cells activation was observed during infection with dengue virus, hepatitis C virus and influenza virus. This activation-driving cytokine release and Granzyme B upregulation-is TCR-independent but dependent on IL-18 in synergy with IL-12, IL-15 and/or interferon-α/β. IL-18 levels and MAIT cell activation correlate with disease severity in acute dengue infection. Furthermore, HCV treatment with interferon-α leads to specific MAIT cell activation in vivo in parallel with an enhanced therapeutic response. Moreover, TCR-independent activation of MAIT cells leads to a reduction of HCV replication in vitro mediated by IFN-γ. Together these data demonstrate MAIT cells are activated following viral infections, and suggest a potential role in both host defence and immunopathology.


Figures
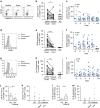
Figure 1
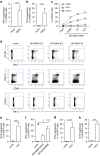
Figure 1. MAIT cell activation during acute viral infections in vivo.
PBMC's from healthy controls (HC, n=5–10), patients suffering from severe dengue (DHF, n=2–10), dengue (DF, n=4–10) or acute, hospitalized patients infected with influenza A virus (n=7–9) were analysed by flow cytometry by gating on live CD3+CD8+CD161++Vα7.2+ (MAIT) cells. (a,d,g) Representative flow cytometry plots. (b,e,h) Comparison between acute (day 0) and convalescent phase (day >10) of infection. (c,f,i) Comparison between DHF and DF patients. (jm) Acute, hospitalized patients infected with influenza virus. (b,c,j,k) MAIT cell frequency as a proportion of the CD8+ T cell population. (e,f) Percentage of CD38 expression by MAIT cells. (h,i,l,m) Percentage of Granzyme B expression by MAIT cells. Statistical significance was determined with a Wilcoxon matched-paired test (b,e,h) or Mann–Whitney test (j,k). Bars represent means±s.e.m. ns>0.05, *P 0.05, **P≤0.01, ***P≤0.001, ****P≤0.0001. conv, convalescent; Gr B, Granzyme B; HC, healthy control; ICU, intensive care unit.
Figure 2
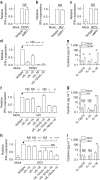
Figure 2. MAIT cell activation during chronic viral infection in vivo.
PBMC's from healthy controls (n=20–23) or patients (n=12–25) with persistent (treatment naive, REL, NR) and resolved HCV infection (SVR, SC) were analysed by flow cytometry by gating on live CD3+CD8+CD161++Vα7.2+ (MAIT) cells. (a) MAIT cell frequency as a proportion of the CD8+ T cells. (b,c) Granzyme B expression by MAIT cells. (b) Representative flow cytometry plots. Bars represent means±s.e.m. Statistical significance was determined with the Kruskal–Wallis test followed by the Dunns' test. ns>0.05, *P 0.05, **P≤0.01, ***P≤0.001, ****P≤0.0001. HC, healthy control; Gr B, Granzyme B; REL/NR, relapse/non-response; SC, spontaneous clearance; SVR, sustained virological response; tr., treatment.
Figure 3
Figure 3. Viral MAIT cell activation in vitro.
MAIT cells from healthy individuals were analysed by flow cytometry, gated on live CD3+CD161++Vα7.2+ cells. (a,b) PBMC's (n=7) were co-cultured with autologous monocyte-derived DC's exposed to DENV (MOI=1) as described in ‘Methods'. (ce) CD8+ T cells isolated from PBMC's (n=11–12) were co-cultured with IAV-exposed macrophages (MOI=1) as described in ‘Methods', unless indicated otherwise. (f) CD8+ T cells isolated from PBMC's (n=11–12) were co-cultured with macrophages exposed to the clinical H3N2 influenza A strain (A/England/691/2010 (n=7)) or influenza B (B/Florida/04/2006 (n=8)) (MOI=1) as described in ‘Methods'. (g,h) CD8+ T cells isolated from PBMC's (n=7–12) co-cultured with macrophages exposed to HCV (MOI=1) as described in ‘Methods'. Proportion of MAIT cells producing IFN-γ (a,c,d,f,g), TNF-α (c,d), CD69 (c,d) or Granzyme B (b,e,h). (d) Representative flow cytometry plots. All data are representative from at least two independent experiments. Bars represent means±s.e.m. Statistical significance was determined with the Kruskal–Wallis test followed by the Dunns' test (f) or the Mann–Whitney test (a,b,e,g,h). ns>0.05, *P 0.05, ***P≤0.001, ****P≤0.0001. Eng, England; Flor, Florida; HC, healthy control; Gr B, Granzyme B; MΦ, macrophage; REL/NR, relapse/non-response; SC, spontaneous clearance; SVR, sustained virological response; tr., treatment.
Figure 4
Figure 4. Viral MAIT cell activation is dependent on cytokines.
(ad,f,h) Isotype control, anti-MR1, anti-IL-12, anti-IL-15 and/or anti-IL-18 antibodies were added to a co-culture exposed to DENV (a,d, n=3–6), IAV (b,f, n=5–29) or HCV (c,h, n=7–16). IFN-γ expression by MAIT cells (gated on live CD3+CD8+CD161++Vα7.2+ cells) was analysed by flow cytometry and is shown relative to the isotype control. (e,g,i) IL-12p70, IL-15 and IL-18 levels secreted by virus-exposed APC's. (e) DENV-exposed DC's (n=4) at 42 h. (g) IAV-exposed macrophages (n=7) at 48 h. (i) HCV-exposed macrophages (n=7) at 48 h. Data are representative from at least two independent experiments. Bars represent means±s.e.m. Statistical significance was determined with the Mann–Whitney test (ac,e,g,i) or the Kruskal–Wallis test followed by the Dunns' test or the Mann–Whitney test (d,f,h). ns>0.05, *P 0.05, ***P≤0.001, ****P≤0.0001. ND, not detected.
Figure 5
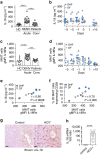
Figure 5. Virally triggered IL-18 correlates with MAIT cell activation.
(ad) PBMC's from healthy controls (n=10) or patients suffering from severe dengue (DHF, n=2–12) or dengue (DF, n=4–12) were analysed. (a,b) Plasma levels of IL-18. (c,d) IL-18Ra expression on MAIT cells. (a,c) Comparison between acute (day 0) and convalescent (conv) phase (day >10) of infection. (b,d) Comparison between DHF and DF patients. Correlation of plasma levels of IL-18 (e) or MAIT cell CD38 expression (f) against MAIT cell IL-18Ra expression by the Spearman-rank correlation test. (g) Paraffin-embedded human liver tissues sections from HCV or control patients were stained for IL-18 (brown-coloured). Scale bar, 10 mm. (h) IL-18 mRNA expression in liver biopsies from HCV patients (n=55) relative to uninfected control liver samples is shown (n=6). Bars represent means±s.e.m. Statistical significance was determined with the Mann–Whitney test (b,d,h) or the Wilcoxon matched-paired test (a,c). ns>0.05, *P 0.05, ***P≤0.001, ****P≤0.0001. conv, convalescent; HC, healthy control.
Figure 6
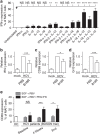
Figure 6. MAIT cells respond to type I interferons in vitro and in vivo.
(a) PBMC's from healthy individuals were directly stimulated for 24 h with IFN-α, IFN-β, IL-12, IL-15, IL-18 or indicated combinations thereof. IFN-γ expression by MAIT cells (gated on live CD3+CD8+CD161++Vα7.2+ cells) was analysed by flow cytometry. (bd) B18R (IFN-α/β neutralizing protein) or PBS control were added to the co-culture (n=6–11). IFN-γ (b), CD69 (c) and Granzyme B (d) expression is shown relative to the control. Data are representative from at least two independent experiments. (e) PBMC's from healthy controls or HCV patients at baseline, during or end of treatment with either SOF+RBV or SOF+RBV/PEG-IFN were analysed by flow cytometry. CD69 expression on MAIT cells (gated on live CD3+CD8+CD161++Vα7.2+ cells) was measured. Bars represent means±s.e.m. Statistical significance was determined with the Kruskal–Wallis test followed by the Dunns' test (a) or the Mann–Whitney test (be). ns>0.05, *P 0.05, ***P≤0.001, ****P≤0.0001. HC, healthy controls.
Figure 7
Figure 7. Activated MAIT cells can limit HCV replication.
Sorted MAIT cells (CD8+CD161++Vα7.2+) were rested or activated in a TCR-independent manner (IL-12+IL-18 stimulation, MAIT+) for 24 h. (a) IFN-γ expression by MAIT cells (gated on live CD3+CD8+CD161++Vα7.2+ cells) was analysed by flow cytometry. (b,c) Neat or diluted supernatants were transferred to hepatocyte lines infected with HCV expressing luciferase and viral replication measured 4 days post infection. (d) Supernatants were transferred to hepatocyte lines infected with HCV expressing luciferase repeated in the presence of an isotype control or anti-IFN-γ antibody. Data are representative from at least two independent experiments. Bars represent means±s.e.m. Statistical significance was determined with a Wilcoxon matched-paired test (c) or the Mann–Whitney test (d). **P≤0.01. −, unstimulated; luc, luciferase; RLU, relative light units; sup, supernatant.

Similar articles

Cited by

References

    1. Porcelli S., Yockey C. E., Brenner M. B. & Balk S. P. Analysis of T cell antigen receptor (TCR) expression by human peripheral blood CD4-8- alpha/beta T cells demonstrates preferential use of several V beta genes and an invariant TCR alpha chain. J. Exp. Med. 178, 1–16 (1993). - PMC - PubMed
    1. Tilloy F. et al.. An invariant T cell receptor alpha chain defines a novel TAP-independent major histocompatibility complex class Ib-restricted alpha/beta T cell subpopulation in mammals. J. Exp. Med. 189, 1907–1921 (1999). - PMC - PubMed
    1. Dusseaux M. et al.. Human MAIT cells are xenobiotic-resistant, tissue-targeted, CD161hi IL-17-secreting T cells. Blood 117, 1250–1259 (2011). - PubMed
    1. Treiner E. et al.. Selection of evolutionarily conserved mucosal-associated invariant T cells by MR1. Nature 422, 164–169 (2003). - PubMed
    1. Tang X.-Z. et al.. IL-7 licenses activation of human liver intrasinusoidal mucosal-associated invariant T cells. J. Immunol. 190, 3142–3152 (2013). - PubMed

Publication types