. 2016 Aug 2;12(8):1390-403.
doi: 10.1080/15548627.2016.1184799. Epub 2016 Jun 23.

Autophagy deficiency in myeloid cells increases susceptibility to obesity-induced diabetes and experimental colitis

Affiliations

Autophagy deficiency in myeloid cells increases susceptibility to obesity-induced diabetes and experimental colitis

Hae-Youn Lee et al. Autophagy. .

Abstract

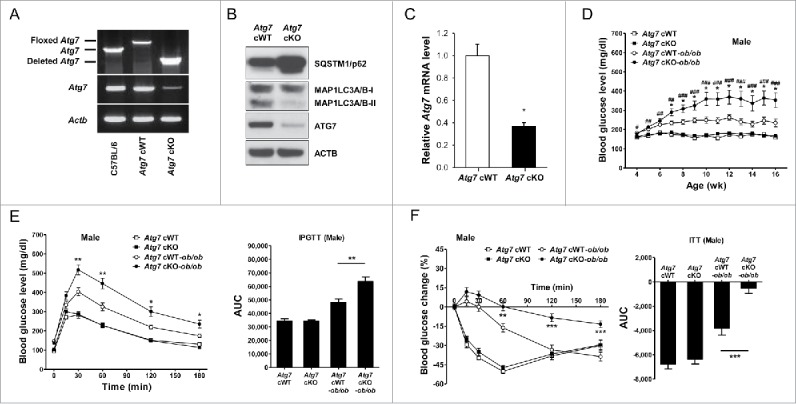
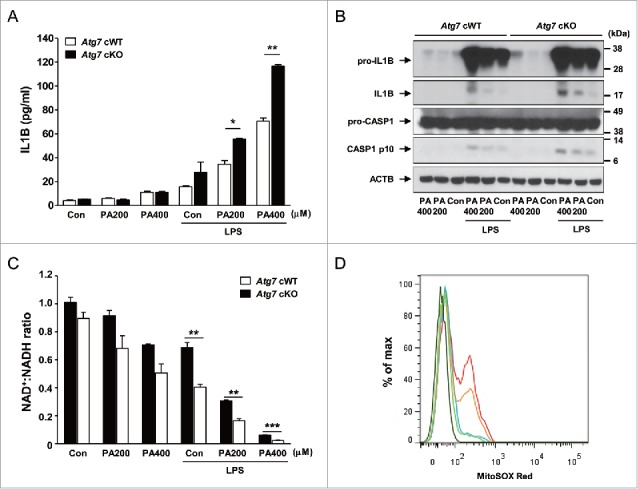
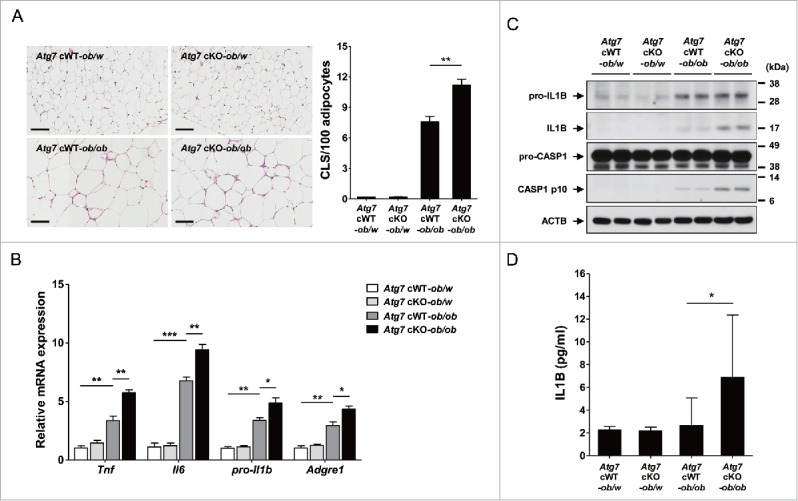
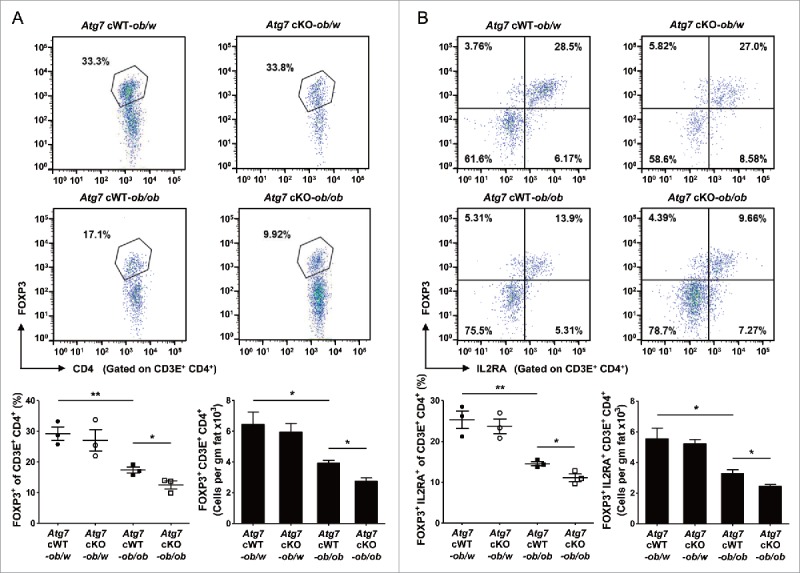
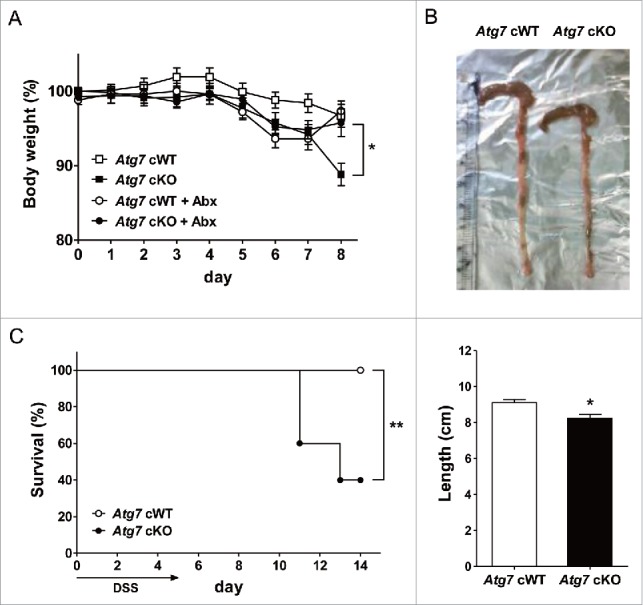
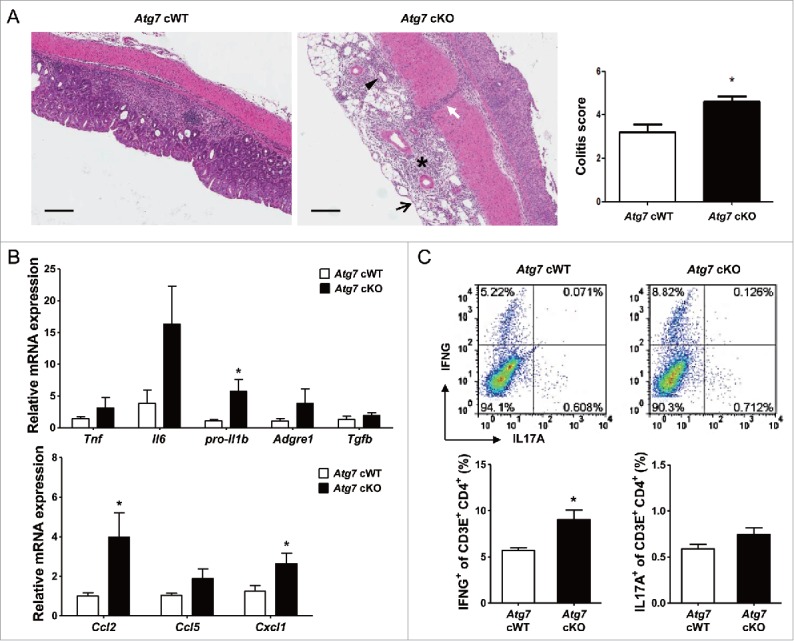
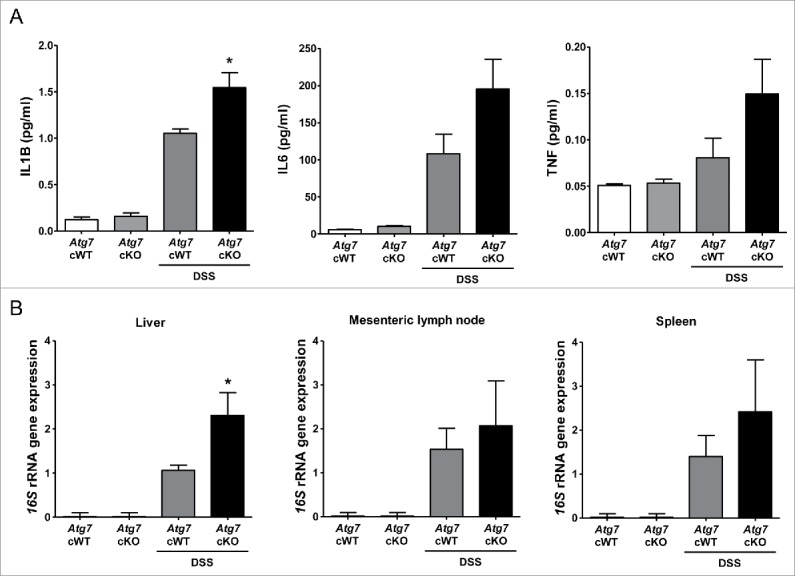
Autophagy, which is critical for the proper turnover of organelles such as endoplasmic reticulum and mitochondria, affects diverse aspects of metabolism, and its dysregulation has been incriminated in various metabolic disorders. However, the role of autophagy of myeloid cells in adipose tissue inflammation and type 2 diabetes has not been addressed. We produced mice with myeloid cell-specific deletion of Atg7 (autophagy-related 7), an essential autophagy gene (Atg7 conditional knockout [cKO] mice). While Atg7 cKO mice were metabolically indistinguishable from control mice, they developed diabetes when bred to ob/w mice (Atg7 cKO-ob/ob mice), accompanied by increases in the crown-like structure, inflammatory cytokine expression and inflammasome activation in adipose tissue. Mφs (macrophages) from Atg7 cKO mice showed significantly higher interleukin 1 β release and inflammasome activation in response to a palmitic acid plus lipopolysaccharide combination. Moreover, a decrease in the NAD(+):NADH ratio and increase in intracellular ROS content after treatment with palmitic acid in combination with lipopolysaccharide were more pronounced in Mφs from Atg7 cKO mice, suggesting that mitochondrial dysfunction in autophagy-deficient Mφs leads to an increase in lipid-induced inflammasome and metabolic deterioration in Atg7 cKO-ob/ob mice. Atg7 cKO mice were more susceptible to experimental colitis, accompanied by increased colonic cytokine expression, T helper 1 skewing and systemic bacterial invasion. These results suggest that autophagy of Mφs is important for the control of inflammasome activation in response to metabolic or extrinsic stress, and autophagy deficiency in Mφs may contribute to the progression of metabolic syndrome associated with lipid injury and colitis.

Keywords: autophagy; colitis; diabetes; inflammasome; macrophages; obesity.


Figures

Figure 1.
Figure 1.
Metabolic profile of male Atg7 cKO mice. (A) PCR using DNA from peritoneal Mϕs and primers specific for Atg7. (B) Peritoneal Mϕs were cultured in serum-free conditions for 6 h to induce autophagy, and cell extracts were subjected to western blot analysis. (C) Quantitative RT-PCR was done using mRNA from Mϕs and specific primers. (D) Nonfasting blood glucose level was determined in male Atg7 cKO, Atg7 cKO-ob/ob and respective control mice (n = 10 to 15). (E) IPGTT was conducted in overnight-fasted 16-wk-old male mice as described in Materials and Methods, and AUC calculated (n = 5 to 8). (F) ITT was conducted in fasted 16-wk-old male mice as described in the Materials and Methods, and AUC calculated (n = 5 to 10). *, P < 0.05; **, P < 0.01; ***, P < 0.001.
Figure 2.
Figure 2.
Inflammasome activation in Mϕs from 12-wk-old mice by varying doses of PA in combination with 500 ng/ml LPS. (A) Primary peritoneal Mϕs were incubated with PA of the indicated concentrations and LPS. After 24 h of culture, IL1B concentration in the supernatant was determined by ELISA. (B) After incubation of primary peritoneal Mϕs with PA of the indicated doses and LPS for 24 h, cell extracts were subjected to western blot analysis using anti-IL1B and -CASP1 Abs. (C) After the same incubation of Mϕs as in (B), NAD+:NADH ratio was determined using a commercial kit. (D) After the same incubation of Mϕs as in (B), cells were incubated with MitoSOX Red for flow cytometry (dark green, unstained; green, Atg7 cWT Mϕs treated with 400 μM PA; blue, Atg7 cWT Mϕs treated with LPS; orange, Atg7 cWT Mϕs treated with 400 μM PA + LPS; red, Atg7 cKO Mϕs treated with 400 μM PA + LPS). *, P < 0.05; **, P < 0.01; ***, P < 0.001.
Figure 3.
Figure 3.
Inflammasome activation in vivo. (A) The number of CLS in white adipose tissue of 20-wk-old mice was counted as described in Materials and Methods (n = 4 each) (right). Representative H&E stained sections of white adipose tissue are shown (left, scale bar: 100 μm). (B) Total mRNA was extracted from the SVF of white adipose tissue from 20-wk-old mice, and quantitative RT-PCR was done using primers specific for Tnf, Il6, pro-Il1b and Adgre1 (n = 3 each). (C) Tissue lysate of the SVF was subjected to western blot analysis using anti-IL1B and -CASP1 Abs. (D) Serum IL1B level was determined using a commercial ELISA kit (n = 3 to 15). *, P < 0.05; **, P < 0.01; ***, P < 0.001.
Figure 4.
Figure 4.
Treg cells in white adipose tissue. (A) Cells in the SVF of white adipose tissue from 20-wk-old mice were incubated with a mixture of anti-CD3E, -CD4, and -IL2RA Abs, and then with -FOXP3 Ab as described in Materials and Methods. FOXP3 and CD4 expression was examined by flow cytometry gated on CD3E+ CD4+ cells. The proportions of FOXP3+ cells among CD3E+ CD4+ cells (lower left) and the numbers of FOXP3+ CD3E+ CD4+ cells/gm adipose tissue (lower right) (n = 3 each). Representative FACS scattergrams are shown (upper). (B) Cells were incubated with Abs as in (A), and FOXP3 and IL2RA expression was examined by flow cytometry gated on CD3E+ CD4+ cells. The proportions of FOXP3+ IL2RA+ cells among CD3E+ CD4+ cells (lower left) and the numbers of FOXP3+ IL2RA+ CD3E+ CD4+ cells/gm adipose tissue (lower right) (n = 3 each). Representative FACS scattergrams are shown (upper). *, P < 0.05; **, P < 0.01.
Figure 5.
Figure 5.
DSS-induced colitis in Atg7 cKO mice. (A) Body weight was monitored during and after oral administration of 2.5% DSS for 5 d (n = 7 each). The antibiotic mixture (Abx) was administered since 2 d before DSS as described in Materials and Methods, and body weight monitored (n = 7 each). (B) Gross morphology (upper) and length (lower) of the colons on day 7 of DSS administration (n = 5 to 6). (C) Survival after administration of 4% DSS was monitored as described in Materials and Methods (n = 10 each). *, P < 0.05; **, P < 0.01.
Figure 6.
Figure 6.
Inflammation and Th1 skewing in the colon of Atg7 cKO mice. (A) Colitis score was calculated on d 7 of DSS treatment as described in Materials and Methods (n = 5 each) (right). Representative H&E sections are shown (left, scale bar: 200 μm) (asterisk, inflammation; arrow, ulceration; arrow head, regeneration; white arrow, transmural lesion). (B) Relative expression of cytokines and chemokines in the colonic tissues on d 7 of DSS treatment assessed by quantitative RT-PCR analysis of mRNA prepared using a formalin-fixed paraffin-embedded extraction kit (n = 8 to 10). (C) Th skewing in the colonic lamina propria on day 7 of DSS treatment was evaluated by flow cytometry. The proportions of IFNG+ cells and IL17A+ cells among CD3E+ CD4+ T cells (lower) (n = 4 each). Representative scattergrams are shown (upper). *, P < 0.05.
Figure 7.
Figure 7.
Systemic inflammation and bacterial invasion after DSS treatment. (A) Serum levels of cytokines after DSS treatment were determined by ELISA (n = 6 each). (B) Relative expression of bacterial 16S rRNA genes in the liver, mesenteric lymph node and spleen determined by quantitative PCR as described in Materials and Methods (n = 9 each). *, P < 0.05.

Similar articles

Cited by

References

    1. Mizushima N, Komatsu M. Autophagy: renovation of cells and tissues. Cell 2011; 147:728-41; PMID:22078875; http://dx.doi.org/10.1016/j.cell.2011.10.026 - DOI - PubMed
    1. Ozcan U, Cao Q, Yilmaz E, Lee A-H, Iwakoshi NN, Ozdelen E, Tuncman G, Gorgun C, Glimcher LH, Hotamisligil GS. Endoplasmic reticulum stress links obesity, insulin action, and type 2 Diabetes. Science 2004; 306:457-61; PMID:15486293; http://dx.doi.org/10.1126/science.1103160 - DOI - PubMed
    1. Petersen KF, Befroy D, Dufour S, Dziura J, Ariyan C, Rothman DL, DiPietro L, Cline GW, Shulman GI. Mitochondrial dysfunction in the elderly: possible role in insulin resistance. Science 2003; 300:1140-2; PMID:12750520; http://dx.doi.org/10.1126/science.1082889 - DOI - PMC - PubMed
    1. Quan W, Hur KY, Lim Y, Oh SH, Lee J-C, Kim HC, Kim G-H, Kim S-H, Kim HL, Lee M-K, et al.. Autophagy deficiency in beta cells leads to compromised unfolded protein response and progression from obesity to diabetes in mice. Diabetologia 2012; 55:392-403; PMID:22075916; http://dx.doi.org/10.1007/s00125-011-2350-y - DOI - PubMed
    1. Kim KH, Lee M-S. Autophagy-a key player in cellular and body metabolism. Nat Rev Endocrinol 2014; 10:322-37; PMID:24663220; http://dx.doi.org/10.1038/nrendo.2014.35 - DOI - PubMed

Publication types

MeSH terms