. 2017 Mar;58(3):676-688.
doi: 10.1080/10428194.2016.1198958. Epub 2016 Jun 24.

Cyclin D1 depletion induces DNA damage in mantle cell lymphoma lines

Affiliations

Cyclin D1 depletion induces DNA damage in mantle cell lymphoma lines

Suchismita Mohanty et al. Leuk Lymphoma. 2017 Mar.

Abstract

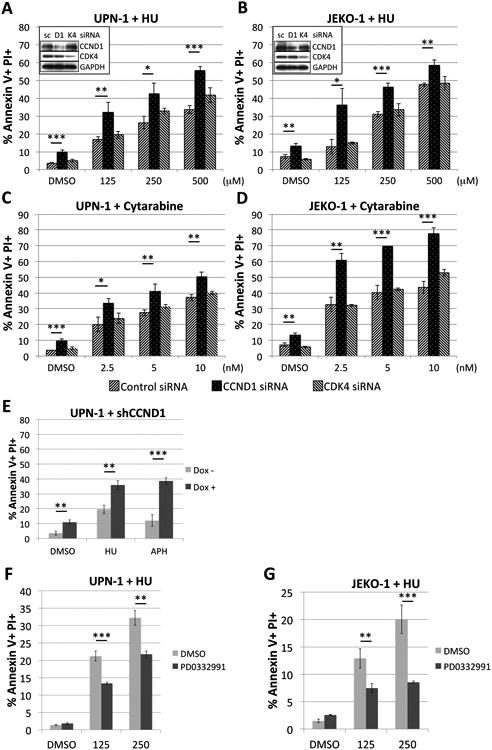
Elevated cyclin D1 (CCND1) expression levels in mantle cell lymphoma (MCL) are associated with aggressive clinical manifestations related to chemoresistance, but little is known about how this important proto-oncogene contributes to the resistance of MCL. Here, we showed that RNA interference-mediated depletion of CCND1 increased caspase-3 activities and induced apoptosis in the human MCL lines UPN-1 and JEKO-1. In vitro and xenotransplant studies revealed that the toxic effect of CCND1 depletion in MCL cells was likely due to increase in histone H2AX phosphorylation, a DNA damage marker. DNA fiber analysis suggested deregulated replication initiation after CCND1 depletion as a potential cause of DNA damage. Finally, in contrast to depletion or inhibition of cyclin-dependent kinase 4, CCND1 depletion increased chemosensitivity of MCL cells to replication inhibitors hydroxyurea and cytarabine. Our findings have an important implication for CCND1 as a potential therapeutic target in MCL patients who are refractory to standard chemotherapy.

Keywords: Chemoresistance; DNA damage; cyclin D1; mantle cell lymphoma; replication stress.


Conflict of interest statement

Disclosure of Potential Conflicts of Interest: No potential conflicts of interest were disclosed by all authors.

Figures

Figure 1
Figure 1. CCND1 is required for survival of MCL cells
A. Immunoblot shows UPN-1 and JEKO-1 cells express little CDK6 with U2-OS cells as a positive control for CDK6 expression. B. Immunoblot shows protein knockdown in indicated MCL cell lines on day four after transfection with scramble control (sc), CCND1 (D1), or CDK4 (K4) siRNA. Numbers below the bands are relative densitometric values between target proteins and GAPDH loading control, followed by normalization to the control siRNA for each protein. C. Effects of siRNA knockdown on cell proliferation. Shown are the numbers of viable cells as determined by trypan blue exclusion on day seven after transfection with indicated siRNA. D. Detection of apoptosis in indicated cell lines seven days after transfection with indicated siRNA. Shown are representative histograms of live cells stained with the active caspase-3 antibody followed by fluorescence-activated cell sorting (FACS) analysis. E. Quantification of active caspase 3-positive cell fractions described in (D). F. Immunoblot analysis of indicated cell lines 48 hours after treatment with indicated doses of PD-0332991. Inhibition of CDK4/6 activity by PD-0332991 was shown by dephosphorylation of the CDK4/6 target protein RB or RBL2. RB was absent in UPN-1 cells and, therefore, RBL2 was analyzed. Relative densitometric values were calculated as described in (B). G. Effects of PD-0332991 on cell proliferation. Shown are percentages of viable cells compared to DMSO-treated cells as determined by the Celltiter-Glo assay seven days after treatment with indicated doses of PD-0332991. H. Detection of apoptosis in indicated cell lines after seven-day treatment with PD-0332991 as described in (D). I. Quantification of active caspase 3-positive cell fractions described in (H). J. Toxicity of CCND1 shRNA in MCL cell lines. Shown are the normalized fractions (to day 0 values) of GFP+, shRNA-expressing cells relative to GFP-, shRNA-negative fractions at indicated times. K. Rescue of CCND1 shRNA toxicity by cDNA complementation. UPN-1 cells were transduced with a doxycycline (dox)-inducible 3′ UTR-directed CCND1 shRNA (shCCND1-2) and a rescue vector constitutively expressing HA-tagged, wild-type (WT) CCND1 coding regions or an empty vector. Apoptotic cells were assessed as described in (D) at indicated times after shRNA induction and shown as percentages of active caspase 3/cleaved PARP-1-positive cells. Inset, immunoblot verifies CCND1 overexpression or knockdown two days after shRNA induction. # non-specific bands. L. Effects of CCND1 or CDK4 depletion on cell growth. Shown are the means of live cell numbers of control or shRNA-induced cells as determined by trypan blue exclusion on indicated days. M. Apoptosis in UPN-1 cells transduced with indicated shRNA was detected at indicated times after shRNA induction by staining with active caspase-3 and cleaved PARP-1 antibodies. Inset, immunoblot confirms protein knockdown two days after shRNA induction. Values in line graphs or bar graphs are the means of three independent experiments. Error bars, SD. **** P < 0.0001; *** P < 0.001; ** P < 0.01 by a two-tailed student's t-test.
Figure 2
Figure 2. CCND1 is required for DNA stability in MCL cells
A. CCND1 depletion induces gamma-H2AX expression. Immunoblot analysis of indicated MCL cell lines on day three or four after transfection with control (con) or CCND1 (D1) siRNA. Primary MCL cells (MCL #1) with more than 95% of tumor content (see Supplementary Figure S4) were transduced with control or CCND1 shRNA-expressing lentivirus and analyzed by immunoblot on day 4 after transduction. Relative densitometric values were calculated as described in Figure 1B. B. Effect of CDK4 inhibition on gamma-H2AX expression. UPN-1 and JEKO-1 cells were treated with 250 nM of PD-0332991 for indicated times and analyzed by immunoblot. Relative densitometric values were calculated as described in Figure 1B. C. CCND1 depletion induces DNA DSB foci. CCND1 or CDK4 shRNA-transduced UPN-1 cells were induced with Dox for four days. Shown are representative confocal immunofluorescence images of uninduced and induced cells stained with Alexa-Fluor 555-conjugated phospho-H2AX (S139) antibody (red) followed by nuclear staining with DAPI (blue). Scale bars, 20 μm. Bar graphs show the mean values of cell fractions that are positive for phospho-H2AX (γH2AX) foci from two independent experiments. Error bars, SEM. Foci of at least 1mm in diameter were considered positive for γH2AX. On average, 500 cells from each group were counted. **** P < 0.0001 by a Chi-square test; ns, not significant. More γH2AX foci in uninduced CCND1 shRNA-transduced cells than in CDK4 shRNA-transduced cells indicate “leakiness” of the Dox inducible system in UPN-1 cells. D. CCND1 depletion induces genomic instability. Representative bright-field images of uninduced or day-four induced UPN-1 cells treated with cytochalasin B followed by Giemsa nuclear staining. Scale bars, 20 μm. Bar graphs show the percentages of binucleated (BN) cells with micronucleus (MN) formation from two separate experiments. Error bars, SEM; **** P < 0.0001 by a two-sided Fisher's exact test. Approximately 200 binucleated (BN) cells from each group were counted.
Figure 3
Figure 3. Effects of CCND1 depletion in a xenograft model of MCL
Five millions of CCND1 shRNA-transduced UPN-1 cells were injected subcutaneously into NSG mice and shRNA expression was induced by adding Dox to mouse drinking water. A. Shown are the means of tumor volumes (n = 7). Error bars, SEM. B. Shown are the means of tumor weights. Error bars, SD. C. Lysates of MCL tumors harvested from control or Dox-induced mice on day 21 were immunoblotted with indicated antibodies. D, E. Representative immunofluorescence images of tumor sections from control and Dox-induced groups were stained with indicated antibodies followed by fluorescently labeled secondary antibody and nuclear staining with DAPI. Scale bars, 10 μm. Bar graphs show the percentages of γH2AX+ or active caspase 3+ cells from control (n=3) or Dox-induced (n=3) xenografts. Foci with at least 1mm in diameter were considered positive for γH2AX. At least 500 DAPI-positive cells were counted in non-overlapping fields of immunofluorescence images. Error bars, SD; *** P < 0.001; * P < 0.05 by a two-tailed Student's t-test.
Figure 4
Figure 4. CCND1 depletion increases replication initiation frequency in UPN-1 cells
CCND1 or CDK4 shRNA-transduced UPN-1 cells were induced with Dox for four days and sequentially pulse-labeled with IdU and CIdU, as illustrated in the diagram (A). B. DNA fibers from labeled cells were spread on glass slides and incorporated IdU and CIdU were detected by immunofluorescence. Shown are representative fluorescence images of labeled DNA fibers. C. Inter-origin distances as illustrated in (A) and shown in (B) were measured in micrometers and quantified by boxplots, with bars contained in boxplots representing median values. Scale bars, 10 μm; **** P < 0.0001. ns, not significant. P values are from the two-tailed Mann-Whitney test for 100-200 scorable tracks on average per sample.
Figure 5
Figure 5. CCND1 depletion sensitizes MCL cells to DNA replication inhibitors
A-D. MCL lines were transfected with siRNA against CCND1 (D1) or CDK4 (K4) or a control siRNA on day zero and again on day two (see Materials and Methods). On day three, 1.5 × 10⁵ live cells were counted and re-plated, followed by addition of HU (A, B) or cytarabine (C, D) at indicated doses. Apoptosis was assessed by Annexin V/PI staining on day five. Shown are percentages of Annexin V+/PI+ cells. Inset, confirmation of protein knockdown three days after siRNA transfection by immunoblotting with indicated antibodies. E. CCND1 shRNA sensitizes UPN-1 cells to DNA replication inhibitors. CCND1 shRNA-transduced UPN-1 cells were induced with Dox for four days followed by treatment with HU (0.25 mM) or aphidicolin (APH, 1000 nM) for two days and analyzed for apoptosis by Annexin V/PI staining. F, G. CDK4 inhibition increases chemoresistance in MCL cells to HU. UPN-1 or JEKO-1 cells were treated with indicated doses of HU in combination with DMSO or 250 nM of PD-0332991 for two days and analyzed for apoptosis by Annexin V/PI staining. Bar graphs show means of three independent experiments. Error bars, SD. *** P < 0.001, ** P < 0.01, * P < 0.05 by a two-tailed student's t-test.
Figure 6
Figure 6. Effects of CCND1 depletion on the cell cycle
A. Verification of CCND1 knockdown. Control or CCND1-depleted UPN-1 or JEKO-1 cells were analyzed for relative CCND1 mRNA expression by qPCR after 4 days of shRNA induction. Shown are the means of 3 independent experiments. Error bars, SD. B. Cell cycle profiles of MCL cells after CCND1 depletion. Four days after CCND1 depletion, cells were BrdU labeled for 30 minutes followed by FACS analysis. Shown are representative FACS plots of control or CCND1 depleted UPN-1 or JEKO-1 cells. Stacked column graphs show percentages of cells in each cell cycle phase, as defined by the drawn gates. Values are the means from 3 independent experiments. Error bars, SD. C. Cell cycle profiles of MCL cells after CDK4 inhibition. Indicated cells were treated with PD0332991 (250 nM) for four days and were labeled with BrdU as described in (B). Shown are representative FACS plots of control or treated UPN-1 or JEKO-1 cells. Stacked column graphs were generated as decribed in (B). Values are the means from 3 independent experiments. Error bars, SD.

References

    1. Jares P, Colomer D, Campo E. Genetic and molecular pathogenesis of mantle cell lymphoma: perspectives for new targeted therapeutics. Nat Rev Cancer. 2007;7(10):750–62. - PubMed
    1. Perez-Galan P, Dreyling M, Wiestner A. Mantle cell lymphoma: biology, pathogenesis, and the molecular basis of treatment in the genomic era. Blood. 2011;117(1):26–38. - PMC - PubMed
    1. Raffeld M, Jaffe ES. bcl-1, t(11;14), and mantle cell-derived lymphomas. Blood. 1991;78(2):259–63. - PubMed
    1. Sherr CJ. Mammalian G1 cyclins. Cell. 1993;73(6):1059–65. - PubMed
    1. Hatakeyama M, Brill JA, Fink GR, et al. Collaboration of G1 cyclins in the functional inactivation of the retinoblastoma protein. Genes Dev. 1994;8(15):1759–71. - PubMed

LinkOut - more resources