. 2016 Jun 7;17(6):897.
doi: 10.3390/ijms17060897.

Functional Characterization of Soybean Glyma04g39610 as a Brassinosteroid Receptor Gene and Evolutionary Analysis of Soybean Brassinosteroid Receptors

Affiliations

Functional Characterization of Soybean Glyma04g39610 as a Brassinosteroid Receptor Gene and Evolutionary Analysis of Soybean Brassinosteroid Receptors

Suna Peng et al. Int J Mol Sci. .

Abstract

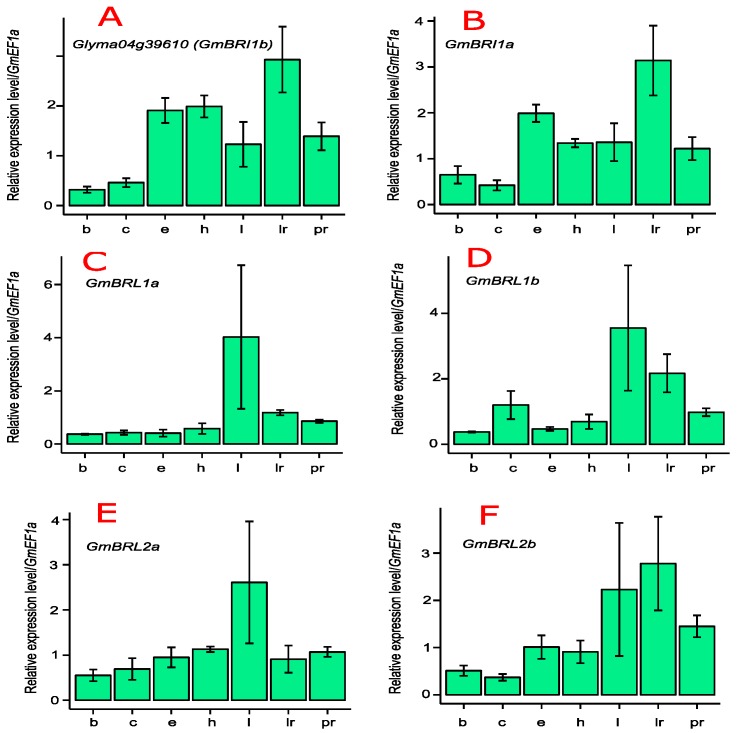
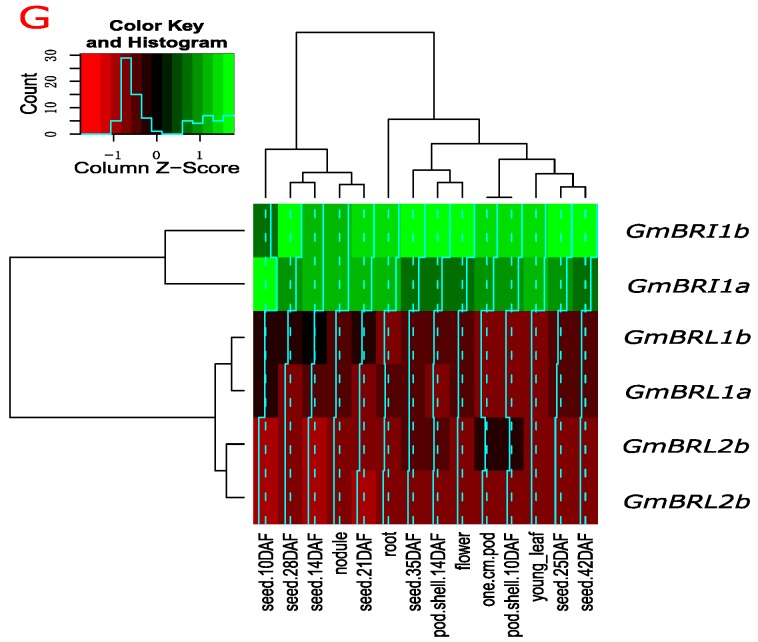
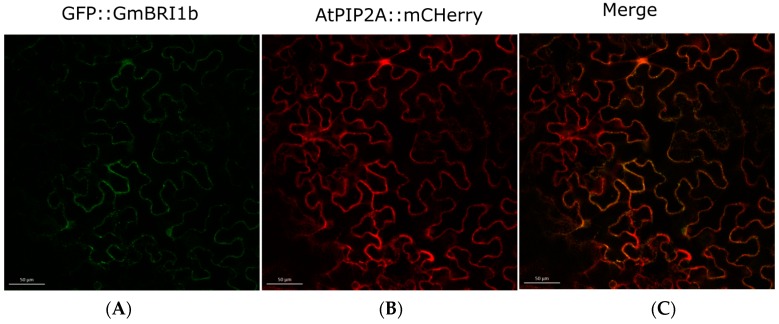
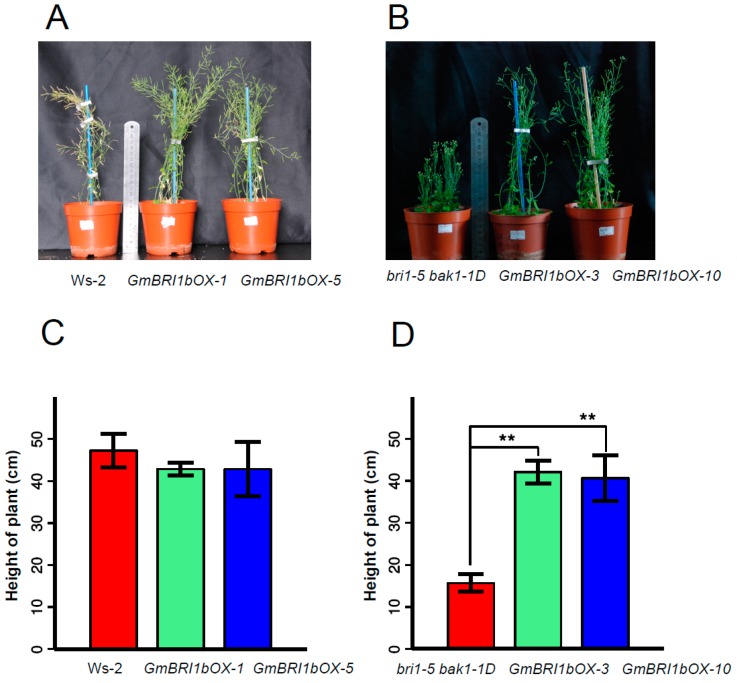
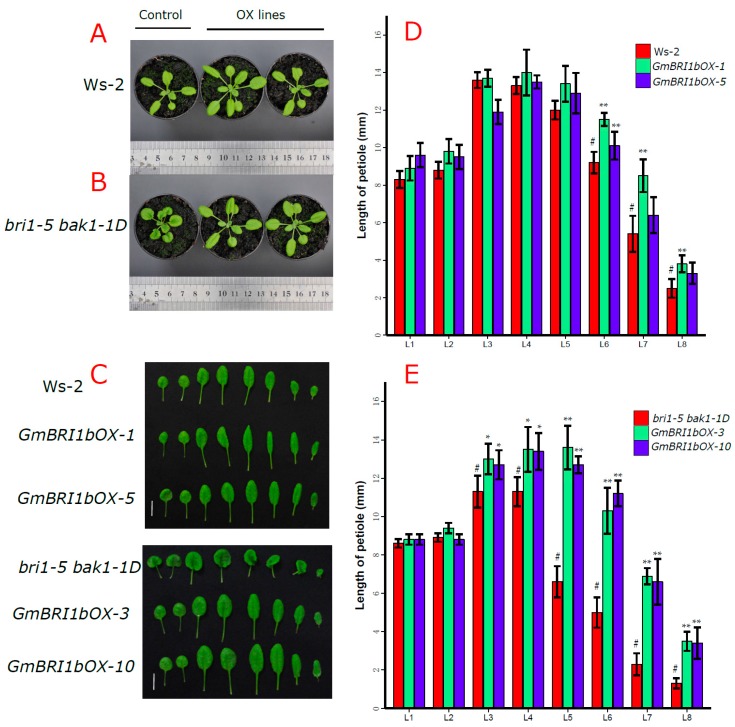
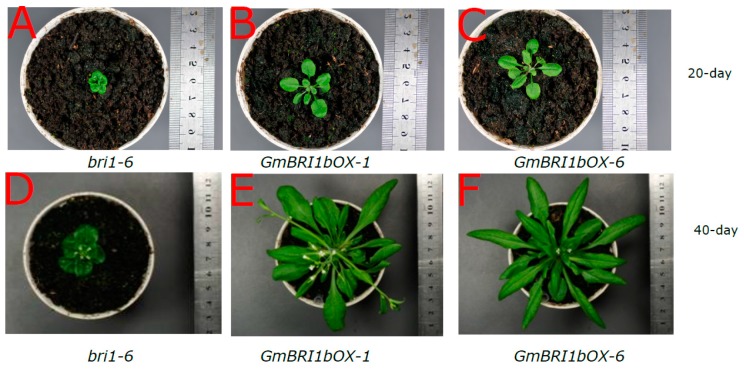
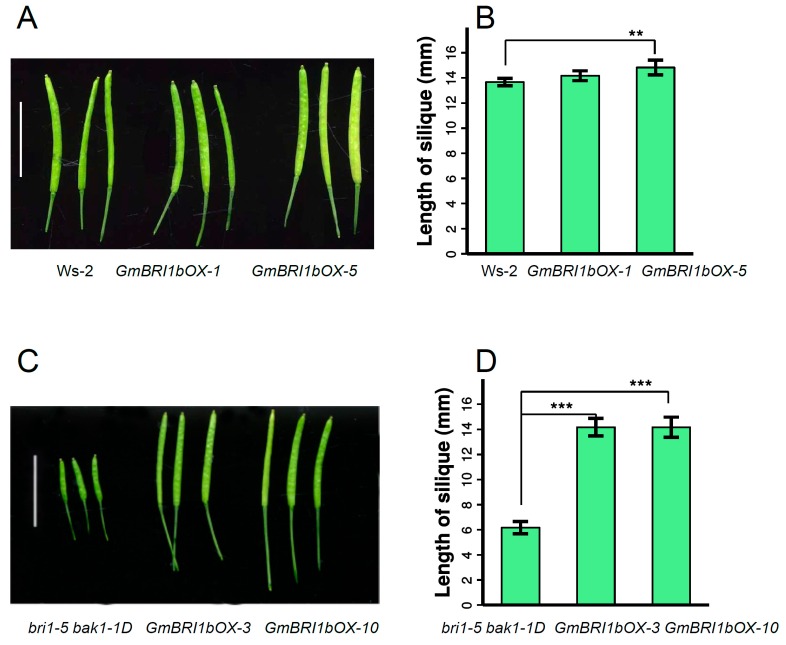
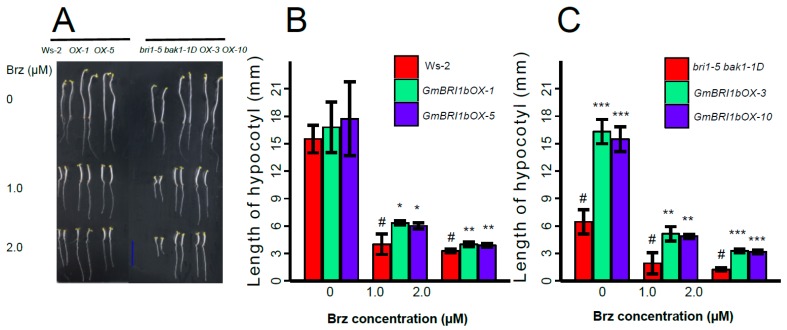
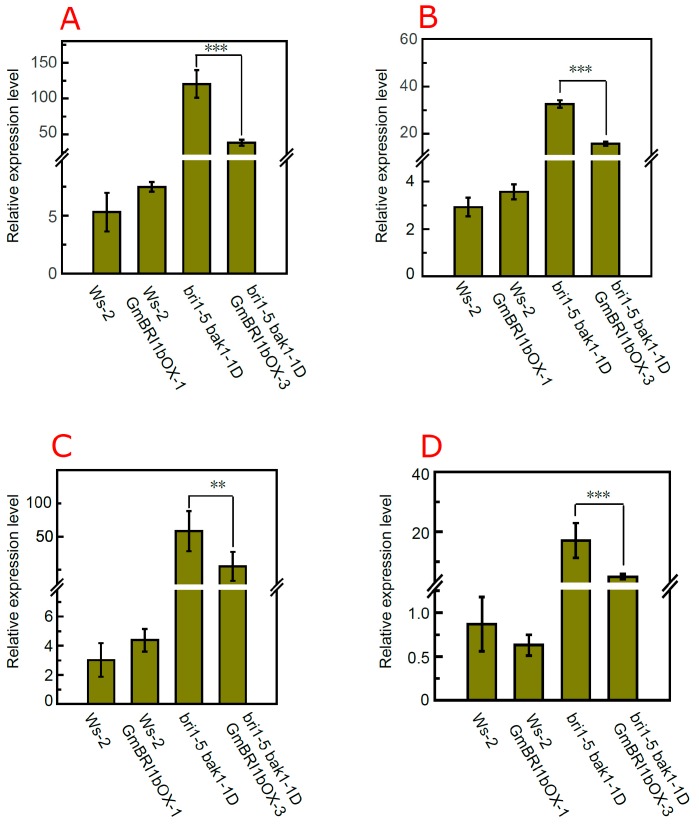
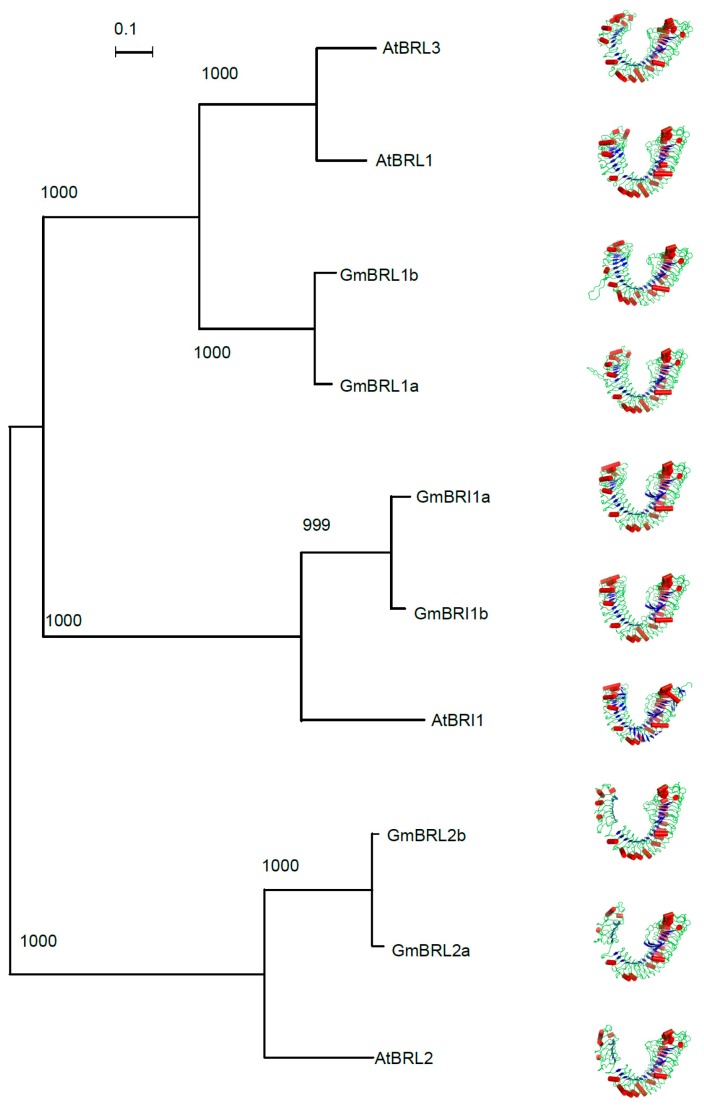
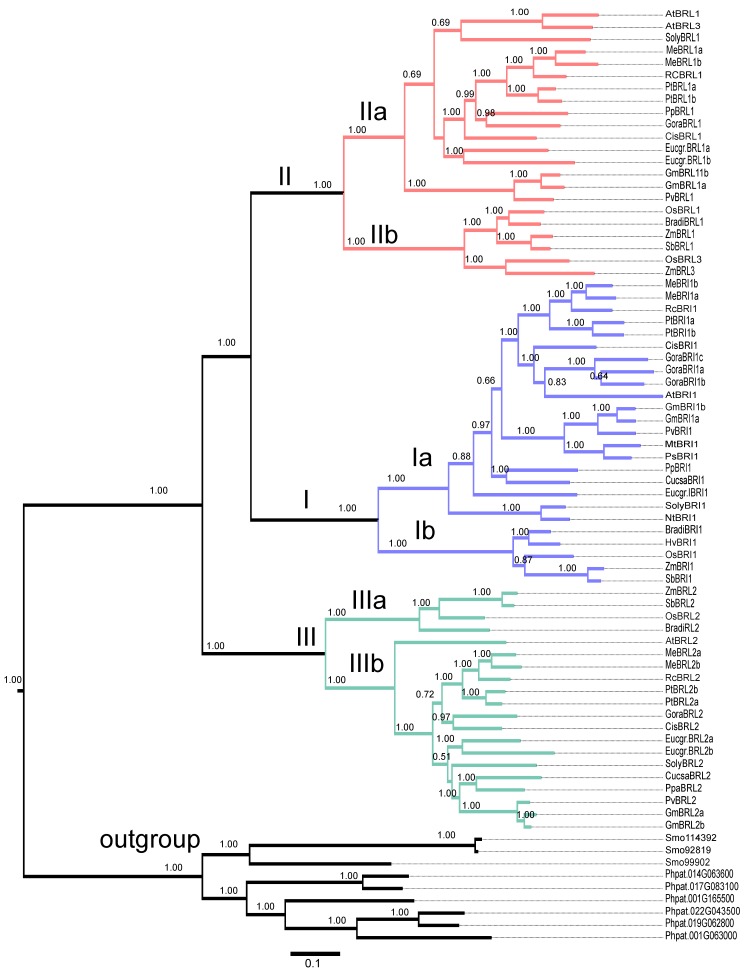
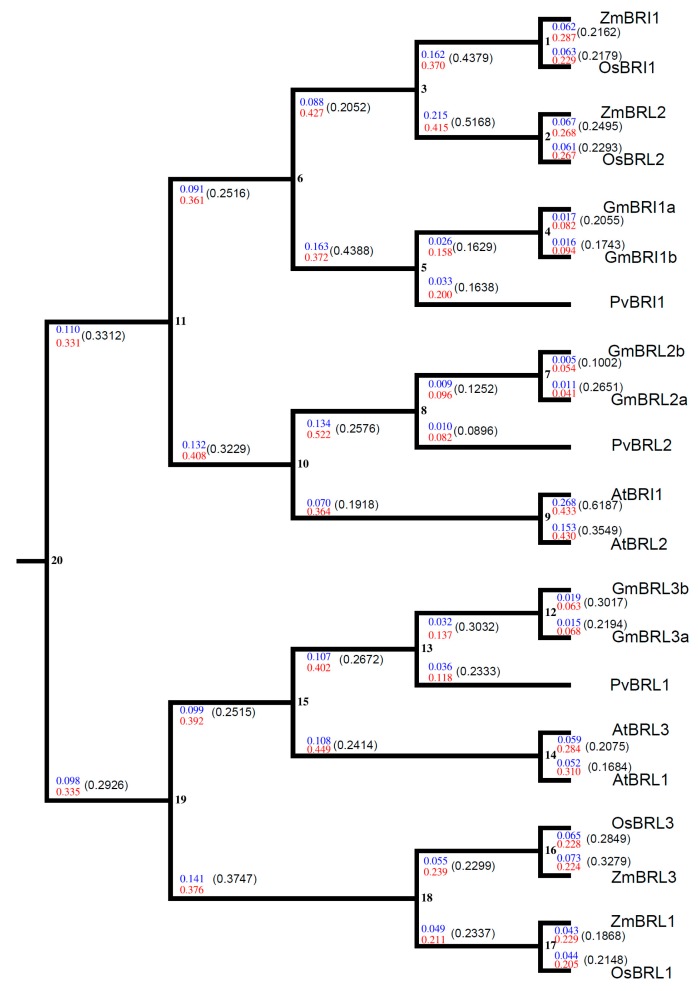
Brassinosteroids (BR) play important roles in plant growth and development. Although BR receptors have been intensively studied in Arabidopsis, the BR receptors in soybean remain largely unknown. Here, in addition to the known receptor gene Glyma06g15270 (GmBRI1a), we identified five putative BR receptor genes in the soybean genome: GmBRI1b, GmBRL1a, GmBRL1b, GmBRL2a, and GmBRL2b. Analysis of their expression patterns by quantitative real-time PCR showed that they are ubiquitously expressed in primary roots, lateral roots, stems, leaves, and hypocotyls. We used rapid amplification of cDNA ends (RACE) to clone GmBRI1b (Glyma04g39160), and found that the predicted amino acid sequence of GmBRI1b showed high similarity to those of AtBRI1 and pea PsBRI1. Structural modeling of the ectodomain also demonstrated similarities between the BR receptors of soybean and Arabidopsis. GFP-fusion experiments verified that GmBRI1b localizes to the cell membrane. We also explored GmBRI1b function in Arabidopsis through complementation experiments. Ectopic over-expression of GmBRI1b in Arabidopsis BR receptor loss-of-function mutant (bri1-5 bak1-1D) restored hypocotyl growth in etiolated seedlings; increased the growth of stems, leaves, and siliques in light; and rescued the developmental defects in leaves of the bri1-6 mutant, and complemented the responses of BR biosynthesis-related genes in the bri1-5 bak1-D mutant grown in light. Bioinformatics analysis demonstrated that the six BR receptor genes in soybean resulted from three gene duplication events during evolution. Phylogenetic analysis classified the BR receptors in dicots and monocots into three subclades. Estimation of the synonymous (Ks) and the nonsynonymous substitution rate (Ka) and selection pressure (Ka/Ks) revealed that the Ka/Ks of BR receptor genes from dicots and monocots were less than 1.0, indicating that BR receptor genes in plants experienced purifying selection during evolution.

Keywords: BR receptor; brassinosteroids; evolution; gene family; soybean.


Figures

Figure 1
Figure 1
Expression of soybean BR receptors:GmBRI1b (A); GmBRI1a (B); GmBRL1a (C); GmBRIL1b (D); GmBRL2a (E); and GmBRL2b (F) in apical buds (b), cotyledons (c), epicotyls (e), hypocotyls (h), leaves (l), lateral roots (lr), and primary roots (pr). GmEF1a was used to normalize the qRT-PCR data. Results in (AF) were means ± SD from three independent experiments, each of which were technically repeated three times. The normalized RNA-Seq expression data of soybean BR receptor genes were downloaded from SoyBase [47] (G).
Figure 1
Figure 1
Expression of soybean BR receptors:GmBRI1b (A); GmBRI1a (B); GmBRL1a (C); GmBRIL1b (D); GmBRL2a (E); and GmBRL2b (F) in apical buds (b), cotyledons (c), epicotyls (e), hypocotyls (h), leaves (l), lateral roots (lr), and primary roots (pr). GmEF1a was used to normalize the qRT-PCR data. Results in (AF) were means ± SD from three independent experiments, each of which were technically repeated three times. The normalized RNA-Seq expression data of soybean BR receptor genes were downloaded from SoyBase [47] (G).
Figure 2
Figure 2
Subcellular localization of GmBRI1b. The subcellular localization was determined with the constructs GFP::GmBRI1b: (A) GFP::BRI1b; (B) AtPIP1A::mCherry; and (C) merged image. The GFP and mCherry signals were detected at 484 and 544 nm, respectively. Scale bar = 50 µm.
Figure 3
Figure 3
Over-expression of GmBRI1b increased plant height in the bri1-5 bak1-1D mutant. The height of 50-day-old Ws-2 wild type and two corresponding GmBRI1b over-expression lines (GmBRI1b-OX) (A,C); and the bri1-5 bak1-1D mutant and corresponding GmBRI1b-OX lines (B,D). Results are means ± SD from five plants. Experiments were repeated two times with similar trend (Student’s t-test, ** p < 0.01).
Figure 4
Figure 4
Ectopic over-expression of GmBRI1b increased the length of the petioles in the transgenic bri1-5 bak1-1D mutant and wild type Ws-2. The 25-day-old plants (A). The 1st to the 8th leaves of the Ws-2 wild type and two corresponding GmBRI1b over-expression lines (GmBRI1b-OX) (B); and the bri1-5 bak1-1D mutant and corresponding GmBRI1b-OX lines (C). The length of the petioles from the 1st to the 8th leaves (L1-8) was measured in 25-day-old seedlings of the Ws-2 wild-type lines (D); and the bri1-5 bak1-1D mutant lines (E). Results are means ± SD from five independent experiments (in total, 25 seedlings were measured) (#, control; Student’s t-test, * p < 0.05; ** p < 0.01). Scale bar = 1 cm.
Figure 5
Figure 5
Ectopic over-expression of GmBRI1b restored the wild-type leaf phenotype in the transgenic bri1-6 mutant. Leaf phenotypes of the 20-day-old bri1-6 mutant (A); and the two corresponding GmBRI1b over-expression lines GmBRI1bOX-1 (B) and GmBRI1bOX-6 (C); Leaf phenotypes of the 40-day-old bri1-6 mutant (D); and the two corresponding GmBRI1b over-expression lines GmBRI1bOX-1 (E) and GmBRI1bOX-6 (F).
Figure 6
Figure 6
Over-expression of GmBRI1b increased the length of the siliques in the bri1-5bak1-1D mutant. The length of siliques in the Ws-2 wild type and the two corresponding GmBRI1b over-expression lines (GmBRI1b-OX) (A,B); and the bri1-5 bak1-1D mutant and corresponding GmBRI1b-OX lines (C,D). Results are means ± SD from three independent experiments (a total of 15 seedlings were measured) (Student’s t-test, ** p < 0.01, *** p < 0.001). Scale bar = 1 cm.
Figure 7
Figure 7
Over-expression of GmBRI1b increased the tolerance to Brz in the Arabidopsis plants. Hypocotyl measurements were taken after exposure to different concentrations of Brz in seedlings of the Ws-2 wild type and the two corresponding GmBRI1b over-expression lines (GmBRI1b-OX) (A,B); and the bri1-5 bak1-1D mutant and corresponding GmBRI1b-OX lines (A,C). All seedlings were grown under full darkness for seven days. Results are means ± SD from three independent experiments (a total of 30 seedlings were measured) (#, control; Student’s t-test, * p < 0.05; ** p < 0.01; *** p < 0.001). Scale bar = 1 cm.
Figure 8
Figure 8
Effect of ectopic over-expression of GmBRI1b on the expression of BR biosynthesis-related genes in the transgenic bri1-5 bak1-1D mutant. Seedlings were grown as described in Materials and Methods. qRT-PCR was used to detect the relative expression levels of: DWF4 (A); CPD (B); BR6ox-1 (C); and BR6ox-2 (D) in Ws-2 and bri1-5 bak1-1D mutant and their corresponding over-expression lines. Results are means ± SD from three independent experiments with three technical replicates (Student’s t-test, ** p< 0.01, *** p< 0.001).
Figure 9
Figure 9
Structural modeling of six soybean BR receptors. The program PhyML3.0 [58] was used to reconstruct the phylogenetic tree of BR receptors from Arabidopsis and soybean. The evolutionary lineages of four BR receptors in Arabidopsis and six BR receptors in soybean were compared. The LG model for amino acid substitutions with estimated Gamma distribution was used to reconstruct the tree and the bootstrap value was set as 1000. A total of ten BR receptors were classified into Clades I, II, and III. The numbers above each branch of the tree are the bootstrap values. Scale bar indicates 0.1 amino acid substitution over evolution. In addition, the ectodomains of ten BR receptors were modeled with MODELLER9.11 software [59] based on the template of AtBRI1, which was determined with X-ray crystallization on a 3-D level in 2011 [28]. The PDB files were processed with PyMOL v1.5 software [60].
Figure 10
Figure 10
Evolutionary analysis of BR receptors in plants. BLASTP was used to search for BR receptor homologs in different plant species. A total of 76 BR receptors as shown in Spreadsheet S1 were analyzed from monocots (Oryza sativa (Os), Zea mays (Zm), Sorghum bicolor (Sb), Brachypodium distachyon (Bradi)), dicots (Arabidopsis thaliana (At), Glycine max (Gm), Solanum lycopersicum (Soly), Medicago truncatula (Mt), Phaseolus vulgaris (Pv), Populus trichocarpa (Pt), Eucalyptus grandis (Eucgr), Citrus sinensis (Cis), Gossypium raimondii (Gora), Cucumis sativa (Cusa), Prunus persica(Pp), Manihot esculenta (Me), Ricinus communis (Rc), and Nicotiana tabacum (Nt)), moss (Physcomitrella patens (Phpat)), and fern (Selaginella moelledorffii (Smo)) and grouped into three clades, CladesI, II, and III. Additionally, nine BR receptor homologs from moss and fern were determined to be members of an outgroup. The values above the branches are the probability of the bootstrap value with 1000 repeats. MrBayes 3.2 software was used to reconstruct the phylogenetic tree as described in the Methods Section. Scale bar indicates 0.1 amino acid substitution over evolution.
Figure 11
Figure 11
Estimation of Ka/Ks in the BR receptor genes from soybean, common bean, Arabidopsis, rice, and maize. The cDNA sequences and amino acid sequences of the BR receptors from dicots (soybean, common bean, and Arabidopsis) and monocots (rice and maize) were used to estimate the Ka/Ks. Twenty nodes are shown. The Ka and Ks values in each node and branch are marked in blue and red, respectively. The Ka/Ks in each branch is indicated in parentheses and all Ka/Ks values were less than 1.0.

Similar articles

Cited by

References

    1. Müssig C., Shin G.H., Altmann T. Brassinosteroids promote root growth in Arabidopsis. Plant Physiol. 2003;133:1261–1271. doi: 10.1104/pp.103.028662. - DOI - PMC - PubMed
    1. Hacham Y., Holland N., Butterfield C., Ubeda-Tomas S., Bennett M.J., Chory J., Savaldi-Goldstein S. Brassinosteroid perception in the epidermis controls root meristem size. Development. 2011;138:839–848. doi: 10.1242/dev.061804. - DOI - PMC - PubMed
    1. Kim T.W., Michniewicz M., Bergmann D.C., Wang Z.Y. Brassinosteroid regulates stomatal development by GSK3-mediated inhibition of a MAPK pathway. Nature. 2012;482:419–422. doi: 10.1038/nature10794. - DOI - PMC - PubMed
    1. Leubner-Metzger G. Brassinosteroids and gibberellins promote tobacco seed germination by distinct pathways. Planta. 2001;213:758–763. doi: 10.1007/s004250100542. - DOI - PubMed
    1. Chory J., Nagpal P., Peto C.A. Phenotypic and genetic analysis of det2, a new mutant that affects light-regulated seedling development in Arabidopsis. Plant Cell. 1991;3:445–459. doi: 10.1105/tpc.3.5.445. - DOI - PMC - PubMed

LinkOut - more resources