. 2016 Jun 22;17(6):966.
doi: 10.3390/ijms17060966.

Expression of Stipa purpurea SpCIPK26 in Arabidopsis thaliana Enhances Salt and Drought Tolerance and Regulates Abscisic Acid Signaling

Affiliations

Expression of Stipa purpurea SpCIPK26 in Arabidopsis thaliana Enhances Salt and Drought Tolerance and Regulates Abscisic Acid Signaling

Yanli Zhou et al. Int J Mol Sci. .

Abstract

Stipa purpurea (S. purpurea) is the dominant plant species in the alpine steppe of the Qinghai-Tibet Plateau, China. It is highly resistant to cold and drought conditions. However, the underlying mechanisms regulating the stress tolerance are unknown. In this study, a CIPK gene from S. purpurea (SpCIPK26) was isolated. The SpCIPK26 coding region consisted of 1392 bp that encoded 464 amino acids. The protein has a highly conserved catalytic structure and regulatory domain. The expression of SpCIPK26 was induced by drought and salt stress. SpCIPK26 overexpression in Arabidopsis thaliana (A. thaliana) plants provided increased tolerance to drought and salt stress in an abscisic acid (ABA)-dependent manner. Compared with wild-type A. thaliana plants, SpCIPK26-overexpressing plants had higher survival rates, water potentials, and photosynthetic efficiency (Fv/Fm), as well as lower levels of reactive oxygen species (ROS) following exposure to drought and salt stress. Gene expression analyses indicated stress-inducible genes (RD29A, RD29B, and ABF2) and a ROS-scavenger gene (CAT1) were upregulated in SpCIPK26-overexpressing plants after stress treatments. All of these marker genes are associated with ABA-responsive cis-acting elements. Additionally, the similarities in the gene expression patterns following ABA, mannitol, and NaCl treatments suggest SpCIPK26 has an important role during plant responses to drought and salt stress and in regulating ABA signaling.

Keywords: ABA; CIPK; ROS; Stipa purpurea; drought; salt.


Figures

Figure 1
Figure 1
Sequence analysis of SpCIPK26. (A) Nucleotide and deduced protein sequence of SpCIPK26. Amino acids underlined with solid lines represent NAF domain and marked with dashed line represents catalytic domain; (B) alignment of the deduced protein sequence of SpCIPK26 and its homologous amino acids from other plant species. Alignments were performed in MEGA6. Identical amino acid residues are shown in indigo background, amino acid with larger than 75% and 50% identity are shown in cyan and pink, respectively; (C) phylogeny of SpCIPK26 and CIPK members of Oryza sativa. Pink dot means SpCIPK26. The phylogenetic tree was constructed in MEGA6 using the putative amino acid sequences.
Figure 2
Figure 2
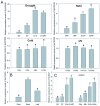
Expression pattern of SpCIPK26 in S. purpurea (Stipa purpurea). (A) Relative expression levels of SpCIPK26 in S. purpurea under abiotic stress. Drought stress was conducted by withholding water (D0) for seven days (D7), 14 days (D14) and then rehydrated for another seven days (D14R7). Salt treatment was conducted by irrigating three-week-old S. purpurea seedlings with 150 mM NaCl and samples were taken at indicated time. S suffixed with time point (i.e., S0h) means S. purpurea seedlings treated by salt for specific time. For cold stress, three-week-old S. purpurea seedlings were placed at 4 °C. UV treatment was imposed by irradiating ultraviolet lamp at the intensity of 8 μW/cm2; (B) transcriptional level of SpCIPK26 in different tissues. The expression level in roots was normalized as control; (C) expression of SpNECD3 in response to drought and salt treatment. All treatments were replicated three times biologically. Error bar denotes standard deviation, and different letters above the bars indicate significant difference of pair-wise comparison between different treatment times at p < 0.01.
Figure 3
Figure 3
Phenotypic analysis of SpCIPK26-overexpressing (OXP) and WT in response to drought (mannitol) and salt (NaCl) stress. (A) Primary root length of transgenic plants under drought and salt stress. Seeds were grown on 1/2 Murashige and Skoog (MS) medium for 10 days and that containing 200 mM mannitol or 150 mM NaCl; (B) Survival rate of transgenic plants under drought and salt stress. Seedlings germinated on 1/2 MS medium for five days, then transferred to mediums containing 200 mM NaCl for 3 days or 300 mM mannitol for six days. All treatments were replicated three times biologically. Error bar denotes standard deviation, and different letters above the bars signify significant difference between wild type (control, Col) and three transgenic lines (L2, L4 and L5) at p < 0.01. Bars = 1 cm.
Figure 4
Figure 4
Effect of drought and salt stress on the seedling growth and survival rate of SpCIPK26-OXP and WT planted in soil: (A,B) phenotype and photosynthetic efficiency (Fv/Fm) comparison between SpCIPK26-OXP and WT in response to drought and salt treatment, respectively; and (C,D) survival rate of SpCIPK26-OXP and WT after drought and salt stress. Drought treatment was imposed by continuously withholding water to soil-grown plants and salt was done by irrigating 30 mL NaCl solution every day at the concentration of 150 mM. All treatments were replicated six times biologically. Error bar denotes standard deviation, and different letters above the bars signify significant difference between wild type (control, Col) and transgenic lines (L2, L4 and L5) at p < 0.01. Bar = 10 cm.
Figure 5
Figure 5
Water potential and ABA content of SpCIPK26-OXP and WT suffered from drought and salt treatment: (A,B) water potential of transgenic and WT plants at different drought and salt treatment time; and (C,D) stand results of ABA concentration of plant leaves stressed by drought and salt for different time. Drought was carried out by withholding water for indicated time, and salt was handled by irrigating 150 mM NaCl every day and samples were collected weekly. All treatments were replicated three times biologically. Error bar denotes standard deviation, and different letters above the bars signify significant difference between wild type (control, Col) and transgenic lines (L2, L4 and L5) at p < 0.01.
Figure 6
Figure 6
In situ ROS generation in SpCIPK26-OXP and WT subjected to drought and salt stress: (A,C) O2 contents in plants treated with drought and salt, respectively; and (B,D) H2O2 detection of plants treated with drought and salt, respectively. Stress was processed as depicted in Figure 3. O2 was detected by nitro-blue tetrazolium (NBT) reduction and H2O2 was detected by diaminobenzidine (DAB) at specific time points. Samples were taken on the 7th, 14th and 21st days for drought and at the 7th and 14th for salt, and samples at the start of treatments were taken as control (Col). The 4th–6th leaves were taken from every plant. All treatments were replicated three times biologically. L2, L4 and L5 mean three transgenic lines (SpCIPK26-OXP).
Figure 7
Figure 7
Effect of ABA on the root length, stress tolerance and germination of SpCIPK26-OXP. (A) Effect of ABA and its inhibitor sodium tungstate (WS) on the seedling growth under normal or stress condition. Photograph was taken of seven-day-old seedlings from each line; (B) root length of seedlings presented in (A); (C) germination of SpCIPK26-OXP and WT seeds sown on half MS containing 0.2 μM ABA, 200 mM mannitol and 150 mM NaCl; (D) Germination percentage of seedlings presented in (C) and the number of seedlings was counted as emergence of cotyledon. All experiments were replicated three times and each column represent means ± SD. Error bar denotes standard deviation, and different letters above the bars signify significant difference between wild type (control, Col) and transgenic lines (L2, L4 and L5) at p < 0.01. Bars = 1 cm.
Figure 7
Figure 7
Effect of ABA on the root length, stress tolerance and germination of SpCIPK26-OXP. (A) Effect of ABA and its inhibitor sodium tungstate (WS) on the seedling growth under normal or stress condition. Photograph was taken of seven-day-old seedlings from each line; (B) root length of seedlings presented in (A); (C) germination of SpCIPK26-OXP and WT seeds sown on half MS containing 0.2 μM ABA, 200 mM mannitol and 150 mM NaCl; (D) Germination percentage of seedlings presented in (C) and the number of seedlings was counted as emergence of cotyledon. All experiments were replicated three times and each column represent means ± SD. Error bar denotes standard deviation, and different letters above the bars signify significant difference between wild type (control, Col) and transgenic lines (L2, L4 and L5) at p < 0.01. Bars = 1 cm.
Figure 8
Figure 8
Results of qRT-PCR analysis on stress-related genes in response to ABA, mannitol and NaCl treatment. Expression profile in the first column are results of SpCIPK26-OXP and WT irrigated with 0.2 μM ABA, which in middle and right column are treated with 200 mM mannitol and 150 mM NaCl for 0, 3, 6 and 9 h, respectively. The SpCIPK26-OXP and WT cultured on 1/2 MS for two weeks were subjected to stress treatments and values of each gene detected in wild type at 0 h was standardized to 1. Amplification of UBQ10 was used at internal control. Mean values and standard deviation (error bar) were calculated from three independent experiments and asterisk (*) above the bar stand for significant difference between wild type (Col) and transgenic lines (L2, L4 and L5) at p < 0.01.
Figure 8
Figure 8
Results of qRT-PCR analysis on stress-related genes in response to ABA, mannitol and NaCl treatment. Expression profile in the first column are results of SpCIPK26-OXP and WT irrigated with 0.2 μM ABA, which in middle and right column are treated with 200 mM mannitol and 150 mM NaCl for 0, 3, 6 and 9 h, respectively. The SpCIPK26-OXP and WT cultured on 1/2 MS for two weeks were subjected to stress treatments and values of each gene detected in wild type at 0 h was standardized to 1. Amplification of UBQ10 was used at internal control. Mean values and standard deviation (error bar) were calculated from three independent experiments and asterisk (*) above the bar stand for significant difference between wild type (Col) and transgenic lines (L2, L4 and L5) at p < 0.01.

References

    1. Ibraheem O., Dealtry G., Roux S., Bradley G. The effect of drought and salinity on the expressional levels of sucrose transporters in rice (Oryza sativa Nipponbare) cultivar plants. Plant Omics. 2011;4:68–74.
    1. Chaves M., Flexas J., Pinheiro C. Photosynthesis under drought and salt stress: Regulation mechanisms from whole plant to cell. Ann. Bot. 2009;103:551–560. doi: 10.1093/aob/mcn125. - DOI - PMC - PubMed
    1. Llanes A., Andrade A., Masciarelli O., Alemano S., Luna V. Drought and salinity alter endogenous hormonal profiles at the seed germination phase. Seed Sci. Res. 2016;26:1–13. doi: 10.1017/S0960258515000331. - DOI
    1. Zhang X., Lu G., Long W., Zou X., Li F., Nishio T. Recent progress in drought and salt tolerance studies in Brassica crops. Breed. Sci. 2014;64:60–73. doi: 10.1270/jsbbs.64.60. - DOI - PMC - PubMed
    1. Zhu J.-K. Salt and drought stress signal transduction in plants. Annu. Rev. Plant Biol. 2002;53:247–273. doi: 10.1146/annurev.arplant.53.091401.143329. - DOI - PMC - PubMed

MeSH terms

LinkOut - more resources