. 2016 Oct;30(10):3378-3387.
doi: 10.1096/fj.201600473R. Epub 2016 Jun 23.

Hypophosphatemia promotes lower rates of muscle ATP synthesis

Affiliations

Hypophosphatemia promotes lower rates of muscle ATP synthesis

Dominik H Pesta et al. FASEB J. 2016 Oct.

Abstract

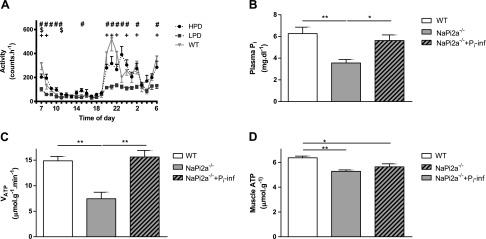
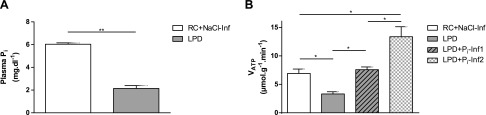
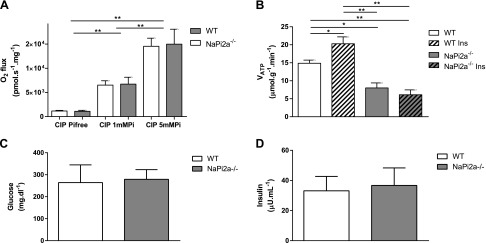
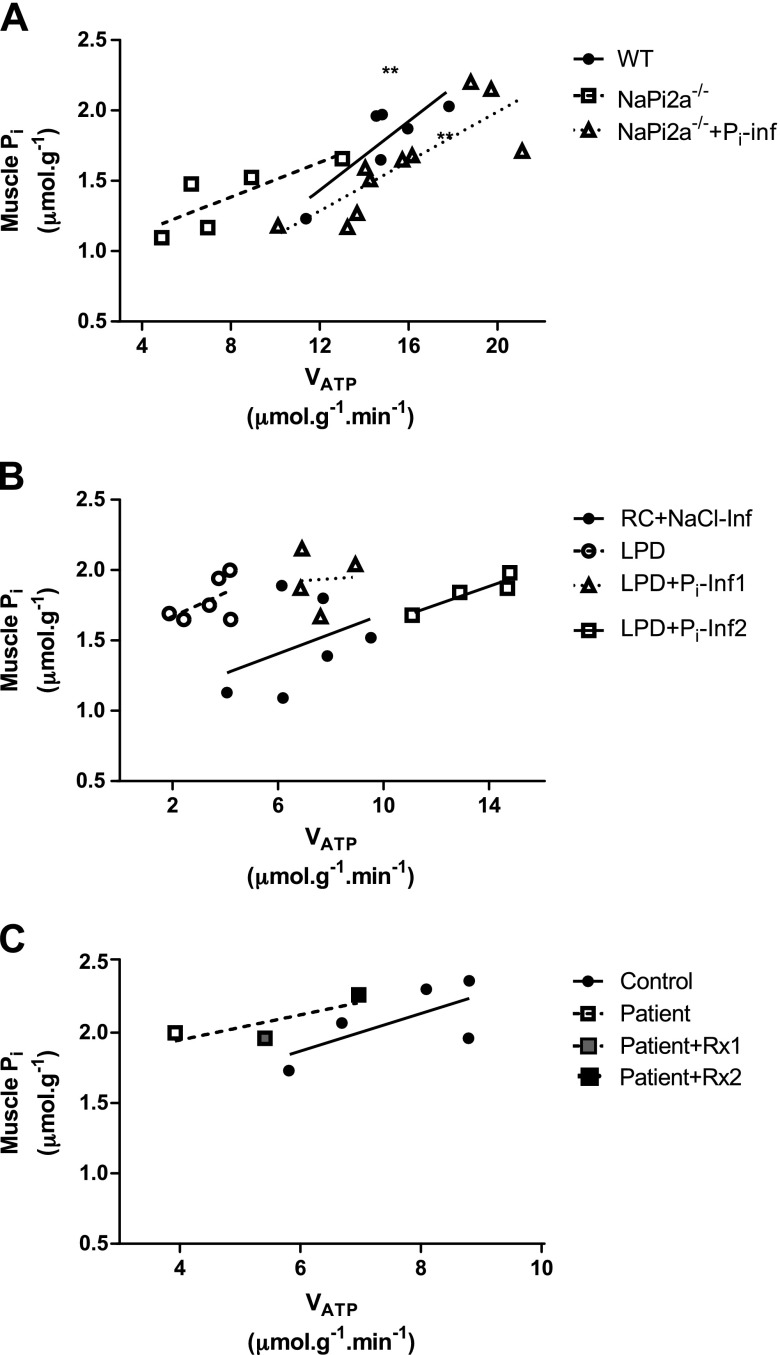
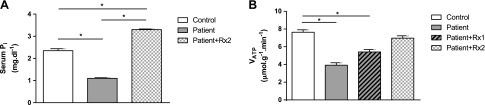
Hypophosphatemia can lead to muscle weakness and respiratory and heart failure, but the mechanism is unknown. To address this question, we noninvasively assessed rates of muscle ATP synthesis in hypophosphatemic mice by using in vivo saturation transfer [31P]-magnetic resonance spectroscopy. By using this approach, we found that basal and insulin-stimulated rates of muscle ATP synthetic flux (VATP) and plasma inorganic phosphate (Pi) were reduced by 50% in mice with diet-induced hypophosphatemia as well as in sodium-dependent Pi transporter solute carrier family 34, member 1 (NaPi2a)-knockout (NaPi2a-/-) mice compared with their wild-type littermate controls. Rates of VATP normalized in both hypophosphatemic groups after restoring plasma Pi concentrations. Furthermore, VATP was directly related to cellular and mitochondrial Pi uptake in L6 and RC13 rodent myocytes and isolated muscle mitochondria. Similar findings were observed in a patient with chronic hypophosphatemia as a result of a mutation in SLC34A3 who had a 50% reduction in both serum Pi content and muscle VATP After oral Pi repletion and normalization of serum Pi levels, muscle VATP completely normalized in the patient. Taken together, these data support the hypothesis that decreased muscle ATP synthesis, in part, may be caused by low blood Pi concentrations, which may explain some aspects of muscle weakness observed in patients with hypophosphatemia.-Pesta, D. H., Tsirigotis, D. N., Befroy, D. E., Caballero, D., Jurczak, M. J., Rahimi, Y., Cline, G. W., Dufour, S., Birkenfeld, A. L., Rothman, D. L., Carpenter, T. O., Insogna, K., Petersen, K. F., Bergwitz, C., Shulman, G. I. Hypophosphatemia promotes lower rates of muscle ATP synthesis.

Keywords: [31P]MRS; inorganic phosphate; saturation transfer.


Figures

Figure 1.
Figure 1.
NaPi2a−/− mice were studied at age 5–6 mo after receiving LPD (0.02% Pi, 0.6% Ca) or HPD (1.2% Pi, 0.6% Ca) for 10 wk. A) CLAMS was used to determine activity over a period of 72 h for LPD and HPD, which was compared with WT littermate controls on regular chow (RC). Activity was reduced in mice that received LPD and was mostly normalized after administering HPD. B, C) Mice with genetically induced hypophosphatemia (NaPi2a−/−) were hypophosphatemic compared with WT littermate controls (B) and showed reduced VATP determined by ST-[31P]MRS (C). D) Actual muscle ATP concentration measured by LC-MS was decreased in NaPi2a−/− mice compared with WT littermate controls. Plasma Pi levels and VATP normalized to euphosphatemic levels after infusion of a bolus of 25 μmol Pi (B, C), whereas muscle ATP concentration was not changed after infusion (D). All data are means ± sem; n = 5–8 in each group. +P < 0.05, NaPi2a−/− on LPD vs. WT on RC; $P < 0.05, NaPi2a−/− on HPD vs. WT on RC; #P < 0.01, NaPi-2a−/− on LPD vs. HPD; *P < 0.05; **P < 0.01 by double-sided Student’s t test.
Figure 2.
Figure 2.
A) WT mice 12–18 wk old maintained on LPD for 2 wk become hypophosphatemic. Mice received a bolus of 30 μmol Pi (Pi-Inf1), 60 μmol (Pi-Inf2), and saline for control group (NaCl-Inf) while in the magnet. B) VATP determined by ST-[31P]MRS was reduced in LPD mice, was increased in these animals after Pi-Inf1, and further increased after Pi-Inf2 compared with NaCl-infused mice. See Fig. 1 and Table 1 for composition of LPD and regular chow (RC). All data are means ± sem; n = 5–8 in each diet group. *P < 0.05, **P < 0.01 by double-sided Student’s t test.
Figure 3.
Figure 3.
A) In vitro measurement of oxygen flux in isolated skeletal muscle mitochondria of WT and NaPi2a−/− mice increased in a dose-dependent manner upon addition of 1 and 5 mM Pi to medium; however, mitochondrial function per se is not impaired in NaPi2a−/− mice compared with WT. B) Insulin increased VATP in WT but not in NaPi2a−/− mice when mice were infused with 5 mU/kg/min insulin, followed by 3 mU/kg/min of insulin and 12.5 mg/kg/min of 20% glucose at a rate of 2.1 μl/min on the basis of body weight of the animal to maintain euglycemia and hyperinsulinemia during ST-[31P]MRS (hyperinsulinemic-euglycemic clamp). C, D) Plasma glucose (C) and insulin (D) values measured after the experiment were not different between the 2 groups. CIP, oxidative phosphorylation capacity of complex I–related substrates. All data are means ± sem; n = 5–8 in each group. *P < 0.05; **P < 0.01 by double-sided Student’s t test.
Figure 4.
Figure 4.
Muscle Pi concentration and VATP are positively correlated. Shown is a regression analysis of muscle Pi and VATP obtained in WT mice, NaPi2a−/− mice, and NaPi2a−/− mice after continuous Pi infusion (A), in the LPD model before and after Pi infusion (B), and in the patient with hypophosphatemic rickets (C). Pi infusion (Pi-Inf) in panels A, B and oral phosphate supplementation after 5 (Rx1) and 8 (Rx2) mo improves VATP in all 3 models. Shown are individual animals with regression lines for each treatment group. Pooled regression analysis of all treatment groups was significant with **P < 0.01 in each panel.
Figure 5.
Figure 5.
An individual with hypophosphatemic rickets has reduced VATP. A) Serum Pi was measured before and again after restoration of hypophosphatemia after a total of 8 mo (Rx2) oral phosphate supplementation with 500 mg KPhos MF 3 times/d, which comprised a total daily dose of 1500 mg. B) VATP was measured before, after 5 mo (Rx1), and again after a total of 8 mo (Rx2) treatment. The patient had reduced VATP measured by ST-[31P]MRS before treatment compared with 5 healthy controls, but VATP was restored after 8 mo treatment. All data are means ± sem; n = 5 in the control group. *P < 0.01 by double-sided Student’s t test.

References

    1. Berndt T., Kumar R. (2007) Phosphatonins and the regulation of phosphate homeostasis. Annu. Rev. Physiol. 69, 341–359 - PubMed
    1. Kuro-o M. (2010) A potential link between phosphate and aging--lessons from Klotho-deficient mice. Mech. Ageing Dev. 131, 270–275 - PMC - PubMed
    1. Amanzadeh J., Reilly R. F. Jr (2006) Hypophosphatemia: an evidence-based approach to its clinical consequences and management. Nat. Clin. Pract. Nephrol. 2, 136–148 - PubMed
    1. Camp M. A., Allon M. (1990) Severe hypophosphatemia in hospitalized patients. Miner. Electrolyte Metab. 16, 365–368 - PubMed
    1. Veilleux L. N., Cheung M., Ben Amor M., Rauch F. (2012) Abnormalities in muscle density and muscle function in hypophosphatemic rickets. J. Clin. Endocrinol. Metab. 97, E1492–E1498 - PubMed

Publication types