. 2016 Jun 24:6:28139.
doi: 10.1038/srep28139.

The anti-angiogenic effect and novel mechanisms of action of Combretastatin A-4

Affiliations

The anti-angiogenic effect and novel mechanisms of action of Combretastatin A-4

Min Su et al. Sci Rep. .

Abstract

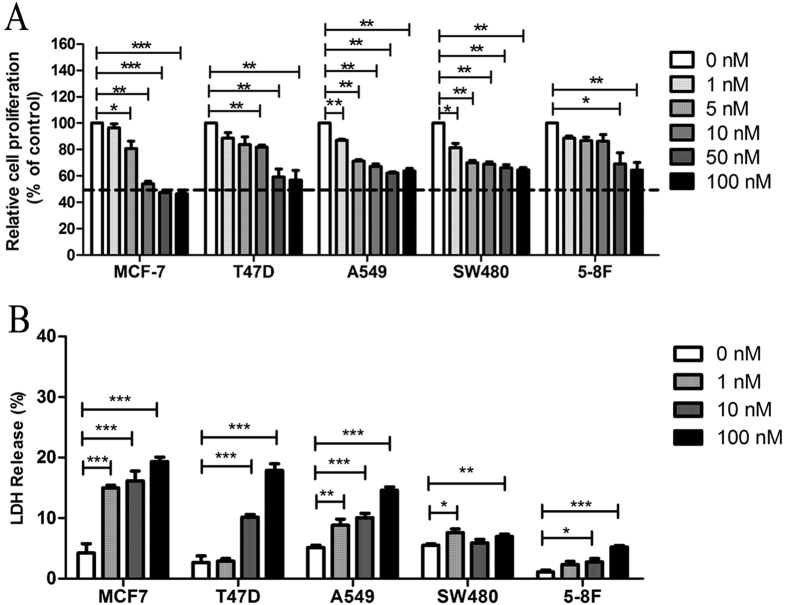
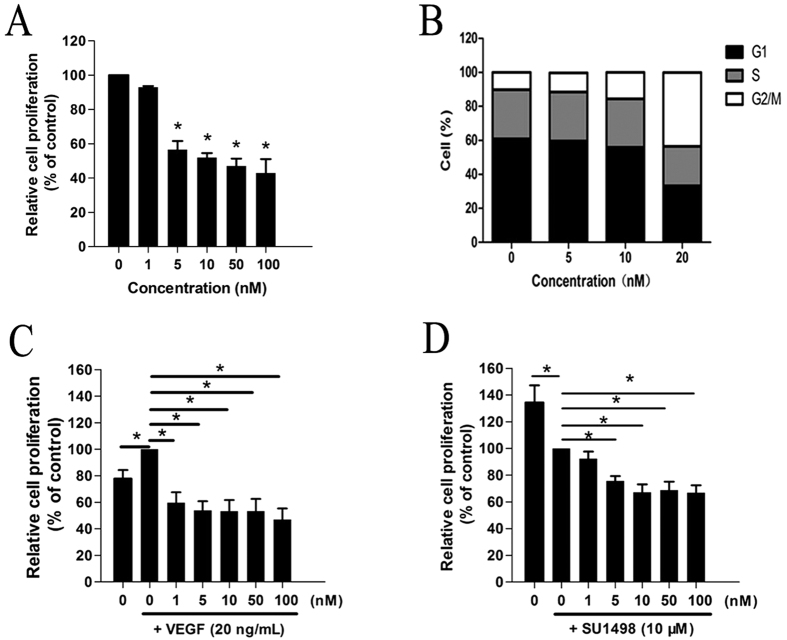
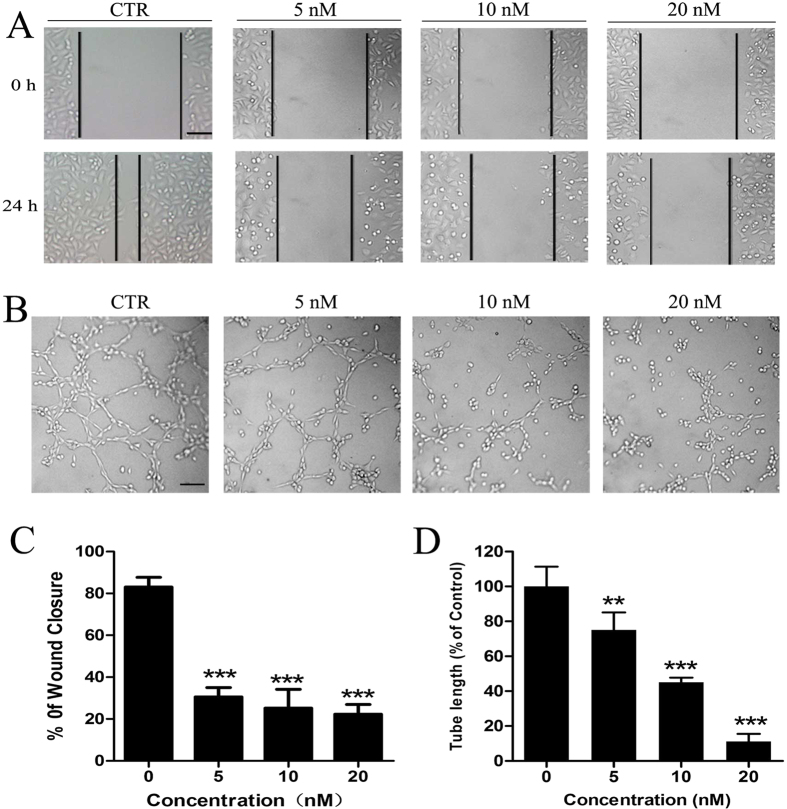
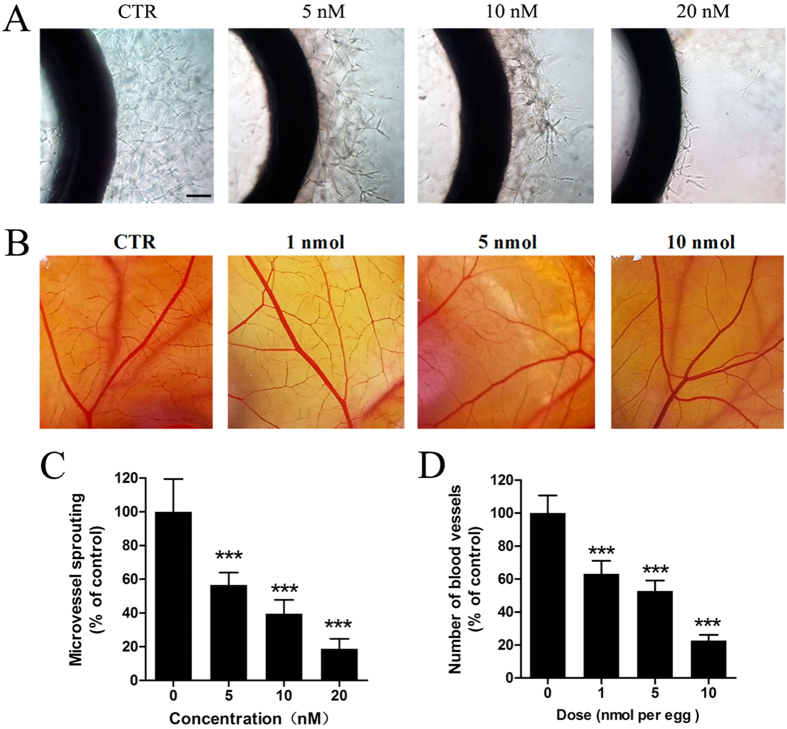
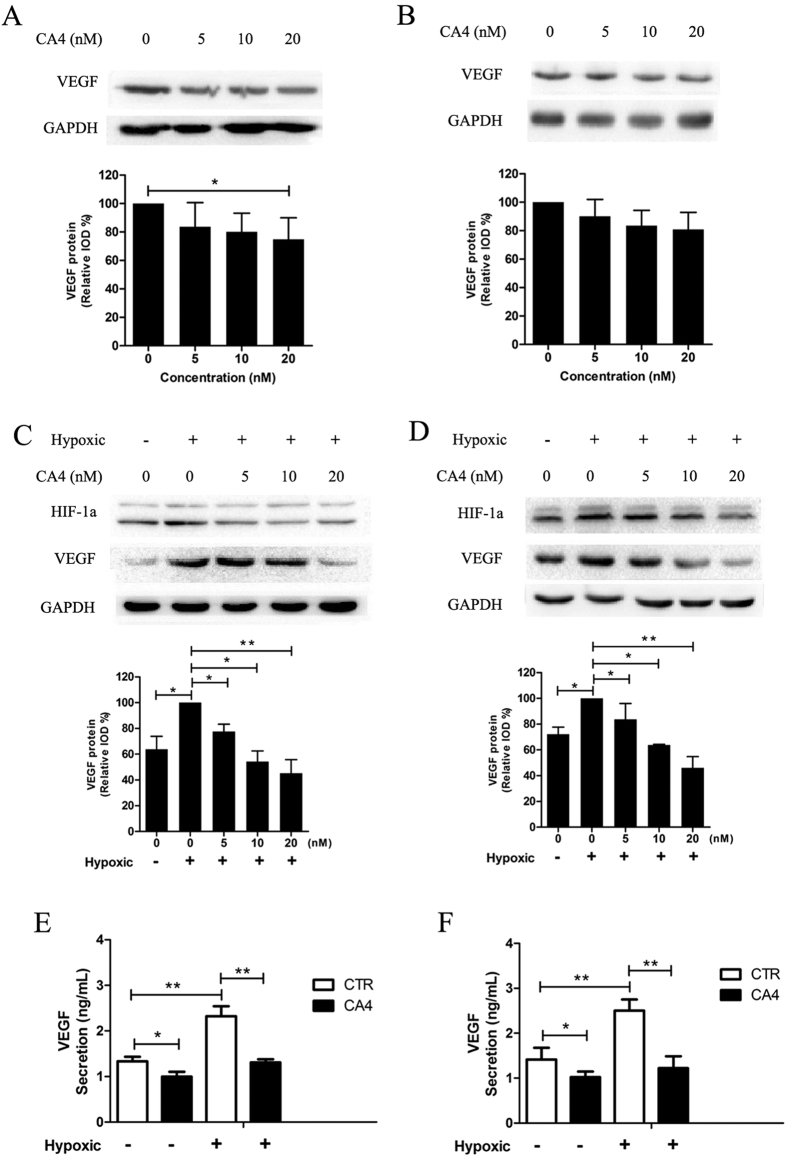
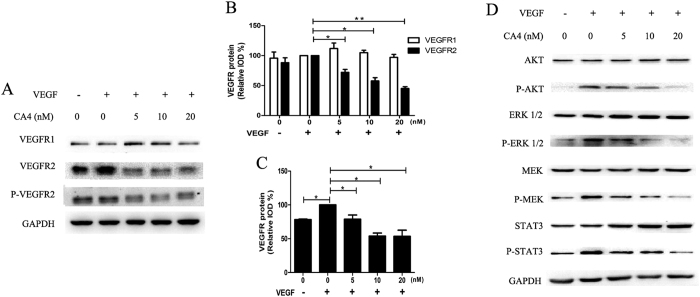
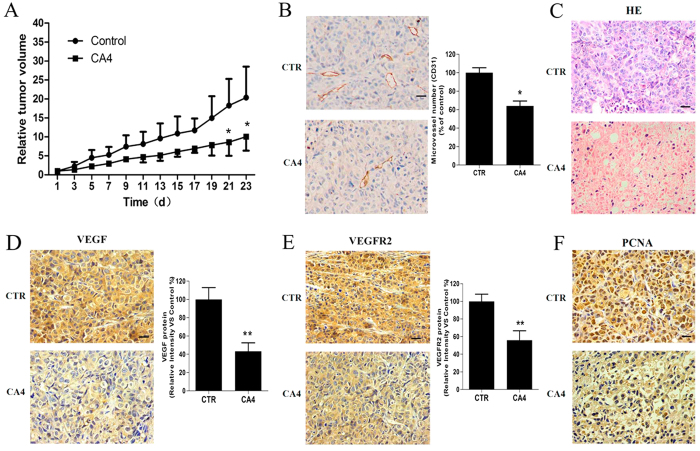
Combretastatin A-4 (CA4) is the lead compound of a relatively new class of vascular disrupting agents that target existing tumor blood vessels. Recent studies showed the CA4 might inhibit angiogenesis. However, the underlying molecular mechanisms by which CA4 exerts its anti-angiogenic effects are not fully understood. In this study, we revealed that CA4 inhibited vascular endothelial growth factor (VEGF)-induced proliferation, migration and capillary-like tube formation of human umbilical vascular endothelial cells (HUVECs). In in vivo assay, CA4 suppressed neovascularization in chicken chorioallantoic membrane (CAM) model and decreased the microvessel density in tumor tissues of a breast cancer MCF-7 xenograft mouse model. In addition, CA4 decreased the expression level and secretion of VEGF both in MCF-7 cells and HUVECs under hypoxia, as well as the activation of VEGFR-2 and its downstream signaling mediators following VEGF stimulation in HUVECs. Moreover, VEGF and VEGFR-2 expression in tumor tissues of the mouse xenograft model were down-regulated following CA4 treatment. Taken together, results from the current work provide clear evidence that CA4 functions in endothelial cell system to inhibit angiogenesis, at least in part, by attenuating VEGF/VEGFR-2 signaling pathway.


Figures

Figure 1
Figure 1. CA4 inhibited proliferation and induced cytotoxicity in human cancer cells.
Human cancer cells proliferation was determined by MTT assay after being treated with CA4 for 48 h (A). Cytotoxicity of CA4 in human cancer cells was determined by LDH assay after being treated with CA4 fro 48 h (B). All data were represented as means ± SD, n = 3, *P < 0.05 versus control, **P < 0.01 versus control, ***P < 0.001 versus control.
Figure 2
Figure 2. CA4 inhibited proliferation of human endothelial cells.
Cell proliferation was determined by MTT assay after being treated with CA4 for 48 h (A). Analysis of cell cycle in HUVECs after being treated with CA4 for 24 h (B). Cell proliferation was determined by MTT assay after being treated with CA4 for 48 h in the presence of VEGF (20 ng/mL) (C). Cell proliferation was determined by MTT assay after being treated with CA4 for 48 h in the presence of SUl498 (10 μM) (D). All data were represented as means ± SD, n = 3, *P < 0.05 versus control, **P < 0.01 versus control, ***P < 0.001 versus control.
Figure 3
Figure 3. CA4 inhibited angiogenesis in vitro.
Representative images of scratch wound-healing migration in HUVECs treated with CA4 for 24 h under VEGF stimulation (10×, bar = 20 μm) (A). Representative images of tube formation after being treated with CA4 for 2 h following VEGF stimulation (10×, bar = 20 μm) (B). Quantitative data of scratch wound-healing migration in HUVECs treated with CA4 for 24 h under VEGF stimulation (C). Quantitative data of tube formation after treated with CA4 for 2 h following VEGF stimulation (D). All data were represented as means ± SD, n = 3, *P < 0.05 versus control, **P < 0.01 versus control, ***P < 0.001 versus control.
Figure 4
Figure 4. CA4 inhibited angiogenesis ex vivo and in vivo.
Representative images of rat aorta sections after vehicle or CA4 treated for 6 d (10×, bar = 20 μm) (A). Representative images of chick embryonic CAM after treated with CA4 for 48 h (B). Quantitative data of rat aorta sections after treated with CA4 for 6 d (C). Quantitative data of chick embryonic CAM after treated with CA4 for 48 h (D). All data were represented as means ± SD, n = 5, *P < 0.05 versus control, **P < 0.01 versus control, ***P < 0.001 versus control.
Figure 5
Figure 5. CA4 suppressed VEGF expression.
A representative result (up) and histogram (down) of Western blot presents the levels of VEGF in MCF-7 cells (A) and HUVECs (B) treated with CA4 for 24 h at normoxia. A representative result (up) and histogram (down) of Western blot presents the levels of VEGF in MCF-7 cells (C) and HUVECs (D) treated with CA4 for 12 h at normoxia and then subjected to an additional 12 h of hypoxia. Secretion of VEGF in culture medium measured by ELISA in MCF-7 cells (E) and HUVECs (F) treated with CA4 (10 nM) at normoxia for 24 h or at normoxia for 12 h and then subjected to an additional 12 h of hypoxia. All data were represented as means ± SD, n = 3, *P < 0.05 versus control, **P < 0.01 versus control, ***P < 0.001 versus control.
Figure 6
Figure 6. CA4 suppressed VEGFR-2 signaling in HUVECs.
A representative Western blot shows the levels of VEGFR1, VEGFR-2 and p-VEGFR-2 in HUVECs treated with CA4 for 24 h following VEGF stimulation (A). Histogram of relative VEGFR1 and VEGFR-2 expression levels in HUVECs as determined by western blot analysis (B). Histogram of relative p-VEGFR-2 expression levels in HUVECs as determined by western blot analysis (C). A representative Western blot shows the levels of total and phosphorylated AKT, ERK, MEK, Stat3 in HUVECs treated with CA4 for 24 h following VEGF stimulation (D). All data were represented as means ± SD, n = 3, *P < 0.05 versus control, **P < 0.01 versus control, ***P < 0.001 versus control.
Figure 7
Figure 7. CA4 inhibited tumor growth and neoangiogenesis in MCF-7 breast cancer xenografts model.
Tumor volume of animals treated with 15 mg/kg CA4 or vehicle as control daily for 23 d (A). (left) Representative image of tumor section stained with CD31; (right) Histogram of microvessel number in tumor sections (B). Representative image of hematoxylin–eosin (HE) staining of tumor tissue sections (C). (left) Representative image of tumor section stained with VEGF; (right) Histogram of VEGF expression levels in tumor sections (D). (left) Representative image of tumor section stained with VAGFR2; (right) Histogram of VEGF expression levels in tumor section (E). Representative image of tumor section stained with PCNA (F). Images were all 40×, bar = 20 μm. All data were represented as means ± SD, n = 5, *P < 0.05 versus control, **P < 0.01 versus control.

References

    1. Folkman J. Seminars in Medicine of the Beth Israel Hospital, Boston. Clinical applications of research on angiogenesis. N Engl J Med 333, 1757–1763, 10.1056/NEJM199512283332608 (1995). - DOI - PubMed
    1. Andre T. et al.. [Tumoral angiogenesis: physiopathology, prognostic value and therapeutic perspectives]. Rev Med Interne 19, 904–913, S0248866399800630 (1998). - PubMed
    1. Granci V., Dupertuis Y. M. & Pichard C. Angiogenesis as a potential target of pharmaconutrients in cancer therapy. Curr Opin Clin Nutr Metab Care 13, 417–422, 10.1097/MCO.0b013e3283392656 (2010). - DOI - PubMed
    1. Risau W. Mechanisms of angiogenesis. Nature 386, 671–674, 10.1038/386671a0 (1997). - DOI - PubMed
    1. Roskoski R. Jr. Vascular endothelial growth factor (VEGF) signaling in tumor progression. Crit Rev Oncol Hematol 62, 179–213, 10.1016/j.critrevonc.2007.01.006 (2007). - DOI - PubMed

Publication types

MeSH terms