

A Predictive Metabolic Signature for the Transition From Gestational Diabetes Mellitus to Type 2 Diabetes
- PMID: 27338739
- PMCID: PMC5001181
- DOI: 10.2337/db15-1720
A Predictive Metabolic Signature for the Transition From Gestational Diabetes Mellitus to Type 2 Diabetes
Abstract
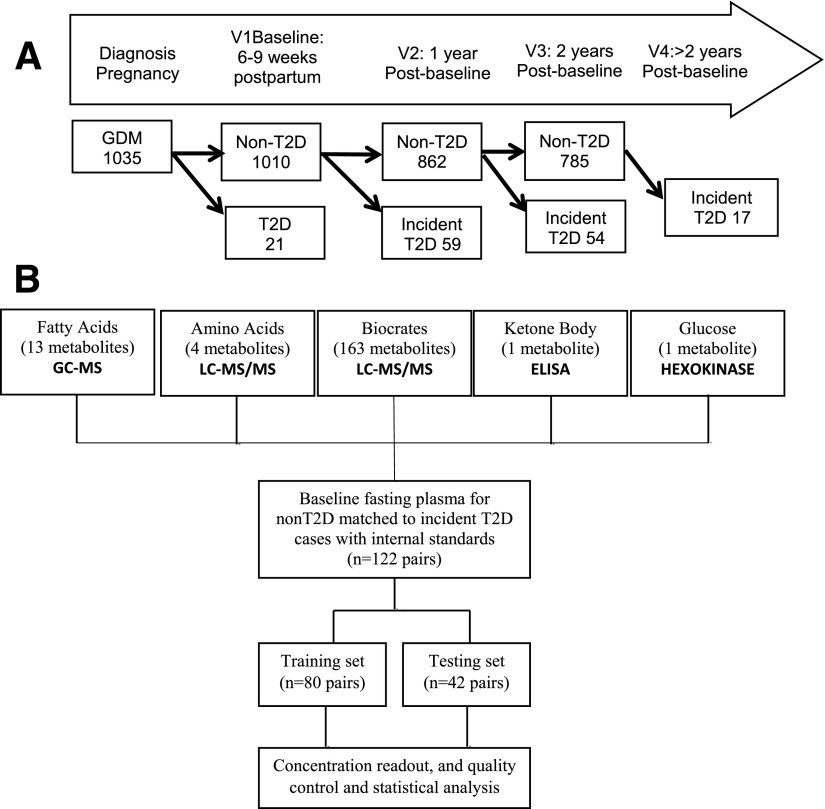
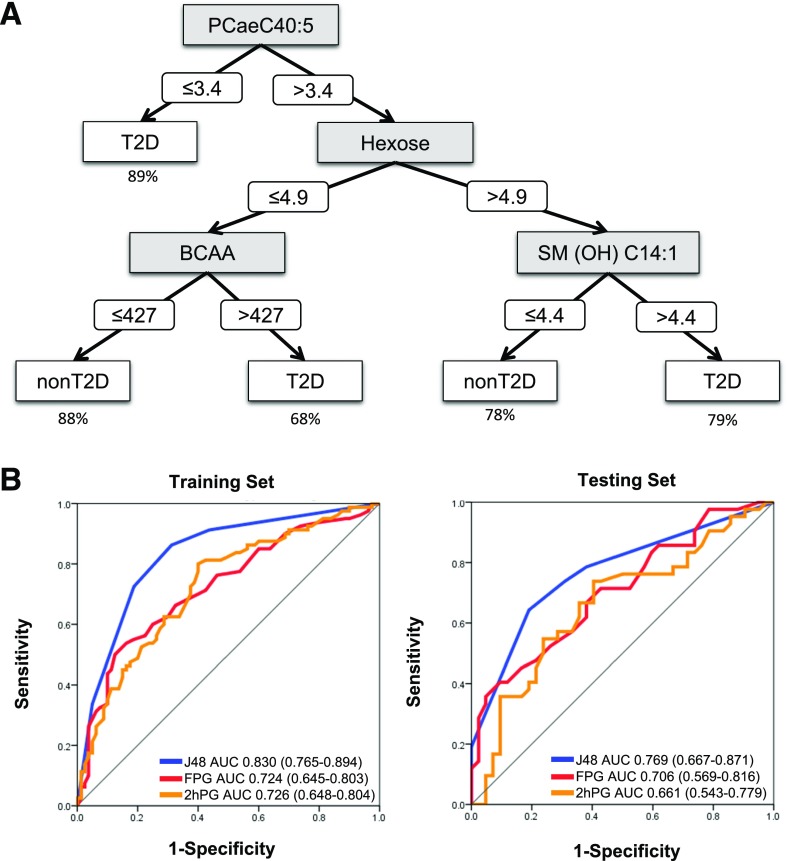
Gestational diabetes mellitus (GDM) affects 3-14% of pregnancies, with 20-50% of these women progressing to type 2 diabetes (T2D) within 5 years. This study sought to develop a metabolomics signature to predict the transition from GDM to T2D. A prospective cohort of 1,035 women with GDM pregnancy were enrolled at 6-9 weeks postpartum (baseline) and were screened for T2D annually for 2 years. Of 1,010 women without T2D at baseline, 113 progressed to T2D within 2 years. T2D developed in another 17 women between 2 and 4 years. A nested case-control design used 122 incident case patients matched to non-case patients by age, prepregnancy BMI, and race/ethnicity. We conducted metabolomics with baseline fasting plasma and identified 21 metabolites that significantly differed by incident T2D status. Machine learning optimization resulted in a decision tree modeling that predicted T2D incidence with a discriminative power of 83.0% in the training set and 76.9% in an independent testing set, which is far superior to measuring fasting plasma glucose levels alone. The American Diabetes Association recommends T2D screening in the early postpartum period via oral glucose tolerance testing after GDM, which is a time-consuming and inconvenient procedure. Our metabolomics signature predicted T2D incidence from a single fasting blood sample. This study represents the first metabolomics study of the transition from GDM to T2D validated in an independent testing set, facilitating early interventions.
© 2016 by the American Diabetes Association.
Figures
Comment in
-
Diabetes: A metabolomic signature to predict the transition from GDM to T2DM.Nat Rev Endocrinol. 2016 Sep;12(9):498. doi: 10.1038/nrendo.2016.115. Epub 2016 Jul 8. Nat Rev Endocrinol. 2016. PMID: 27388989 No abstract available.
References
-
- Kim C, Newton KM, Knopp RH. Gestational diabetes and the incidence of type 2 diabetes: a systematic review. Diabetes Care 2002;25:1862–1868 - PubMed
-
- Ferrara A. Increasing prevalence of gestational diabetes mellitus: a public health perspective. Diabetes Care 2007;30(Suppl. 2):S141–S146 - PubMed
-
- American Diabetes Association Standards of medical care in diabetes—2014. Diabetes Care 2014;37(Suppl. 1):S14–S80 - PubMed
-
- Shah BR, Lipscombe LL, Feig DS, Lowe JM. Missed opportunities for type 2 diabetes testing following gestational diabetes: a population-based cohort study. BJOG 2011;118:1484–1490 - PubMed
-
- Blatt AJ, Nakamoto JM, Kaufman HW. Gaps in diabetes screening during pregnancy and postpartum. Obstet Gynecol 2011;117:61–68 - PubMed
Publication types
MeSH terms
Substances
Grants and funding
LinkOut - more resources
Full Text Sources
Other Literature Sources
Medical
