. 2016 Oct;19(4):463-86.
doi: 10.1007/s10456-016-9520-y. Epub 2016 Jun 23.

A non-canonical role for desmoglein-2 in endothelial cells: implications for neoangiogenesis

Affiliations

A non-canonical role for desmoglein-2 in endothelial cells: implications for neoangiogenesis

Lisa M Ebert et al. Angiogenesis. 2016 Oct.

Abstract

Desmogleins (DSG) are a family of cadherin adhesion proteins that were first identified in desmosomes and provide cardiomyocytes and epithelial cells with the junctional stability to tolerate mechanical stress. However, one member of this family, DSG2, is emerging as a protein with additional biological functions on a broader range of cells. Here we reveal that DSG2 is expressed by non-desmosome-forming human endothelial progenitor cells as well as their mature counterparts [endothelial cells (ECs)] in human tissue from healthy individuals and cancer patients. Analysis of normal blood and bone marrow showed that DSG2 is also expressed by CD34(+)CD45(dim) hematopoietic progenitor cells. An inability to detect other desmosomal components, i.e., DSG1, DSG3 and desmocollin (DSC)2/3, on these cells supports a solitary role for DSG2 outside of desmosomes. Functionally, we show that CD34(+)CD45(dim)DSG2(+) progenitor cells are multi-potent and pro-angiogenic in vitro. Using a 'knockout-first' approach, we generated a Dsg2 loss-of-function strain of mice (Dsg2 (lo/lo)) and observed that, in response to reduced levels of Dsg2: (i) CD31(+) ECs in the pancreas are hypertrophic and exhibit altered morphology, (ii) bone marrow-derived endothelial colony formation is impaired, (iii) ex vivo vascular sprouting from aortic rings is reduced, and (iv) vessel formation in vitro and in vivo is attenuated. Finally, knockdown of DSG2 in a human bone marrow EC line reveals a reduction in an in vitro angiogenesis assay as well as relocalisation of actin and VE-cadherin away from the cell junctions, reduced cell-cell adhesion and increased invasive properties by these cells. In summary, we have identified DSG2 expression in distinct progenitor cell subpopulations and show that, independent from its classical function as a component of desmosomes, this cadherin also plays a critical role in the vasculature.

Keywords: DESMOGLEIN-2; Endothelial progenitor cells; Endothelium; Hematopoietic stem and progenitor cells; Mouse models of neoangiogenesis.


Conflict of interest statement

The authors indicate no potential conflicts of interest.

Figures
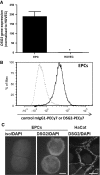
Fig. 1
Fig. 1
DSG2 expression by human naEFCs (EPCs). In a, DSG2 mRNA expression in UCB-derived CD133+ human naEFCs and HUVECs was determined by qPCR and expression values are shown as mean ± SEM, n = 3–4, * p < 0.05. In b, evaluation by flow cytometry of DSG2 protein expression (solid line) on EPCs. Dotted line shows isotype control. c Immunofluorescence evaluation of DSG2 protein expression on EPCs (middle, scale bar is 5 μm) and HaCat cells (right, scale bar is 20 μm). Isotype control (iso) staining on EPCs (left). EPC stainings in bc are representative of results from ≥3 independent EPC donors
Fig. 2
Fig. 2
Unique expression of DSG2, but not other desmosome components, on circulating progenitor cells including EPCs. In a, lineage-depleted peripheral blood was analysed by flow cytometry for co-expression of DSG2 and VEGFR2. The gating strategy involved initial selection of cells based on physical parameters (FSC/SSC; left), followed by gating of the CD34+ CD45dim progenitor population (centre), within which staining for DSG2 in combination with either control IgG (FMO [fluorescence-minus-one] control) or anti-VEGFR2 was determined. Results are representative of 4 donors. In b, the proportion of DSG2+ cells was compared for peripheral and umbilical cord blood samples, gating on CD34+ CD45dim progenitor cells as shown above. c UCB samples were analysed by flow cytometry for expression of the indicated desmosomal cadherins, gating on CD34+CD45dim progenitor cells, in comparison with isotype control. Results are representative of 3 donors
Fig. 3
Fig. 3
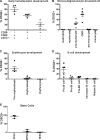
Unique expression of DSG2 on immature hematopoietic progenitor cells from human BM. Samples of normal human BM were subject to erythrocyte lysis and stained for flow cytometric analysis. In a, the expression of DSG2 in early hematopoietic progenitor cell development was examined in CD34+CD45dim progenitors by further gating on CD38−CD90+, CD38+CD90−CD117+ and CD38+CD90−CD117− subsets. In b, the expression of DSG2 in myeloid development was examined by gating on neutrophils (CD11b+CD13+CD33+CD16+CD117−); myelocytes (CD11b+CD13+CD33+CD16−CD117−); pro-myelocytes (CD34−CD117+CD45dimCD33+CD13+); CMP (common myeloid progenitors: CD34+CD117+CD45dimCD33+CD13+); pro-monocytes (CD11b+CD13+CD45dimCD14−) and mature monocytes (CD11b+CD13+CD33hiCD45brightCD14+). In c, the expression of DSG2 in erythrocyte development was examined by gating on pro-erythroblasts (CD34+CD45dimCD117+CD71+CD235a−); erythroblasts (CD34−CD45−CD117−CD71+CD235a+) and erythrocytes (CD34−CD45−CD117−CD71−CD235a+). In d, the expression of DSG2 in B cell development was examined by gating on pro-B cells (CD34+CD45dimCD22+CD19−CD10−CD20−); pre-BI cells (CD34+CD45dimCD22+CD19+CD10+CD20−); pre-BII cells (CD34−CD45dimCD22+CD19+CD10+CD20±); immature B cells (CD34−CD45brightCD22+CD19+CD10+CD20bright) and mature B cells (CD34−CD45brightCD22+CD19+CD10−CD20bright). In e, expression of DSG2 on iPS cells but not DPSC and MSCs was identified. Dots represent individual biological replicates, except for MSCs wherein a cell line was repeatedly tested
Fig. 4
Fig. 4
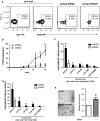
Enrichment of DSG2+ progenitor cells demonstrate a pro-proliferative and multi-potential nature. In a, samples of UCB were sorted for DSG2+ and DSG2− subsets. Pre-sorted CD34+CD45dim-gated cells were stained for IgG control (far left panel) and DSG2 (middle left panel), and compared to the DSG2 staining amongst post-sort DSG2+ (middle right panel) and DSG2− (far right panel) cells. In b, DSG2+ and DSG2− cell expansion was calculated over 15 days. Results are mean ± SEM, n = 3 donors, *p < 0.05. In c, expanded UCB-derived DSG2+ and DSG2− cells and in d, freshly sorted BM-derived DSG2+ and DSG2− cells were seeded for colony formation. Cells formed blast-forming unit-erythroid (BFU-E), colony-forming units (CFU)-GEMM, -GM, -G and -M colonies. Results are mean ± SEM, n = 3–4 donors, *p < 0.05 compared to DSG2− cells. In e, a representative image of the Matrigel angiogenesis assay performed with HUVEC alone (upper image) or HUVEC co-cultured with DSG2+ sorted and expanded UCB cells (lower image) in vitro. Relative tube-like structure numbers formed in each condition from 3 independent experiments are quantified on the right as mean ± SEM, *p < 0.05 versus HUVEC alone. Scale bar is 20 μm
Fig. 5
Fig. 5
Mature ECs display heterogeneous expression of DSG2. In a, representative IHC images of human cervical tissue with positive brown staining for DSG2 (centre panel) wherein an arteriole (arrow head) and a venule (arrow) are shown. The same tissue area is also shown stained separately with H&E, allowing visualisation of vessel architecture (right panel). Isotype control staining of cervical tissue (left panel). Scale bar is 0.2 mm. In b, representative immunofluorescence images of human cervical tissue with DSG2 (red), CD31 (green) and DAPI (blue) illustrate a DSG2+ vessel (top left and middle) and a DSG2 vessel (bottom left and middle). Staining controls on the right show the same cervical tissue with relevant isotype controls (top right; negative control) and cervical epithelium (bottom right; positive control). Scale bar is 30 μm. In c, gene expression values (EV) of Dsg13 and Dsc13 mined from GEO dataset GSE58056. Each symbol represents an individual biological replicate from capillary or high endothelial venules (HEV); small horizontal lines indicate the mean, *p < 0.05 versus capillary. (Color figure online)
Fig. 6
Fig. 6
Disruption of intron 1 of Dsg2 results in a hypomorphic DSG2 allele. In a, a lacZ/neomycin cassette was incorporated into intron 1 of mouse Dsg2 by targeted insertion. b The resulting Dsg2-LacZ-neomycin allele exhibited reduced Dsg2 expression in the mouse hearts of WT, Dsg2 +/lo and Dsg2 lo/lo mice by quantitative PCR (qPCR). Results are mean ± SEM, n = 3, *p < 0.05 versus WT. In c, morphological comparison of hearts from WT, DSG2+/lo and Dsg2 lo/lo mice with arrows identifying fibrotic lesions. Scale bar is 3 mm. In d, dissected hearts stained with hematoxylin/eosin and an arrow identifying fibrotic lesions. Scale bar is 0.5 mm
Fig. 7
Fig. 7
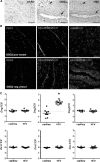
Dsg2 lo/lo mice exhibit altered EC morphology. In a, a representative image of blood (CD31, green) and lymphatic (LYVE-1, blue) vessels in mid-ear sections of WT and Dsg2 lo/lo adult mice with αSMA shown in the merged image (red). In b, representative fluorescence images of CD31+ ECs (yellow) in pancreatic sections of control (WT) and Dsg2 lo/lo mice, with DAPI nuclei staining (blue), scale bar is 50 μm. The graph shows analysis of EC width (measured in 6 positions per vessel) from five vessels per mouse. Results are mean ± SEM, n = 3 mice/group, *p < 0.05 versus WT. In c, representative fluorescence images of pancreatic sections of control (WT) and Dsg2 lo/lo mice, with CD31+ ECs (green), αSMA perivascular cells (red) and DAPI nuclei staining (blue). Scale bar is 0.1 mm. The graph shows analysis of vessel width (measured in 6 positions per vessel) from five vessels per mouse. Results are mean ± SEM, n = 4 mice/group. (Color figure online)
Fig. 8
Fig. 8
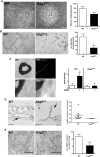
Dsg2 lo/lo mice exhibit reduced vascular development. In a, BM-derived EC colonies were generated from WT and Dsg2 lo/lo mice by culture on fibronectin plates for 6 days. Images on the left show representative colonies, while the graph on the right depicts the number of colonies per well (mean ± SEM, n = 3, *p < 0.05 versus WT, scale bar is 0.2 mm). b shows BM-derived ECs from WT and Dsg2 lo/lo mice seeded onto Matrigel. Tube-like structure formation captured by phase-contrast microscopy 4 h post-seeding. Results are mean ± SEM, n = 3, *p < 0.05 versus WT. Scale bar is 0.2 mm. In c, phase-contrast images of aortic rings embedded in Matrigel showing microvessel outgrowth in response to VEGF (top left, scale bar is 0.5 mm); CD31 staining of the vascular sprouts (top right, scale bar is 0.1 mm); and sprouts counted 5 days post embedding. Higher magnification of rings shown for WT (bottom left) and Dsg2 lo/lo (bottom right). Results are mean ± SEM, n = 3, *p < 0.05 versus no VEGF, # p < 0.05 versus WT + VEGF. In d, Matrigel plugs in WT and Dsg2 lo/lo mice were retrieved and stained with anti-CD31 (brown) and hematoxylin (lilac). Scale bar is 50 μm. The number of erythrocyte-containing vessels per mm2 was quantified. Data expressed as mean ± SEM, n = 5–10, *p < 0.05 versus WT. In e, B16 melanomas in WT and Dsg2 lo/lo mice were retrieved and stained with anti-CD31 (red) and eosin (blue). Scale bar is 100 μm. The average number of CD31+ vessels per field of view was quantified. Data expressed as mean ± SEM, n = 7, *p < 0.05 versus WT (Mann–Whitney). (Color figure online)
Fig. 9
Fig. 9
DSG2 knockdown alters BMEC function and cytoskeletal composition. In a, BMEC cells were sorted for DSG2+ and DSG2 subgroups. Results show pre-sort cells stained for control IgG (far left panel) or DSG2 (middle left panel), and compared to the DSG2 staining amongst post-sort DSG2+(far right panel) and DSG2 (middle right panel) cells. In b, the sorted DSG2+BMEC cells were subject to DSG2 knockdown using siRNA and analysed for DSG2 protein expression via flow cytometry after 72 h. Histogram shows staining with control IgG (red), or DSG2 after treatment with non-targeting control siRNA (blue) or DSG2-targeting siRNA-A (dotted black). The graph shows DSG2 expression quantified as mean fluorescence intensity (MFI). In c, representative images of the effect of DSG2 knockdown on tube-like structure formation by sorted DSG2 + BMEC cells after 6 h on Matrigel are shown on the left (scale bar is 0.2 mm), while the number of tube-like structures formed per well was quantified on the right. Data expressed as mean ± SEM, n = 6, *p < 0.05 versus control siRNA. In d, representative images of the effect of DSG2 knockdown on the localisation of actin (phalloidin, far left) and VE-cadherin (middle) and merged image (far right (phalloidin (red) and VE-cadherin (green)) are shown. Scale bar is 20 μm. In e, stratification of actin localisation via phalloidin staining of cortical or stress fibre formation for individual cells (defined by DAPI-stained nucleus) and normalized to control siRNA cells within an experiment. Data expressed as mean ± SEM, n = 3, *p < 0.05 versus control siRNA. In f, ImageJ was used to quantify the area of phalloidin staining relative to the number of nuclei per field of view and normalized to control siRNA cells within an experiment. Data expressed as mean ± SEM, n = 3, *p < 0.05 versus control siRNA. (Color figure online)
Fig. 10
Fig. 10
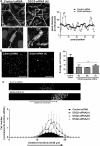
DSG2 knockdown alters BMEC cell junction formation, adhesion and invasion. In a, representative images of the effect of DSG2 knockdown on the localisation of VE-cadherin (green) with DAPI-stained nuclei (blue) are shown. Scale bar is 20 μm. Accompanying fluorescence intensities along the depicted lines depict localisation of VE-cadherin along a cell–cell junction. In b, the adhesion of fluorescently labelled BMEC cells to a confluent monolayer of unlabelled BMEC cells was determined using sorted DSG2 + BMEC cells treated with the indicated siRNA. Representative fluorescent images are shown on the left (scale bar is 0.2 mm), while the number of adherent cells per field of view was quantified on the right. Results are shown as mean ± SEM, n = 3–5, *p < 0.05 versus control siRNA. In c, BMEC treated with control or DSG2-targeting siRNA for 24 h were allowed to invade Matrigel covered Transwells in an inverse invasion assay. Scale bar is 0.4 mm. After four days of invasion, cells were stained with propridium iodide and serial optical sections (6.68-μm intervals) were acquired. Magnified images from z  =  22 sections are shown (top). Cell invasion was quantified as the number of cells over distance travelled and then normalised to peak control siRNA values for each experiment. Data show mean  ±  SEM, n = 6, p <  0.05, ANOVA. (Color figure online)

References

    1. Schafer S, Koch PJ, Franke WW. Identification of the ubiquitous human desmoglein, Dsg2, and the expression catalogue of the desmoglein subfamily of desmosomal cadherins. Exp Cell Res. 1994;211(2):391–399. doi: 10.1006/excr.1994.1103. - DOI - PubMed
    1. Schafer S, Stumpp S, Franke WW. Immunological identification and characterization of the desmosomal cadherin Dsg2 in coupled and uncoupled epithelial cells and in human tissues. Differentiation. 1996;60(2):99–108. doi: 10.1046/j.1432-0436.1996.6020099.x. - DOI - PubMed
    1. Pieperhoff S, Barth M, Rickelt S, Franke WW. Desmosomal molecules in and out of adhering junctions: normal and diseased States of epidermal, cardiac and mesenchymally derived cells. Dermatol Res Pract. 2010;2010:139167. - PMC - PubMed
    1. Brooke MA, Nitoiu D, Kelsell DP. Cell-cell connectivity: desmosomes and disease. J Pathol. 2012;226(2):158–171. doi: 10.1002/path.3027. - DOI - PubMed
    1. Pilichou K, Remme CA, Basso C, Campian ME, Rizzo S, Barnett P, Scicluna BP, Bauce B, van den Hoff MJ, de Bakker JM, Tan HL, Valente M, Nava A, Wilde AA, Moorman AF, Thiene G, Bezzina CR. Myocyte necrosis underlies progressive myocardial dystrophy in mouse dsg2-related arrhythmogenic right ventricular cardiomyopathy. J Exp Med. 2009;206(8):1787–1802. doi: 10.1084/jem.20090641. - DOI - PMC - PubMed

Publication types

MeSH terms