. 2016 Jun 24:6:28186.
doi: 10.1038/srep28186.

Screening for protein-protein interactions using Förster resonance energy transfer (FRET) and fluorescence lifetime imaging microscopy (FLIM)

Affiliations

Screening for protein-protein interactions using Förster resonance energy transfer (FRET) and fluorescence lifetime imaging microscopy (FLIM)

Anca Margineanu et al. Sci Rep. .

Erratum in

Abstract

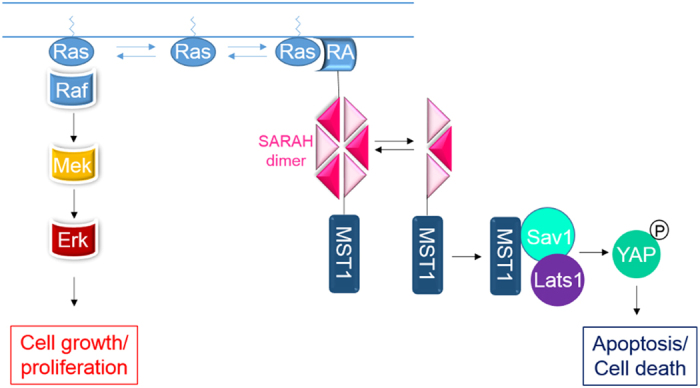
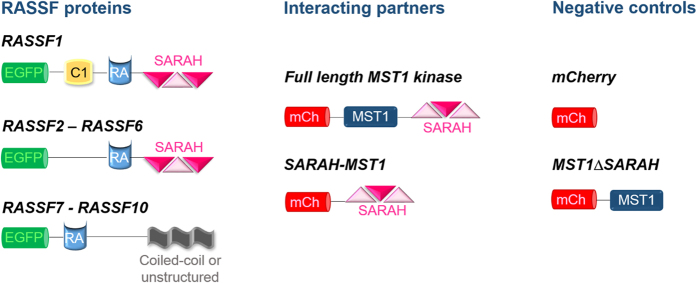
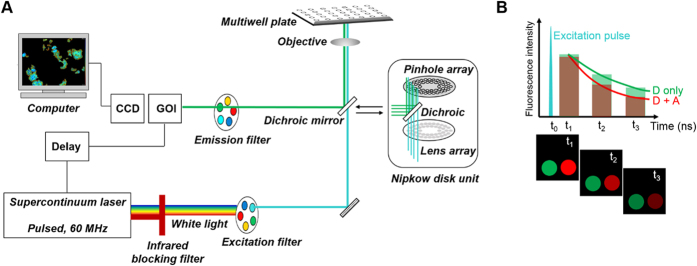
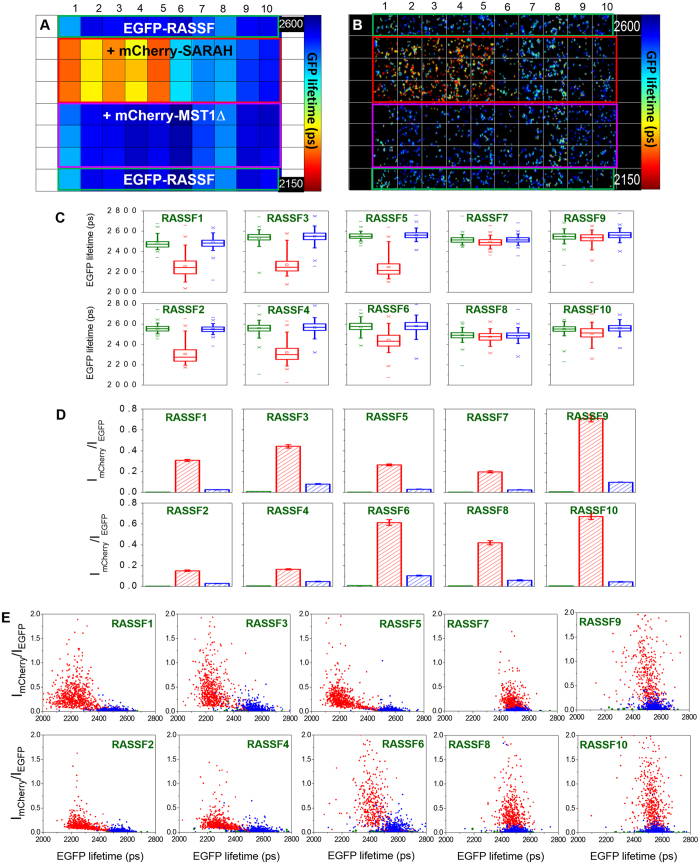
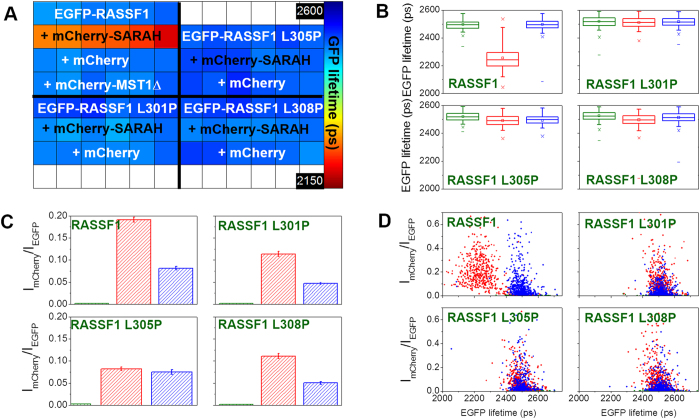
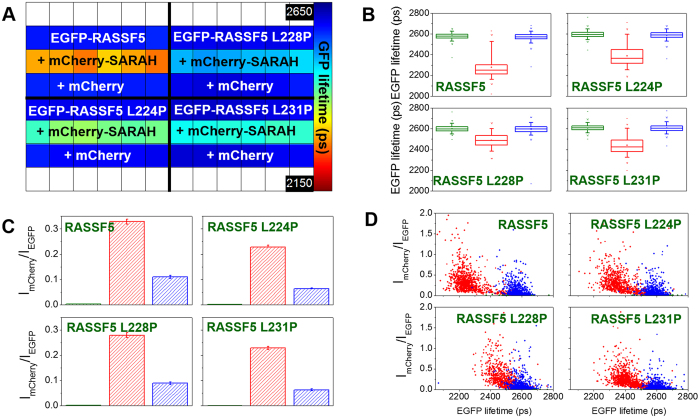
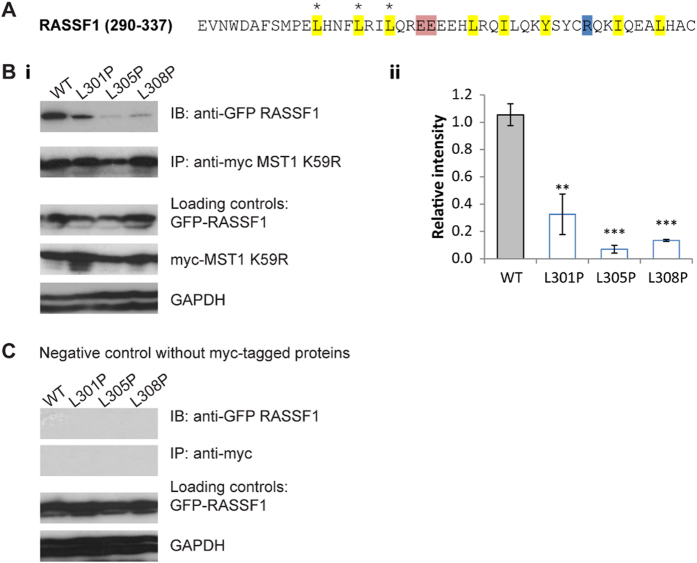
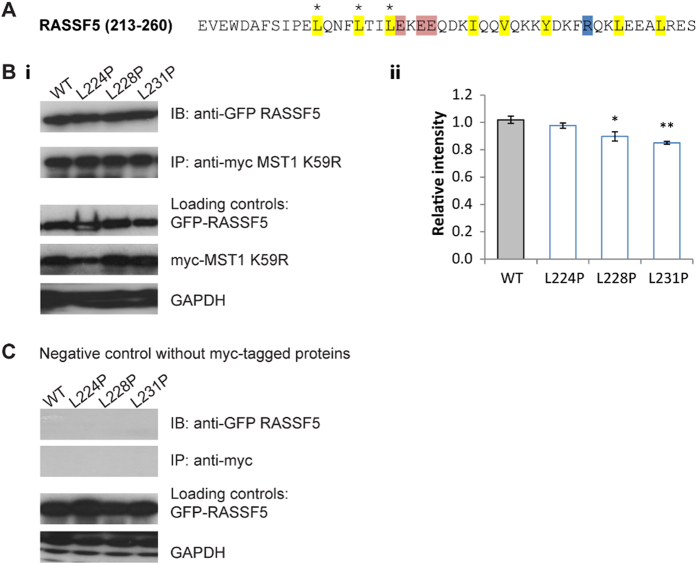
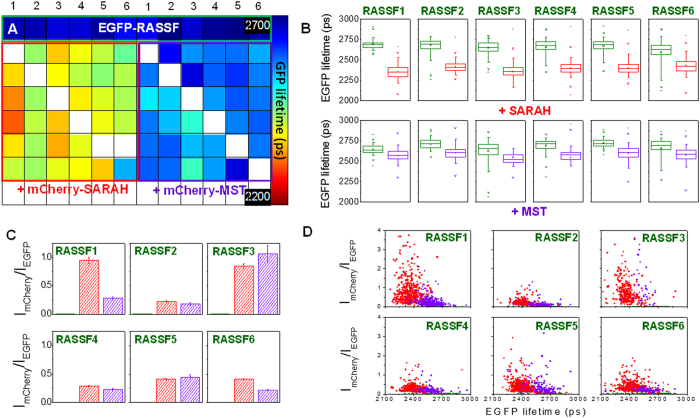
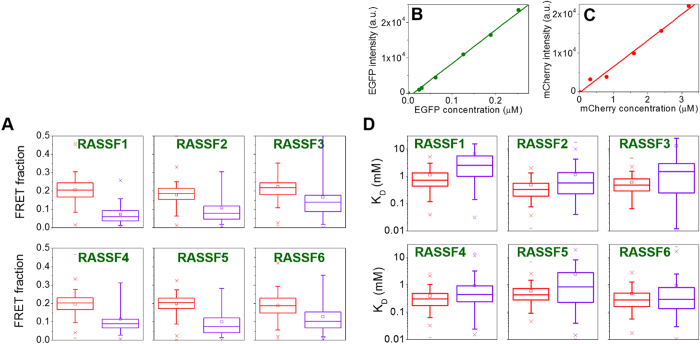
We present a high content multiwell plate cell-based assay approach to quantify protein interactions directly in cells using Förster resonance energy transfer (FRET) read out by automated fluorescence lifetime imaging (FLIM). Automated FLIM is implemented using wide-field time-gated detection, typically requiring only 10 s per field of view (FOV). Averaging over biological, thermal and shot noise with 100's to 1000's of FOV enables unbiased quantitative analysis with high statistical power. Plotting average donor lifetime vs. acceptor/donor intensity ratio clearly identifies protein interactions and fitting to double exponential donor decay models provides estimates of interacting population fractions that, with calibrated donor and acceptor fluorescence intensities, can yield dissociation constants. We demonstrate the application to identify binding partners of MST1 kinase and estimate interaction strength among the members of the RASSF protein family, which have important roles in apoptosis via the Hippo signalling pathway. KD values broadly agree with published biochemical measurements.


Figures

Figure 1
Figure 1. Schematic of Ras-dependent pathways determining cell fate.
Figure 2
Figure 2. Schematic representation of the fluorescent constructs used for the FRET assays.
The domain structure of the RASSF family members, of their possible interacting partners (MST1 kinase and its isolated SARAHMST1 domain) and of the negative controls are shown.
Figure 3
Figure 3. Schematic of automated plate reader based on time-gated fluorescence lifetime imaging (FLIM).
(A) The pulsed excitation light is selected with an appropriate filter from the “white light” emitted by an ultrafast supercontinuum laser source and enters the microscope either in a wide-field configuration or via a Nipkow disk unit to provide optical sectioning. The fluorescence is detected via a gated optical intensifier (GOI) that acts as a fast (~100 ps rise time) electronic shutter synchronised with the laser pulses. The GOI opens at various delays after excitation (e.g. t1, t2, t3) and intensity images are acquired with a CCD camera at each time delay, integrating for a few seconds. (B) Lifetime determination. The time-gated images (t1, t2, t3) are used to reconstruct the fluorescence decay of the fluorophore, which is analysed by fitting exponential decay functions, discriminating between the lifetime of the donor only (D only) and the lifetime of the donor undergoing FRET in the presence of the acceptor (D + A).
Figure 4
Figure 4. Comparison of the RASSF family members in terms of dimerisation with the SARAHMST1 domain using FRET.
(A) Plate map showing average EGFP donor lifetimes (ps) calculated for 10 fields of view (FOV) per well using a monoexponential fit. (B) False-colour FLIM images of cells from a typical FOV in each well showing the EGFP lifetime (ps) per pixel. (C) Box plots showing median EGFP lifetimes, interquartile (box range), standard deviation (whisker), 1% and 99% percentile (×) and minimum/maximum values (−) calculated for individual cells averaged over 10 FOV per well using monoexponential analysis: green: EGFP-RASSF(1–10) only; red: EGFP-RASSF(1–10) + mCherry-SARAHMST1; blue: EGFP-RASSF(1–10) + mCherry-MST1ΔSARAH (see Supplementary material for a table of differences in mean fluorescence lifetime). (D) Acceptor/donor intensity ratios (ImCherry/IEGFP) averaged over each cell for all the conditions in the plate. The colour code is the same as in C). (E) Scattered plots of EGFP lifetimes versus acceptor/donor intensity ratios (ImCherry/IEGFP) calculated for individual cells (with same colour code as for C). FLIM data were acquired with wide-field imaging.
Figure 5
Figure 5. Effect of three different point mutations within the SARAH domain of RASSF1 on the dimerisation with the isolated SARAHMST1.
(A) Plate map showing the average EGFP lifetimes calculated for 10 fields of view per well when fitting to a monoexponential decay profile. The wild-type EGFP-RASSF1 assay shows that mCherry alone can serve as a negative control as well as the mCherry-MST1ΔSARAH. (B) Box plots showing median EGFP lifetimes, interquartile (box range), standard deviation (whisker), 1% and 99% percentile (×) and minimum/maximum values (−) for segmented cells in different conditions within the plate: green: EGFP-RASSF1 (wild type and mutants) only; red: EGFP-RASSF1 (wild type and mutants) + mCherry-SARAHMST1; blue: EGFP-RASSF1 (wild type and mutants) + mCherry (see Supplementary material for a table of differences in mean fluorescence lifetime). (C) Average acceptor/donor intensity ratios (ImCherry/IEGFP) for the segmented cells in different conditions within the plate (same colour code as in B). (D) 2D plots of acceptor/donor intensity ratios versus EGFP lifetimes for the segmented cells in different conditions within the plate (same colour code as in B). FLIM data were acquired with wide-field imaging.
Figure 6
Figure 6. The effect of three different point mutations within the SARAH domain of RASSF5C on the dimerisation with the isolated SARAHMST1.
(A) Plate map showing the average EGFP lifetimes calculated for 10 fields of view per well fitted to a monoexponential decay model. (B) Box plots showing median EGFP lifetimes, interquartile (box range), standard deviation (whisker), 1% and 99% percentile (×) and minimum/maximum values (−) for the segmented cells in different conditions within the plate: green: EGFP-RASSF5C (wild type and mutants) only; red: EGFP-RASSF5C (wild type and mutants) + mCherry-SARAHMST1; blue: EGFP-RASSF5C (wild type and mutants) + mCherry (see Supplementary material for a table of differences in mean fluorescence lifetime). (C) Average intensity ratios acceptor/donor (ImCherry/IEGFP) for the segmented cells in different conditions within the plate (same colour code as in B). (D) 2D plots of intensity ratios acceptor/donor versus EGFP lifetimes for the segmented cells in different conditions within the plate (same colour code as in B). FLIM data were acquired with wide-field imaging.
Figure 7
Figure 7. Effects of mutations in the SARAHRASSF1 domain on dimerisation with full length MST1.
(A) The SARAH domain sequence of RASSF1. Main interacting non-polar (yellow), acidic (red) and basic (blue) residues are shown. The three positions in which mutations were introduced are marked by asterisks (*). (B) (i) Co-immunoprecipitation assay to show heterodimerisation between myc-MST1 K59R and wild-type (WT) EGFP-RASSF1 and its three mutants. The loading controls are shown below. (ii) Quantification of the bands in terms of relative intensity to the WT control (Mean ± SD. n = 3; *p < 0.05, **p < 0.01, ***p < 0.001). (C) Co-immunoprecipitation assay of the negative controls. A simultaneous negative control was performed using cell lysates containing only EGFP-RASSF1 or its mutants. The loading controls are shown below.
Figure 8
Figure 8. Effects of mutations in the SARAHRASSF5 domain on dimerization with full length MST1.
(A) The SARAH domain sequence of RASSF5. Main interacting non-polar (yellow), acidic (red) and basic (blue) residues are shown. The three positions in which mutations were introduced are marked by asterisks (*). (B) (i) Co-immunoprecipitation assay to show heterodimerisation between myc-MST1 K59R and wild-type (WT) EGFP-RASSF5 and its three mutants. The loading controls are shown below. (ii) Quantification of the bands in terms of relative intensity to the WT control (Mean ± SD. n = 3; *p < 0.05, **p < 0.01, ***p < 0.001). (C) Co-immunoprecipitation assay of the negative controls. A simultaneous negative control was performed using cell lysates containing only EGFP-RASSF5 or its mutants. The loading controls are shown below.
Figure 9
Figure 9. Comparison of the RASSF family members in terms of dimerisation with the isolated SARAHMST1 domain and the full length MST1 using FRET.
(A) Plate map showing average EGFP lifetimes (ps) calculated for 10 fields of view per well by fitting to a monoexponential decay model. (B) Box plots showing median EGFP lifetimes, interquartile (box range), standard deviation (whisker), 1% and 99% percentile (×) and minimum/maximum values (−) calculated for individual cells from 10 FOV per well; green: EGFP-RASSF(1–6) only; red: EGFP-RASSF(1–6) + mCherry-SARAHMST1; purple: EGFP-RASSF(1–6) + mCherry-MST1. (C) Average acceptor/donor intensity ratios (ImCherry/IEGFP) for all the conditions in the plate with the same colour code as in (C). (D) 2D scatter plots of acceptor/donor intensity ratios (ImCherry/IEGFP) versus EGFP lifetime calculated for individual cells with same colour code as (B). FLIM data were acquired with optical sectioning using Nipkow disc unit.
Figure 10
Figure 10. Results of global fitting of the donor fluorescence decay data underlying Fig. 9 to a double exponential decay model.
(A) FRET population fractions for RASSF1-6 interacting with SARAHMST1 (red) and full length MST1 (purple). (B,C) EGFP and mCherry calibration of intensity versus fluorophore concentration. (D) Dissociation constants (KD) for RASSF1-6 interacting with SARAHMST1 (red) and full length MST1 (purple).

References

    1. Eggeling C., Willig K. I., Sahl S. J. & Hell S. W. Lens-based fluorescence nanoscopy. Quart. Rev. Biophys. 48, 178–243 (2015). - PubMed
    1. Patterson G., Davidson M., Manley S. & Lippincott-Schwartz J. Superresolution imaging using single-molecule localization. Annu. Rev. Phys. Chem. 61, 345–367 (2010). - PMC - PubMed
    1. Zanella F., Lorens J. B. & Link W. High content screening: seeing is believing. Trends Biotechnol. 28, 237–245 (2010). - PubMed
    1. Jares-Erijman E. A. & Jovin T. M. Imaging molecular interactions in living cells by FRET microscopy. Curr. Opin. Chem. Biol. 10, 409–416 (2006). - PubMed
    1. Hoppe A., Christensen K. & Swanson J. A. Fluorescence resonance energy transfer-based stoichiometry in living cells. Biophys. J. 83, 3652–3664 (2002). - PMC - PubMed

Publication types

MeSH terms