. 2016 Jul;18(4):507-15.
doi: 10.1016/j.jmoldx.2016.02.003.

Validation and Implementation of a Custom Next-Generation Sequencing Clinical Assay for Hematologic Malignancies

Affiliations

Validation and Implementation of a Custom Next-Generation Sequencing Clinical Assay for Hematologic Malignancies

Michael J Kluk et al. J Mol Diagn. 2016 Jul.

Abstract

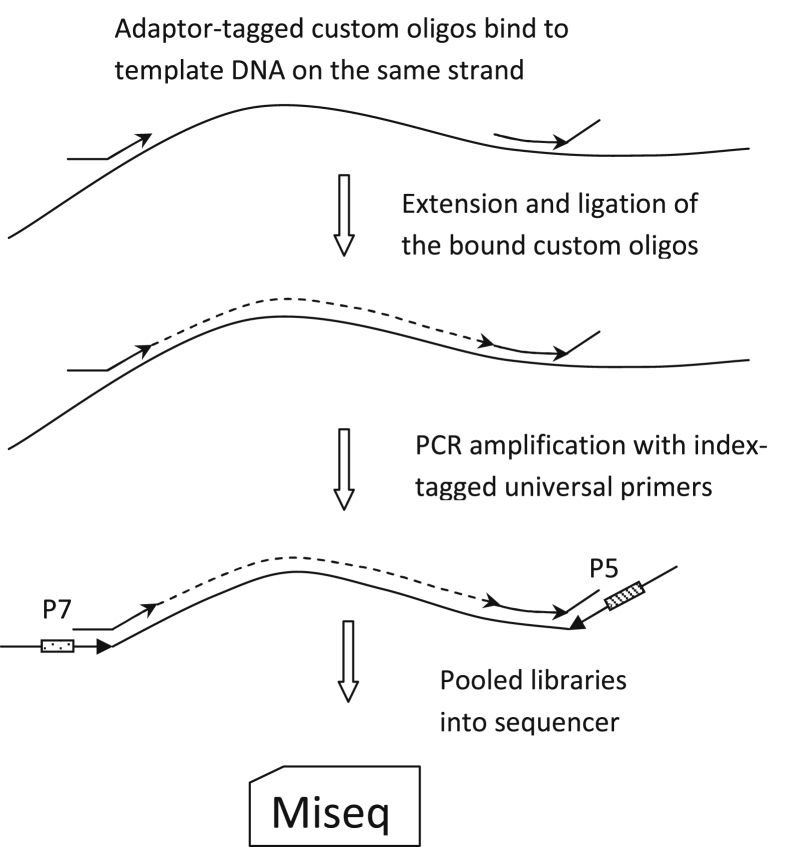
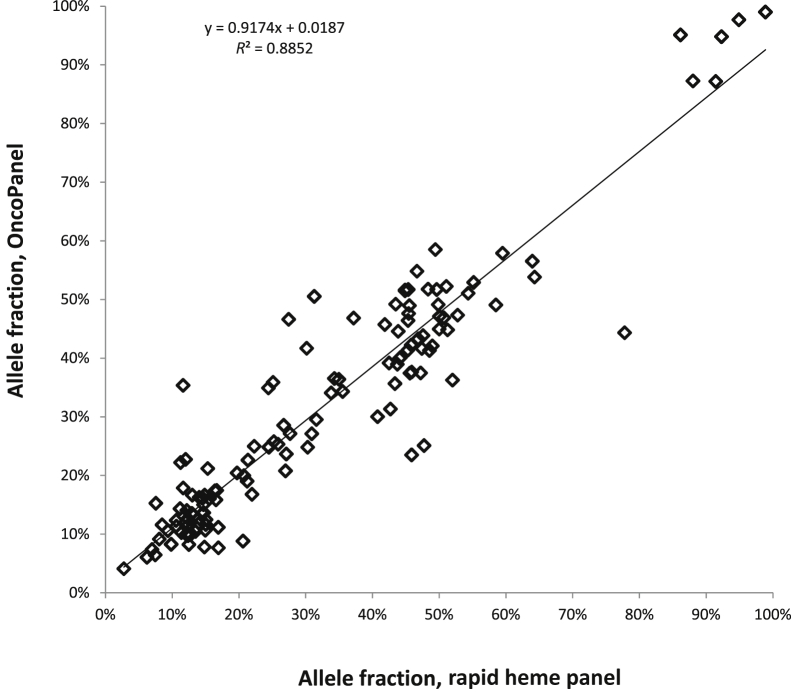
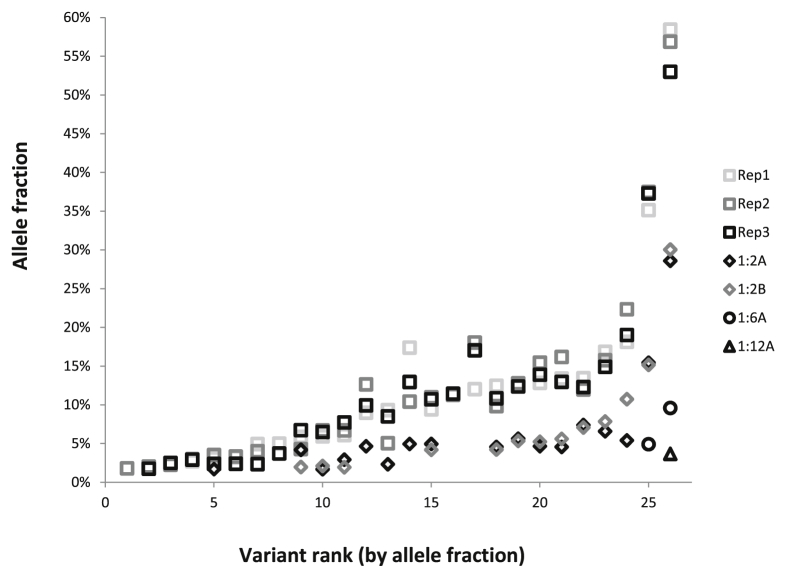
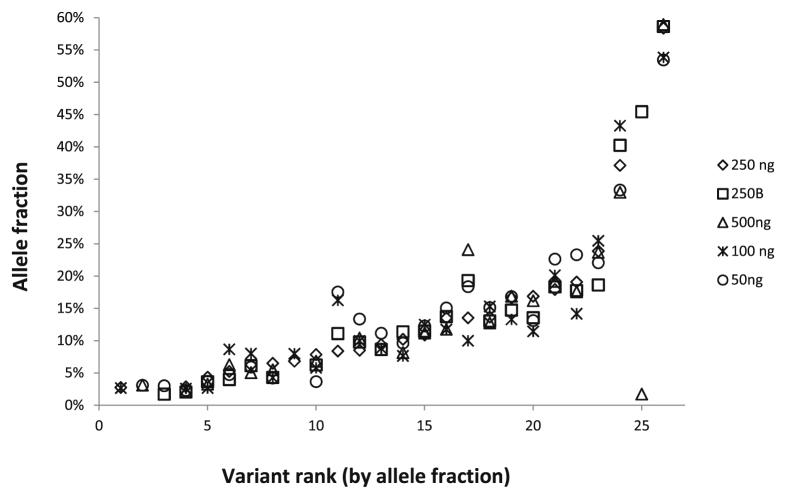
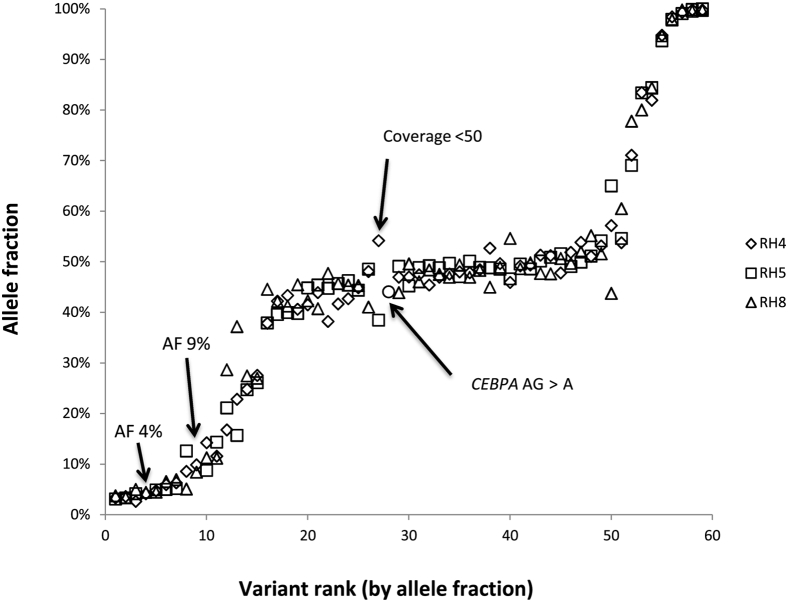
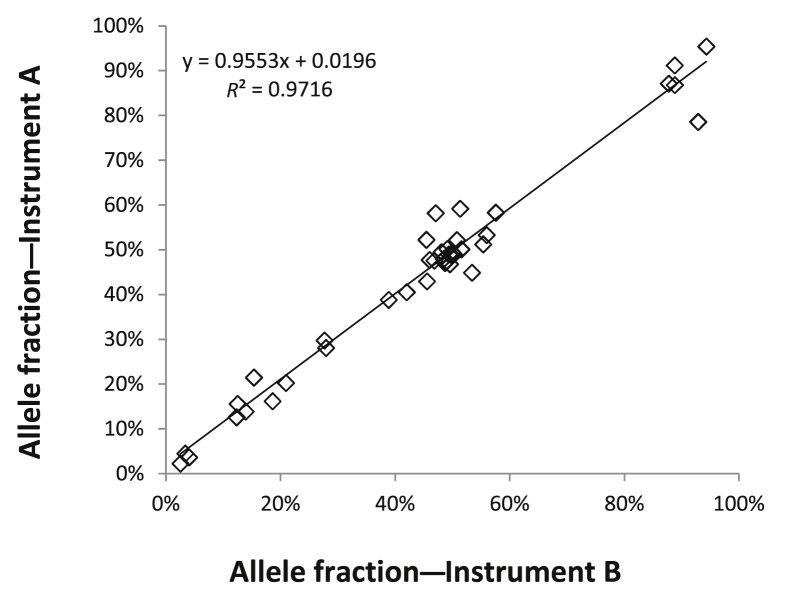
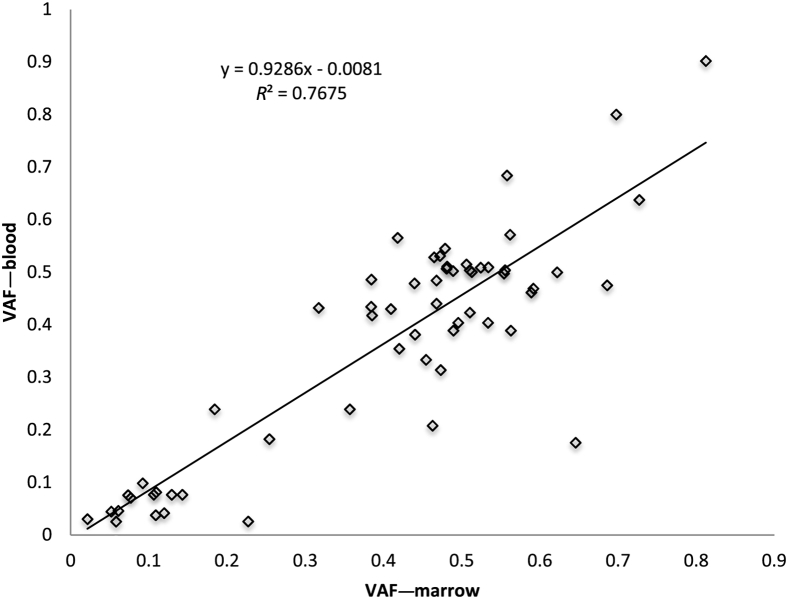
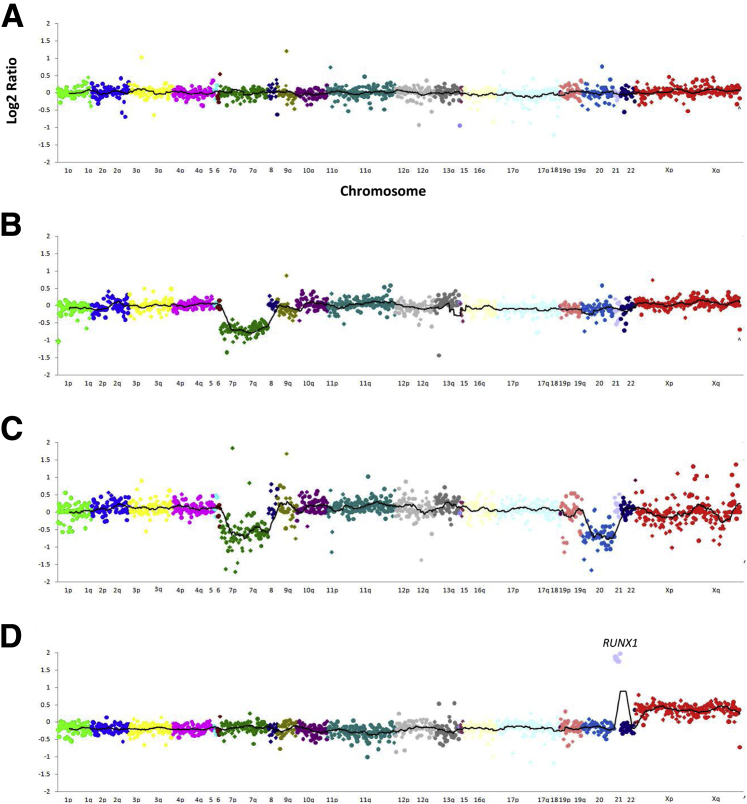
Targeted next-generation sequencing panels to identify genetic alterations in cancers are increasingly becoming an integral part of clinical practice. We report here the design, validation, and implementation of a comprehensive 95-gene next-generation sequencing panel targeted for hematologic malignancies that we named rapid heme panel. Rapid heme panel is amplicon based and covers hotspot regions of oncogenes and most of the coding regions of tumor suppressor genes. It is composed of 1330 amplicons and covers 175 kb of genomic sequence in total. Rapid heme panel's average coverage is 1500× with <5% of the amplicons with <50× coverage, and it reproducibly detects single nucleotide variants and small insertions/deletions at allele frequencies of ≥5%. Comparison with a capture-based next-generation sequencing assay showed that there is >95% concordance among a wide array of variants across a range of allele frequencies. Read count analyses that used rapid heme panel showed high concordance with karyotypic results when tumor content was >30%. The average turnaround time was 7 days over a 6-month span with an average volume of ≥40 specimens per week and a low sample fail rate (<1%), demonstrating its suitability for clinical application.


Figures

Figure 1
Figure 1
TruSeq Custom Amplicon assay workflow diagram.
Figure 2
Figure 2
Comparison of allele frequencies determined by amplification- and reference hybrid capture–based next-generation sequencing assays. One hundred twenty-nine variants in 24 samples are identified by both methods, and the variant allele frequencies as determined by both assays across a wide range of variant allele frequencies are highly concordant (correlation coefficient, R2 = 0.89).
Figure 3
Figure 3
Determination of analytical sensitivity. DNA from the mixed positive sample (five different cell lines comprising 26 different allele variants; allele frequencies ranging from 3% to 60%) was tested, undiluted, by rapid heme panel in triplicate (Rep1, 2, 3, squares) and was serially diluted into normal DNA at dilutions of 1:2 (A and B in duplicate, diamonds), 1:6 (circles), and 1:12 (triangle). On the x axis, the variants are sorted by increasing allele frequency and numbered 1 to 26.
Figure 4
Figure 4
Evaluation of optimal DNA input amount. DNA from the mixed positive cell line sample was tested, undiluted, using different amounts of input DNA for library preparation. Two hundred fifty nanograms was run in duplicate, and the other amounts were run once. On the x axis, the variants are sorted by increasing allele frequency and numbered 1 to 26.
Figure 5
Figure 5
Inter-run reproducibility. Eight samples comprising 59 single nucleotide variants and insertions/deletions with allele frequencies that ranged from 3% to 100% were tested in three separate runs; among these variants, 55 of 59 (93%) were detected in all three runs. Arrows point to four variants not detected in all three runs. Two variants were in regions with poor coverage in the runs where they were not identified (CEBPA variant was adequately covered in one of three runs and the other had <50× coverage in one run). The two low AF variants (average 4% and 9%) were not identified in a third replicate despite adequate coverage (>200×). Review of the BAM file in Integrated Genome Viewer shows that there were reads of the variant sequences in the third run, but below the pipeline cutoff. AF, allele frequency.
Figure 6
Figure 6
Reproducibility between two MiSeq instruments. Twelve samples comprising 41 different single nucleotide variants and insertions/deletions with allele frequencies that ranged from <5% to >90% were tested on two separate MiSeq instruments. The allele frequencies for the different variants were highly concordant between both instruments across the full range of allele frequencies (correlation coefficient, R2 = 0.97).
Figure 7
Figure 7
Comparison between peripheral blood and bone marrow samples. Eighteen pairs of peripheral blood and bone marrow collected at the same time were analyzed by rapid heme panel, and the variants were sorted by increasing allele frequency and plotted to show the concordance. Fifty-nine variants were found in both samples with good correlation. The allele frequencies are lower in peripheral blood when the percentage of lymphocytes is >20%. VAF, variant allele frequency.
Figure 8
Figure 8
Examples of copy number variant analysis by rapid heme panel. Log2 ratio plots of normalized read count across the 1300 amplicons in rapid heme panel sorted by chromosomal coordinates. One dot represents one amplicon. Different chromosomes are represented by different colors. The line represents 30-amplicon sliding average. The y axis indicates log2 ratio; x axis, chromosomes. A: A representative female sample with no gain or loss of genes identified. B: A sample from a female with loss of all amplicons on chromosome 7. C: A male sample with loss of all amplicons on chromosomes 7 and 20. D: A female sample with amplification of RUNX1 on chromosome 21 and gain of chromosome X.

References

    1. Metzker M.L. Sequencing technologies — the next generation. Nat Rev Genet. 2010;11:31–46. - PubMed
    1. Cazzola M., Della Porta M.G., Malcovati L. The genetic basis of myelodysplasia and its clinical relevance. Blood. 2013;122:4021–4034. - PMC - PubMed
    1. Lindsley R.C., Ebert B.L. The biology and clinical impact of genetic lesions in myeloid malignancies. Blood. 2013;122:3741–3748. - PubMed
    1. Cancer Genome Atlas Research Network Genomic and epigenomic landscapes of adult de novo acute myeloid leukemia. N Engl J Med. 2013;368:2059–2074. - PMC - PubMed
    1. Lundberg P., Karow A., Nienhold R., Looser R., Hao-Shen H., Nissen I., Girsberger S., Lehmann T., Passweg J., Stern M., Beisel C., Kralovics R., Skoda R.C. Clonal evolution and clinical correlates of somatic mutations in myeloproliferative neoplasms. Blood. 2014;123:2220–2228. - PubMed

Publication types

Substances