. 2016 Jun 24:7:11706.
doi: 10.1038/ncomms11706.

A survey of the sorghum transcriptome using single-molecule long reads

Affiliations

A survey of the sorghum transcriptome using single-molecule long reads

Salah E Abdel-Ghany et al. Nat Commun. .

Abstract

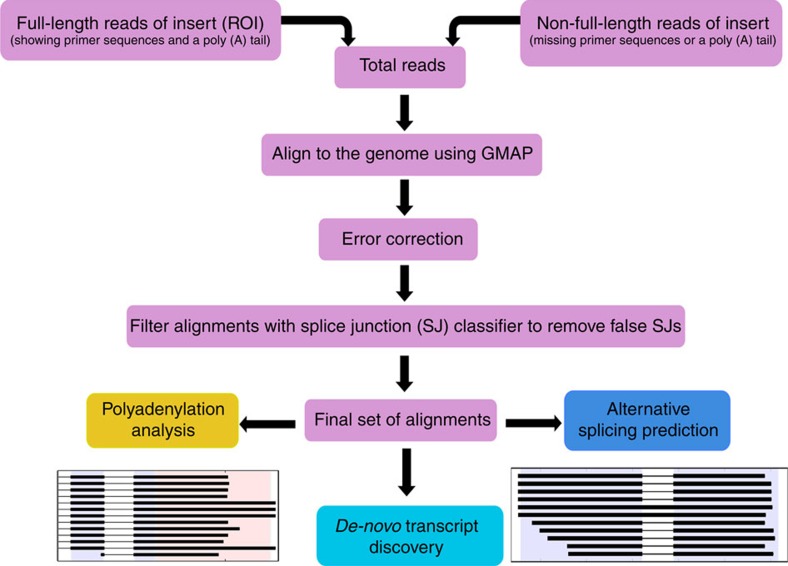
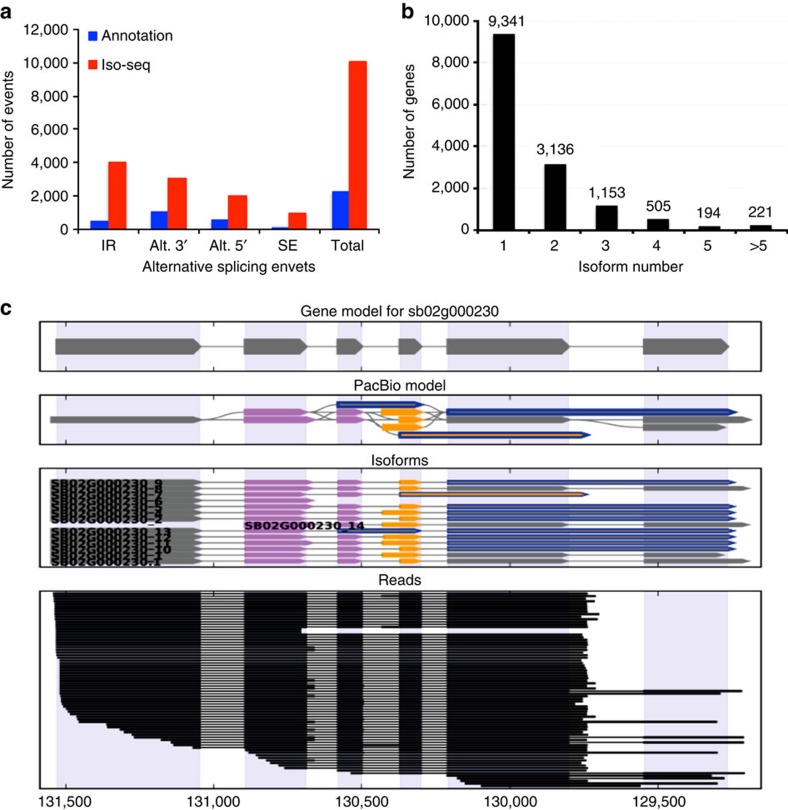
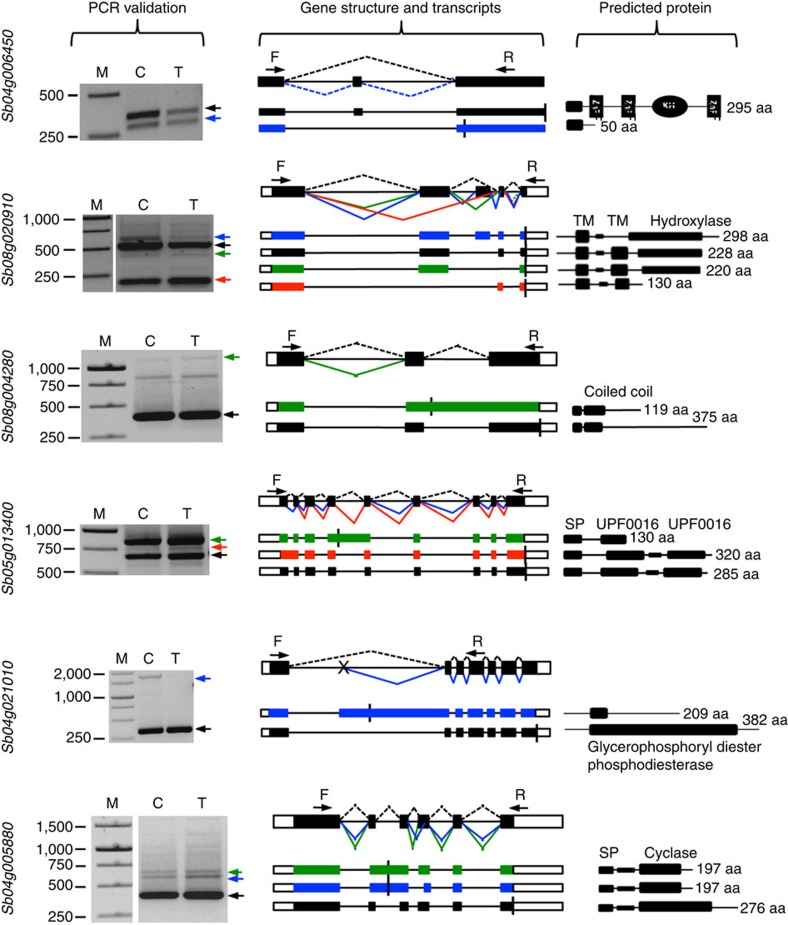
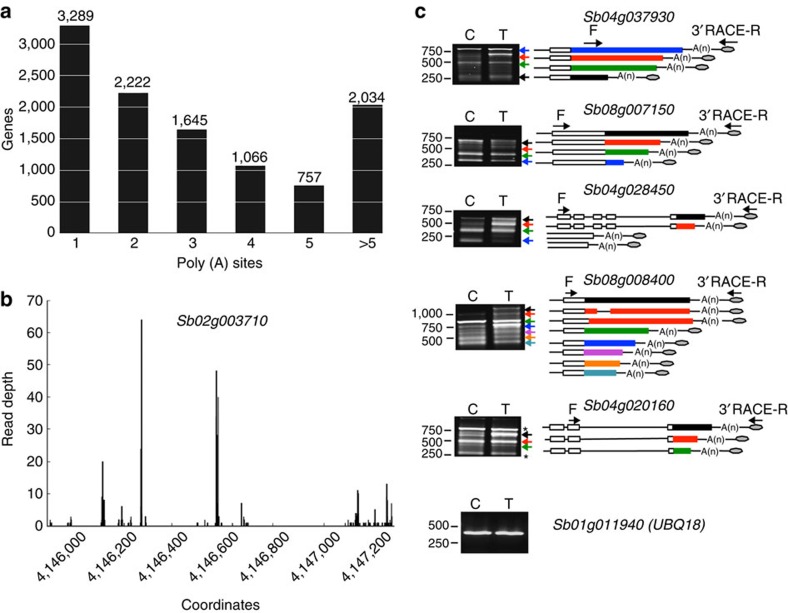
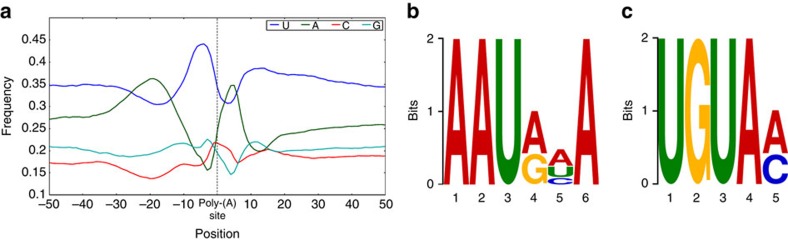
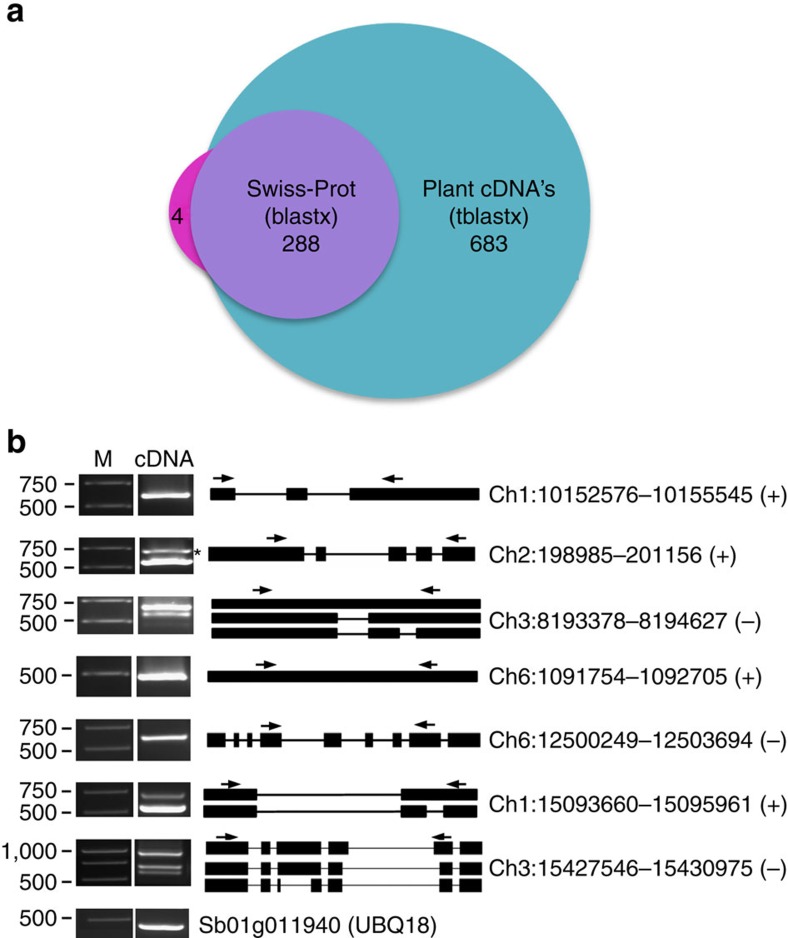
Alternative splicing and alternative polyadenylation (APA) of pre-mRNAs greatly contribute to transcriptome diversity, coding capacity of a genome and gene regulatory mechanisms in eukaryotes. Second-generation sequencing technologies have been extensively used to analyse transcriptomes. However, a major limitation of short-read data is that it is difficult to accurately predict full-length splice isoforms. Here we sequenced the sorghum transcriptome using Pacific Biosciences single-molecule real-time long-read isoform sequencing and developed a pipeline called TAPIS (Transcriptome Analysis Pipeline for Isoform Sequencing) to identify full-length splice isoforms and APA sites. Our analysis reveals transcriptome-wide full-length isoforms at an unprecedented scale with over 11,000 novel splice isoforms. Additionally, we uncover APA of ∼11,000 expressed genes and more than 2,100 novel genes. These results greatly enhance sorghum gene annotations and aid in studying gene regulation in this important bioenergy crop. The TAPIS pipeline will serve as a useful tool to analyse Iso-Seq data from any organism.


Figures

Figure 1
Figure 1. Transcriptome Analysis Pipeline for Isoform Sequencing.
Schematic workflow of the transcriptome assembly and analysis pipeline for Pacific Biosciences Isoform Sequencing reads.
Figure 2
Figure 2. Alternative splicing and splice isoform analysis with Iso-Seq reads.
(a) The total number of AS events in genes expressed in seedlings based on Iso-Seq data compared with the annotated gene models. Annotation, AS events in genes expressed in seedlings based on gene models; Iso-Seq, AS events in genes expressed in seedlings based on Iso-Seq reads. Alt 3′, alternative 3′ splicing; Alt 5′, alternative 5′ splicing; ES, Exon skipping; IR, intron retention; Total, All AS events. (b) Distribution of genes that produce one or more splice isoforms in seedlings. (c) An example of a gene that produces 13 novel splice isoforms. The gene models contain a single splice isoform for this gene. Gene model (top), splice graph (middle) and aligned reads (bottom) are shown.
Figure 3
Figure 3. PCR validation of alternative splicing events identified by Iso-Seq.
cDNA from control (C) and treated (T) samples was used for PCR. Primer sets (F, forward and R, reverse) were designed to flank the splicing events. PCR products were excised from the gel, purified, cloned into pGEM-T Easy Vectors and sequenced from both directions. Sequences were aligned to the corresponding gene sequence and the structures of the novel isoforms were verified. Exons are represented by filled boxes, introns by lines and 3′ and 5′ UTRs are represented by open boxes. The gene models have one annotated isoform, which is shown in black. The novel isoforms that are supported by PacBio reads and/or sequencing of PCR products are colour-coded and indicated by arrows. Different splicing events are represented by lines connecting exons. Predicted protein for each isoform and putative domains predicted using the simple modular architecture tool (SMART) are presented in the right panel. The location of the predicted stop codon in the transcripts is represented by a vertical line. Alt. 3′, alternative acceptor site; Alt. 5′, alternative donor site; ES, exon skipping; IR, intron retention; SP, signal peptide; TM, transmembrane; M, lane with DNA size markers. Gene ID is shown at the left for each panel.
Figure 4
Figure 4. Alternative polyadenylation analysis.
(a) Distribution of the number of poly(A) sites per gene. Poly(A) reads were clustered such that each site must have at least 2 reads supporting it and no two clusters are within 15 nucleotides of each other. (b) An example of a gene that produces transcripts with multiple polyadenylation sites in 3′UTR. Distribution of number of poly(A) reads (Y axis) along with estimated cluster centres shown as vertical lines on the x axis. (c) Validation of polyadenylation sites by PCR. cDNA was prepared from RNA extracted from control (C) and treated (T) tissues using 3′ RACE adaptor primer and PCR was carried out using 3′ RACE reverse (R) primer and gene-specific forward (F) primer. Sizes of PCR products were calculated and compared with the predicted products calculated from Iso-Seq. Exons are represented by open boxes and 3′ UTRs were represented by coloured boxes. Equal amount of cDNA in samples is verified using UBQ as an internal control.
Figure 5
Figure 5. Analysis of sequence elements at cleavage sites.
(a) Nucleotide composition around poly(A) cleavage sites. The relative frequency of a nucleotide is shown as a function of genomic position across all poly(A) cleavage sites detected in our data. The low GC-content and poly(A) spike after the cleavage site is in agreement with the poly(A) analysis reported for Arabidopsis. (b) MEME analysis identified a poly(A) signal in sorghum transcripts. An over-represented motif at 25 nts upstream of the poly(A) site similar to the known signal in dicots was identified. (c) Another overrepresented motif (UGUA) is found about 35 nts upstream of the poly(A) site.
Figure 6
Figure 6. Novel genes identified in Iso-Seq data.
(a) The number of novel genes in sorghum that showed significant sequence similarity in a blastx search against Swiss-Prot proteins or a significant match in a tblastx search against plant cDNAs. (b) RT–PCR validation of novel genes and putative long non-coding RNAs. Single exon genes, genes with multiple exons and predicted long non-coding RNAs were validated by PCR using cDNA prepared from 8-day-old seedlings. Forward and reverse primers are shown as arrows. The schematic representation of genes is shown. Exons are represented as black boxes and introns as lines. The coordinates of the genes on the chromosomes were shown at the right. Plus and minus signs represent the forward and reverse strands, respectively.

References

    1. Kalsotra A. & Cooper T. A. Functional consequences of developmentally regulated alternative splicing. Nat. Rev. Genet. 12, 715–729 (2011). - PMC - PubMed
    1. Sherstnev A. et al.. Direct sequencing of Arabidopsis thaliana RNA reveals patterns of cleavage and polyadenylation. Nat. Struct. Mol. Biol. 19, 845–852 (2012). - PMC - PubMed
    1. Wu X. et al.. Genome-wide landscape of polyadenylation in Arabidopsis provides evidence for extensive alternative polyadenylation. Proc. Natl Acad. Sci. USA 108, 12533–12538 (2011). - PMC - PubMed
    1. Reddy A. S., Marquez Y., Kalyna M. & Barta A. Complexity of the alternative splicing landscape in plants. Plant Cell 25, 3657–3683 (2013). - PMC - PubMed
    1. Elkon R., Ugalde A. P. & Agami R. Alternative cleavage and polyadenylation: extent, regulation and function. Nat. Rev. Genet. 14, 496–506 (2013). - PubMed

Publication types

LinkOut - more resources