. 2016 Jun 24:7:11708.
doi: 10.1038/ncomms11708.

Unveiling the complexity of the maize transcriptome by single-molecule long-read sequencing

Affiliations

Unveiling the complexity of the maize transcriptome by single-molecule long-read sequencing

Bo Wang et al. Nat Commun. .

Abstract

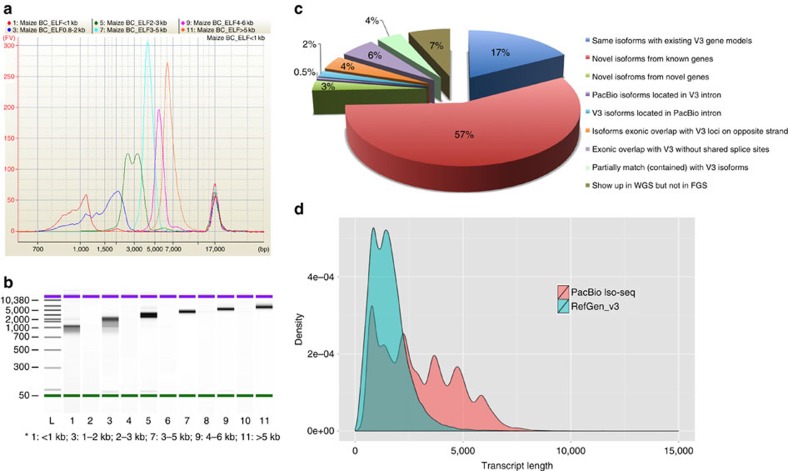
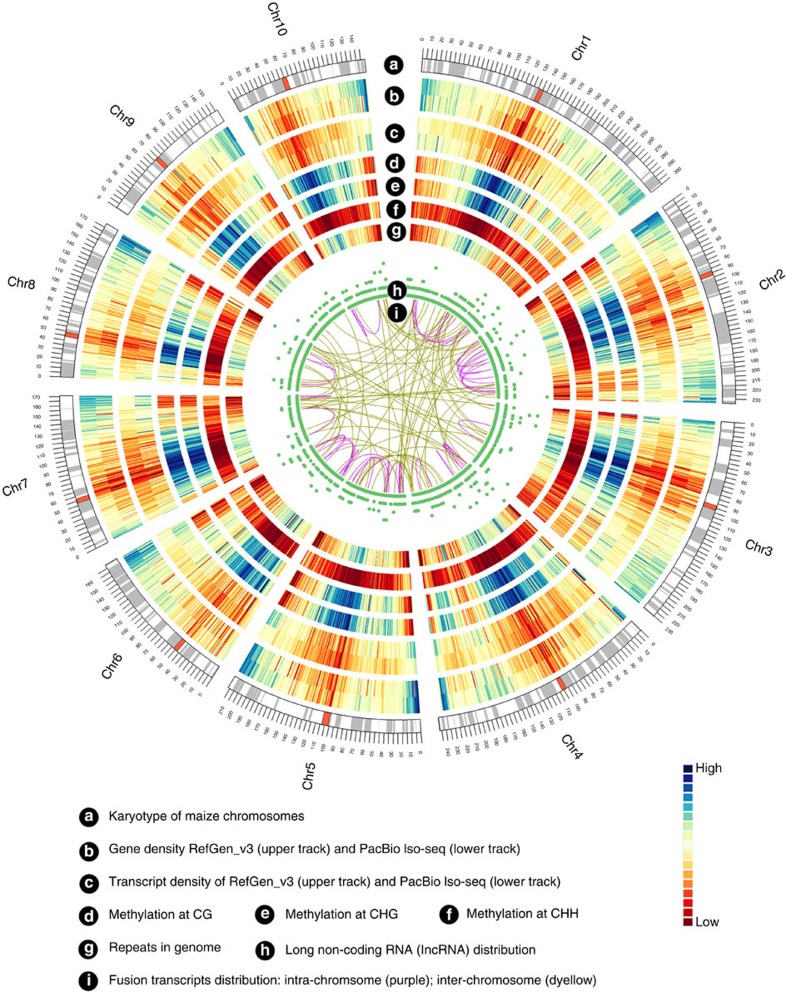
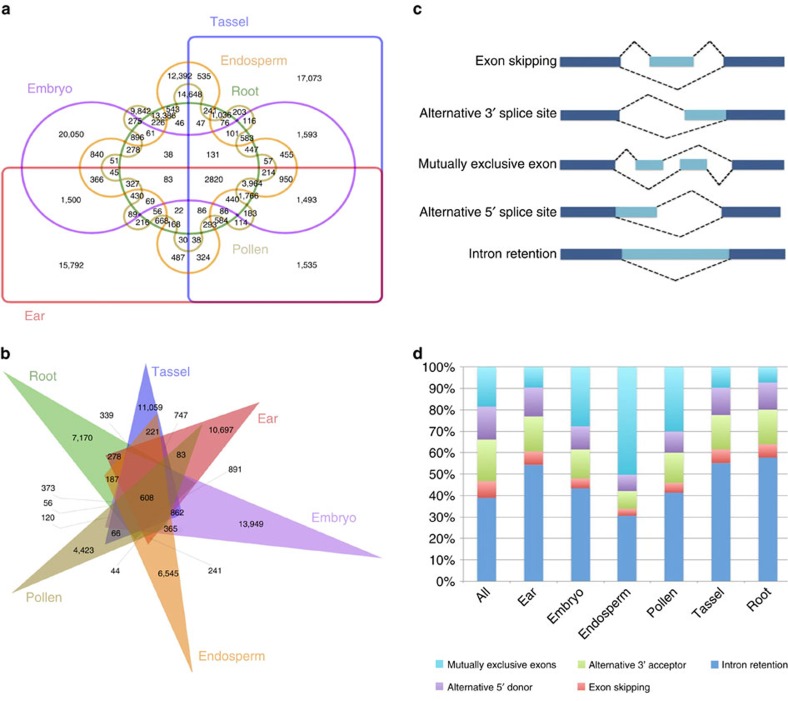
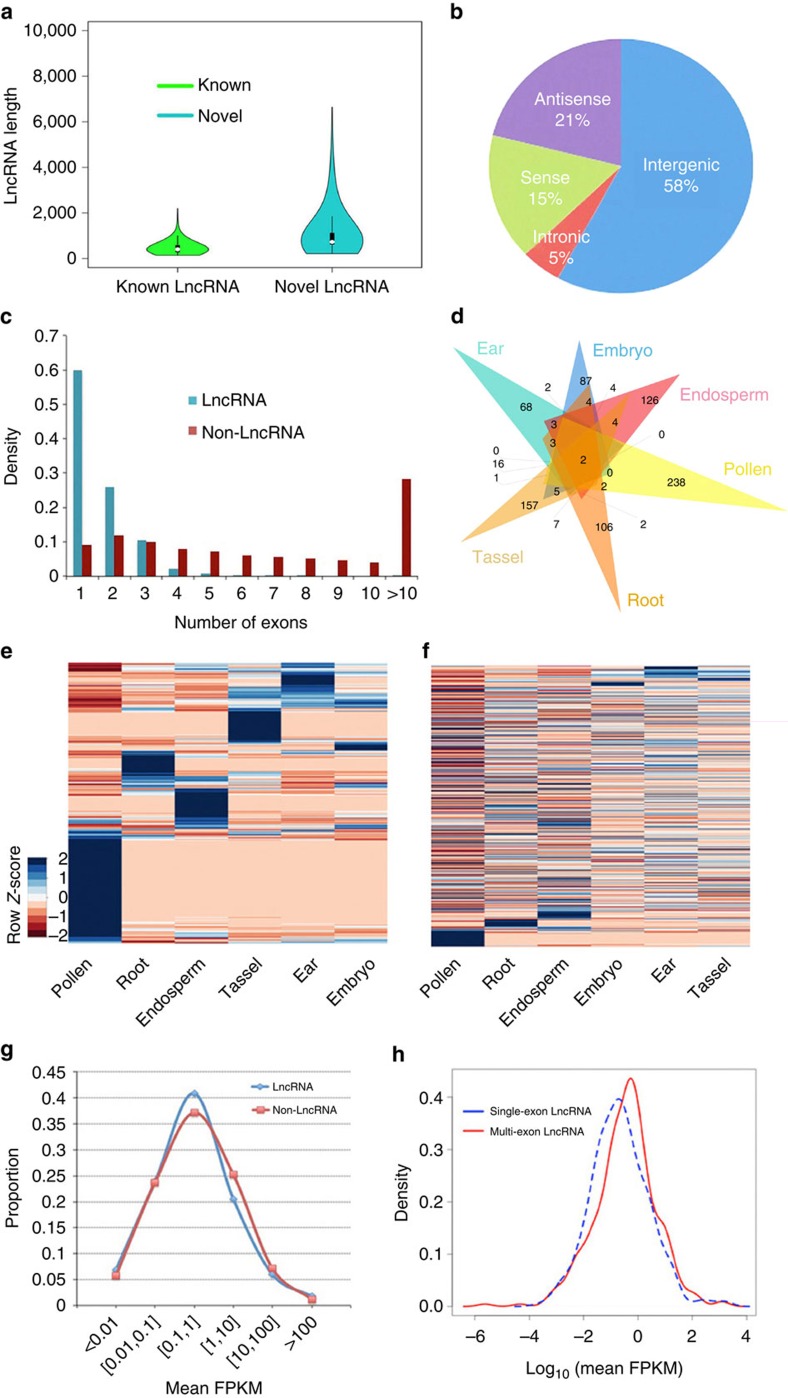
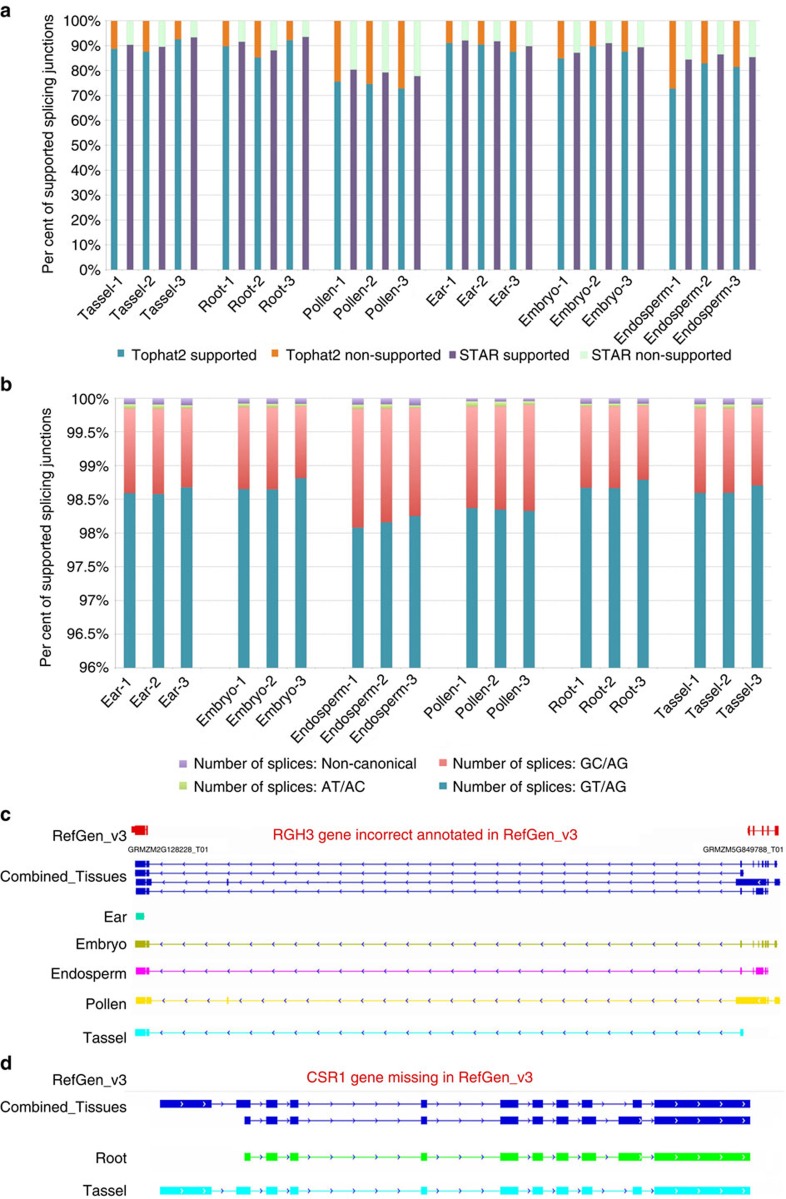
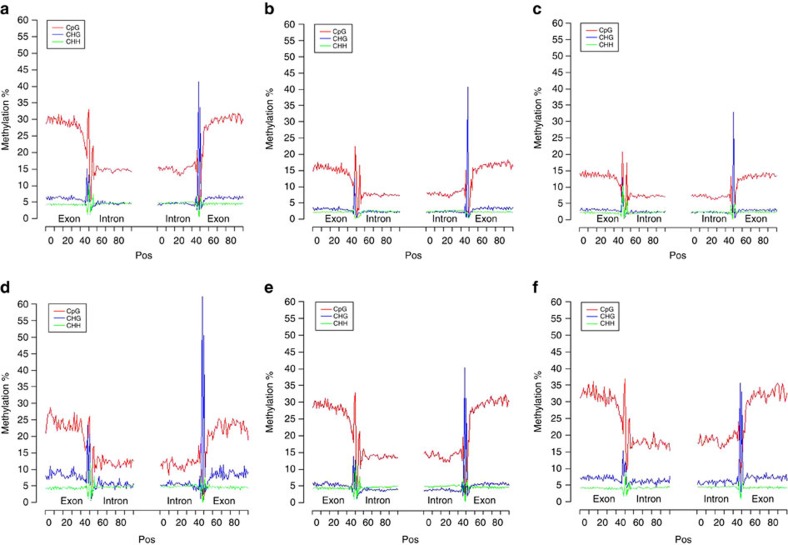
Zea mays is an important genetic model for elucidating transcriptional networks. Uncertainties about the complete structure of mRNA transcripts limit the progress of research in this system. Here, using single-molecule sequencing technology, we produce 111,151 transcripts from 6 tissues capturing ∼70% of the genes annotated in maize RefGen_v3 genome. A large proportion of transcripts (57%) represent novel, sometimes tissue-specific, isoforms of known genes and 3% correspond to novel gene loci. In other cases, the identified transcripts have improved existing gene models. Averaging across all six tissues, 90% of the splice junctions are supported by short reads from matched tissues. In addition, we identified a large number of novel long non-coding RNAs and fusion transcripts and found that DNA methylation plays an important role in generating various isoforms. Our results show that characterization of the maize B73 transcriptome is far from complete, and that maize gene expression is more complex than previously thought.


Conflict of interest statement

E.T., T.A.C. and T.H. are full-time employees of Pacific Biosciences. All other authors declare no competing financial interests.

Figures

Figure 1
Figure 1. Maize PacBio Iso-Seq barcoding library and comparison of isoforms between RefGen_v3 and PacBio data.
(a) Quantification of six size-fractionated libraries on a Bioanalyzer chip. (b) Gel image of six size-fractionated libraries on a Bioanalyzer chip. (c) Comparison of PacBio and RefGen_v3 isoforms. (d) Comparison of isoform length between RefGen_v3 and PacBio data.
Figure 2
Figure 2. CIRCOS visualization of different data at the genome-wide level.
(a) Karyotype of maize genome. (b) Comparison of gene density between genes covered by RefGen_v3 and the PacBio data set. Gene density was calculated in a 1-Mb sliding window at 20 kb intervals. (c) Comparison of isoform density between RefGen_v3 and PacBio sequences; isoforms density was calculated in a 1-Mb sliding window at 20 kb intervals. (d) CG methylation level. (e) CHG methylation level. (f) CHH methylation level. Each methylation in 1 Mb bins on each chromosome. (g) Repeat density in genome. (h) lncRNA density, in 1 Mb bins on each chromosome. (i) Linkage of fusion transcripts: purple, intra-chromosomal; dark yellow, inter-chromosomal.
Figure 3
Figure 3. Comparison of different isoforms among six tissues and different alternative splicing modes.
(a) Overlap of all PacBio isoforms in six tissues. (b) Overlap of novel isoforms among six tissues. (c) Visualization of five alternative splicing modes. (d) Distribution of different types of alternative splicing events in six tissues.
Figure 4
Figure 4. Characters of identified novel lncRNAs.
(a) Comparison of lengths of novel lncRNAs identified in this study with previously reported lncRNAs. (b) Proportions of four kinds of lncRNA, classified according to biogenesis. (c) Number of exons of lncRNAs and non-lncRNAs. (d) Overlap of lncRNAs among six tissues. (e) Heatmap of lncRNA expression in six tissues. (f) Heatmap of non-lncRNA expression in six tissues. (g) Comparison of overall expression between lncRNAs and non-lncRNAs. (h) Comparison of overall expression between single-exon lncRNAs and multi-exon lncRNAs.
Figure 5
Figure 5. Validation of PacBio isoforms.
(a) Verification of PacBio isoform junctions by short-read junction using TopHat2 and STAR. (b) Splicing motif distribution of short-read mapping by STAR. (c) The previously corrected RGH3 gene model was found in the Iso-Seq data. (d) The previously missed CSR1 gene model was found in the Iso-Seq data.
Figure 6
Figure 6. Level of DNA methylation at splice sites.
(a) Level of DNA methylation, combing sense and antisense strand. (b) Level of DNA methylation on the sense strand. (c) Level of DNA methylation on the antisense strand. (d) Level of DNA methylation in genes with only one isoform. (e) Level of DNA methylation in all isoforms of genes with two to ten isoforms. (f) Level of DNA methylation in all isoforms of genes with more than 20 isoforms.

References

    1. Sekhon R. S. et al.. Genome-wide atlas of transcription during maize development. Plant J. 66, 553–563 (2011). - PubMed
    1. Chen J. et al.. Dynamic transcriptome landscape of maize embryo and endosperm development. Plant Physiol. 166, 252–264 (2014). - PMC - PubMed
    1. Hirsch C. N. et al.. Insights into the maize pan-genome and pan-transcriptome. Plant Cell 26, 121–135 (2014). - PMC - PubMed
    1. Schnable P. S. et al.. The B73 maize genome: complexity, diversity, and dynamics. Science 326, 1112–1115 (2009). - PubMed
    1. Wei F. et al.. The physical and genetic framework of the maize B73 genome. PLoS Genet. 5, e1000715 (2009). - PMC - PubMed

Publication types

MeSH terms