. 2016 Jun 24:6:28529.
doi: 10.1038/srep28529.

The Phosphorylation and Distribution of Cortactin Downstream of Integrin α9β1 Affects Cancer Cell Behaviour

Affiliations

The Phosphorylation and Distribution of Cortactin Downstream of Integrin α9β1 Affects Cancer Cell Behaviour

Anette M Høye et al. Sci Rep. .

Abstract

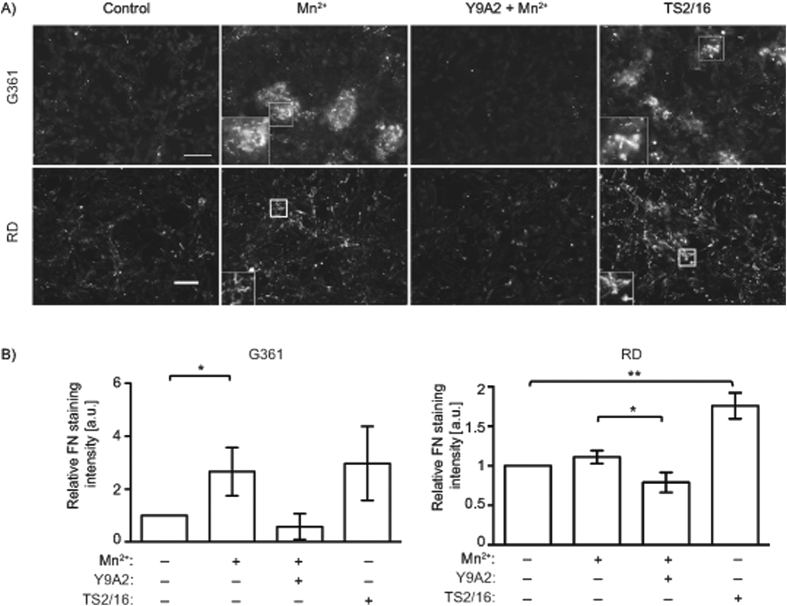
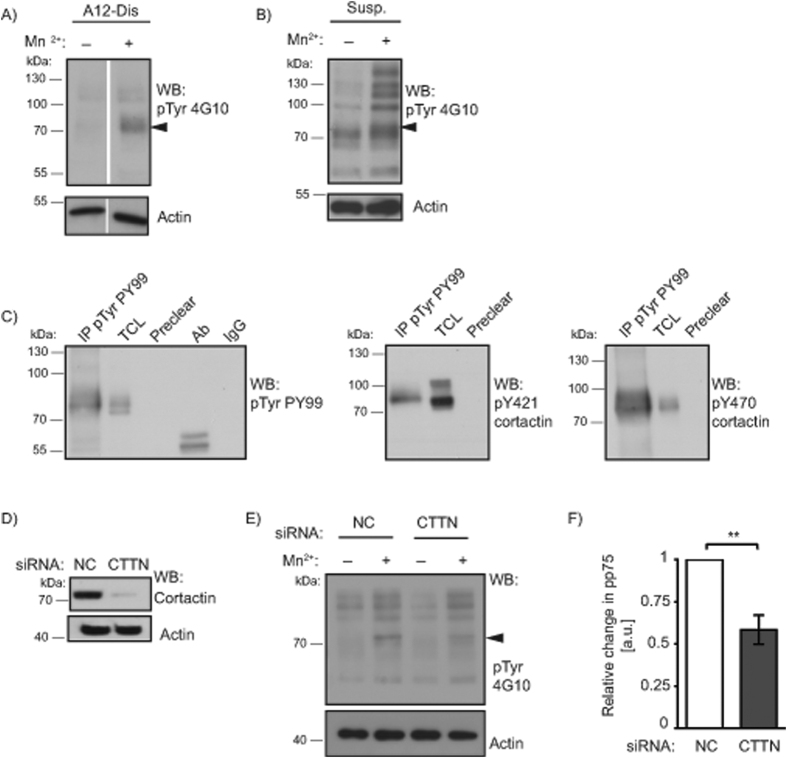
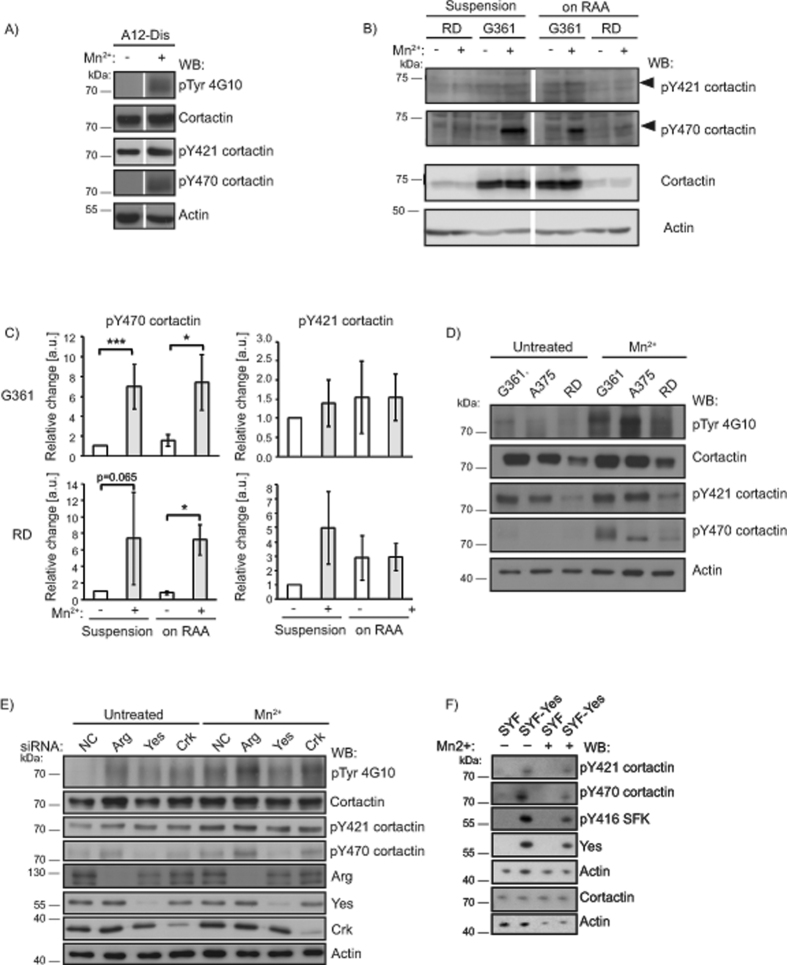
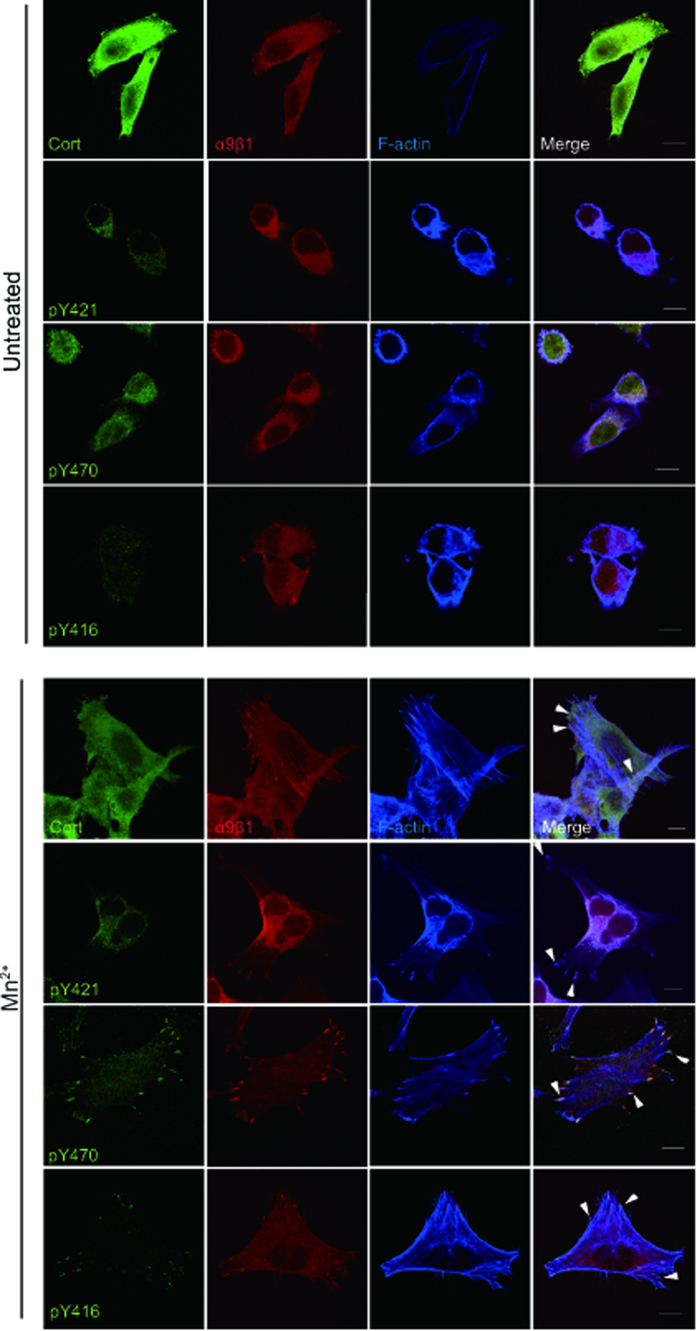
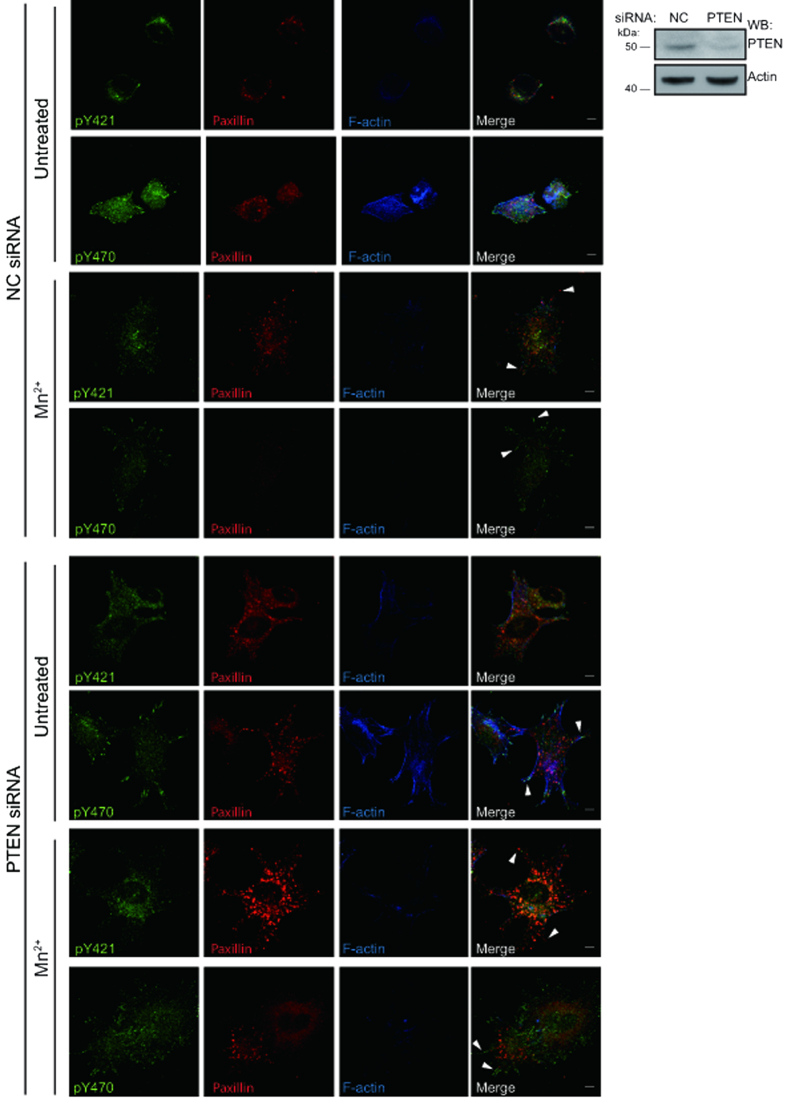
Integrins, a family of heterodimeric adhesion receptors are implicated in cell migration, development and cancer progression. They can adopt conformations that reflect their activation states and thereby impact adhesion strength and migration. Integrins in an intermediate activation state may be optimal for migration and we have shown previously that fully activated integrin α9β1 corresponds with less migratory behaviour in melanoma cells. Here, we aimed to identify components associated with the activation status of α9β1. Using cancer cell lines with naturally occuring high levels of this integrin, activation by α9β1-specific ligands led to upregulation of fibronectin matrix assembly and tyrosine phosphorylation of cortactin on tyrosine 470 (Y470). Specifically, cortactin phosphorylated on Y470, but not Y421, redistributed together with α9β1 to focal adhesions where active β1 integrin also localises, upon integrin activation. This was commensurate with reduced migration. The localisation and phosphorylation of cortactin Y470 was regulated by Yes kinase and PTEN phosphatase. Cortactin levels influenced fibronectin matrix assembly and active β1 integrin on the cell surface, being inversely correlated with migratory behaviour. This study underlines the complex interplay between cortactin and α9β1 integrin that regulates cell-extracellular matrix interactions.


Figures

Figure 1
Figure 1. Integrin activation increases fibronectin matrix assembly.
(A) Micrographs of G361 cells adherent to A12-Dis (upper panel) or RD cells adherent to TNfn3RAA (lower panel), in the absence or presence of Mn2+ (0.5 mM), or the α9β1-blocking antibody Y9A2 (10 μg/ml) in the presence of Mn2+ or treated with the β1-activating antibody TS2/16 (20 μg/ml) as indicated, and stained for FN. Scale bar: 75 μm for G361 cells, 50 μm for RD cells. Inserts are high-power micrographs (2x magnification) of boxed areas. (B) Quantitation of FN staining of micrographs in (A), fluorescence intensity was measured as described in Methods. Data from untreated control cells were set at 1.0. a.u. = arbitrary units. G361 data were analysed using unpaired two-tailed t-test and RD data were analysed using Mann-Whitney Rank Sum test.
Figure 2
Figure 2. Integrin activation results in tyrosine phosphorylation of a 75 kDa protein, identified as cortactin.
(A) G361 total cell lysates (TCLs) after adhesion to A12-Dis in the absence or presence of Mn2+ (1 mM) were analysed by WB using an anti-phosphotyrosine (pTyr) antibody (4G10). Full activation of integrins by Mn2+ leads to tyrosine phosphorylation of a 75-kDa (pp75) protein (arrowhead) compared to untreated cells. Total actin was used as loading control. (B) G361 cells in suspension with or without Mn2+ (3 mM) blotted for pTyr (4G10) and actin. (C) Immunoprecipitation (IP) with anti-pTyr antibody (PY99) of TCL from G361 cells in suspension treated with Mn2+ (3 mM). Samples were analysed by WB. TCL, preclear beads, antibody (Ab) alone, and mouse IgG (IgG), were included as controls. WBs were probed for pTyr (PY99), pY421 cortactin, and pY470 cortactin as indicated. (D) WB analysis of G361 TCL after 48 hours transfection with negative control (NC) or cortactin (CTTN) siRNA using cortactin antibody. (E) TCL from NC or CTTN siRNA treated cells was probed against pTyr (4G10) and actin. (F) Quantitation of (E) for relative levels of p75 tyrosine phosphorylation after Mn2+ treatment. Data from Mn2+ treated NC cells were set at 1.0. Data were analysed using unpaired two-tailed t-test.
Figure 3
Figure 3. Cortactin Y421 and Y470 are differentially phosphorylated upon full activation of integrins.
(A) WB of G361 TCL from cells in suspension or after adhesion to A12-Dis, in the absence or presence of Mn2+ (1 mM). (B) WB of RD and G361 TCL from cells in suspension or after adhesion to TNfn3RAA, in the absence or presence of Mn2+ (1 mM). (C) Quantitation of (B) for relative levels of cortactin Y470 and Y421 tyrosine phosphorylation after Mn2+ treatment. Data from untreated NC cells were set at 1.0. Data were analysed using Mann-Whitney Rank Sum test. (D) WB of TCL from G361, A375 and RD cells after adhesion to A12-Dis in the absence or presence of Mn2+ (1 mM). (E) G361 cells were transfected with NC, Arg, Yes, or Crk siRNA, and changes in cortactin tyrosine phosphorylation of Y421 and Y470 upon knockdown were evaluated by WB. (F) WB of TCL from SYF cells and SYF cells re-expressing Yes (SYF-Yes) that were either left untreated or subjected to Mn2+ treatment. This WB also shows that the antibodies recognising phosphorylated cortactin Y421 and Y470 discriminate phosphorylated from non-phosphorylated cortactin. Blots were analysed and probed for pTyr (4G10), cortactin, pY421 cortactin, pY470 cortactin, pY416 SFK, v-Src, Arg, Yes, Crk, and actin, as indicated.
Figure 4
Figure 4. Knockdown of cortactin increases FN matrix and active β1 integrin levels, while decreasing migration on A12-Dis.
(A) Micrographs of G361 cells attached to A12-Dis treated with NC or CTTN siRNA in the absence or presence of Mn2+ (0.5 mM), and stained for FN. Inserts are high-power micrographs (2x magnification) of boxed areas. Scale bars = 75 μm. All micrographs are representative. (B) Quantitation of (A). Data were analysed using unpaired two-tailed t-test. (C) Representative FACS profiles of total β1 (MAB1959, top graph) and active β1 (12G10) integrin (bottom graph) on the surface of G361 cells. (D) Quantitation of (C). Data were analysed using unpaired two-tailed t-test. (E) Cell migration of cortactin siRNA-treated G361 cells in the absence or presence of Mn2+ (1 mM). Data were analysed using unpaired two-tailed t-test. (F) Parental G361 were treated with NC or CTTN siRNA. G361 cells stably transfected with WT-myc, Y421F-myc, Y470F-myc, Y421D-myc, or Y470D-myc where indicated, were double transfected with CTTN siRNA and their respective plasmid 48 hours before migration. (E,F) Data are an average of three independent experiments performed in duplicate. Data were analysed using one-way ANOVA with Tukey’s multiple comparison test. (B–F) Data from untreated NC cells were set to 1.0 or 100.
Figure 5
Figure 5. Integrin α9β1, pY416 SFK and cortactin pY470, but not pY421, localises to focal adhesions upon integrin activation.
Representative confocal micrographs of G361 cells seeded on A12-Dis. Cells were stained for cortactin (cort), pY421 cortactin (pY421), pY470 cortactin (pY470), pY416 SFK (pY416), α9β1 (red), and F-actin (blue). Arrowheads indicate focal adhesion structures. Scale bars = 10 μm.
Figure 6
Figure 6. Knockdown of PTEN drives cortactin pY470 into focal adhesions regardless of integrin activation.
Representative confocal micrographs of parental G361 with NC or PTEN siRNA seeded on TNfn3RAA. Cells were stained for pY421 cortactin (pY421), pY470 cortactin (pY470), paxillin (red), and F-actin (blue). Scale bars = 10 μm. WB analysis of G361 TCL after 48 hours transfection with NC or PTEN siRNA using PTEN antibody.

Similar articles

Cited by

References

    1. Hynes R. O. Integrins: bidirectional, allosteric signaling machines. Cell 110, 673–687 (2002). - PubMed
    1. De Franceschi N., Hamidi H., Alanko J., Sahgal P. & Ivaska J. Integrin traffic - the update. J. Cell. Sci. 128, 839–852 (2015). - PMC - PubMed
    1. Seguin L., Desgrosellier J. S., Weis S. M. & Cheresh D. A. Integrins and cancer: regulators of cancer stemness, metastasis, and drug resistance. Trends Cell Biol. 25, 234–240 (2015). - PMC - PubMed
    1. Desgrosellier J. S. & Cheresh D. A. Integrins in cancer: biological implications and therapeutic opportunities. Nat. Rev. Cancer 10, 9–22 (2010). - PMC - PubMed
    1. Askari J. A. et al.. Focal adhesions are sites of integrin extension. J. Cell Biol. 188, 891–903 (2010). - PMC - PubMed

Publication types

MeSH terms