Comparative Study
. 2016 Oct;64(4):1232-48.
doi: 10.1002/hep.28696. Epub 2016 Jul 29.

Gut microbiota drive the development of neuroinflammatory response in cirrhosis in mice

Affiliations
Comparative Study

Gut microbiota drive the development of neuroinflammatory response in cirrhosis in mice

Dae Joong Kang et al. Hepatology. 2016 Oct.

Abstract

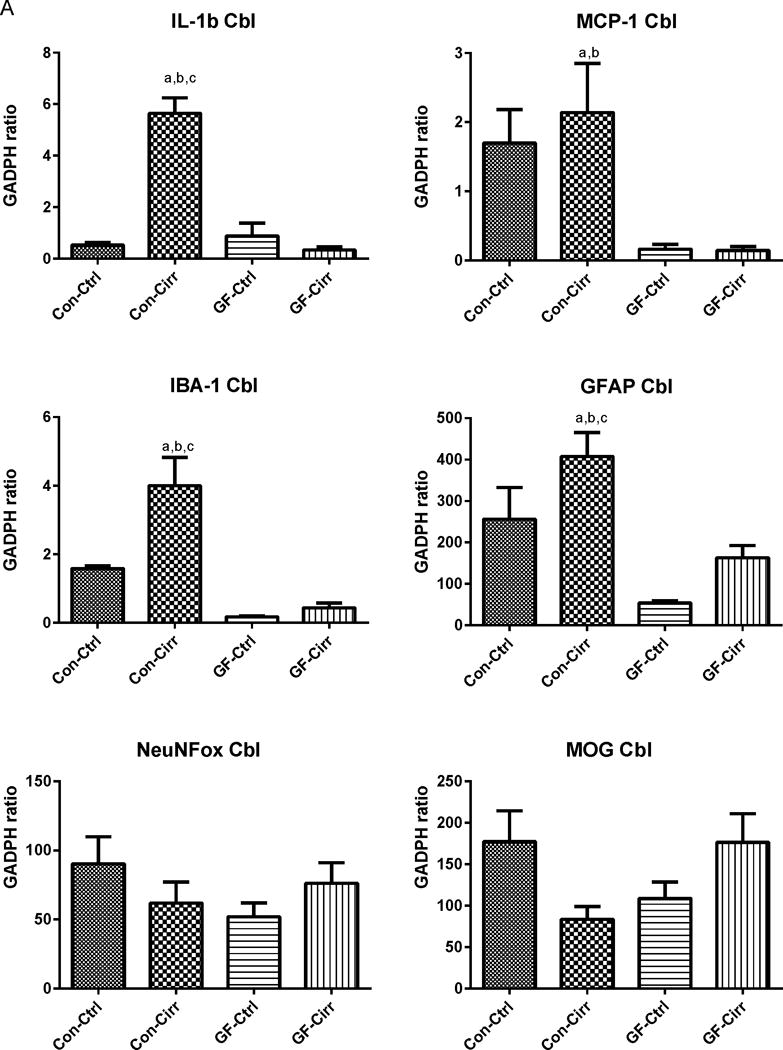
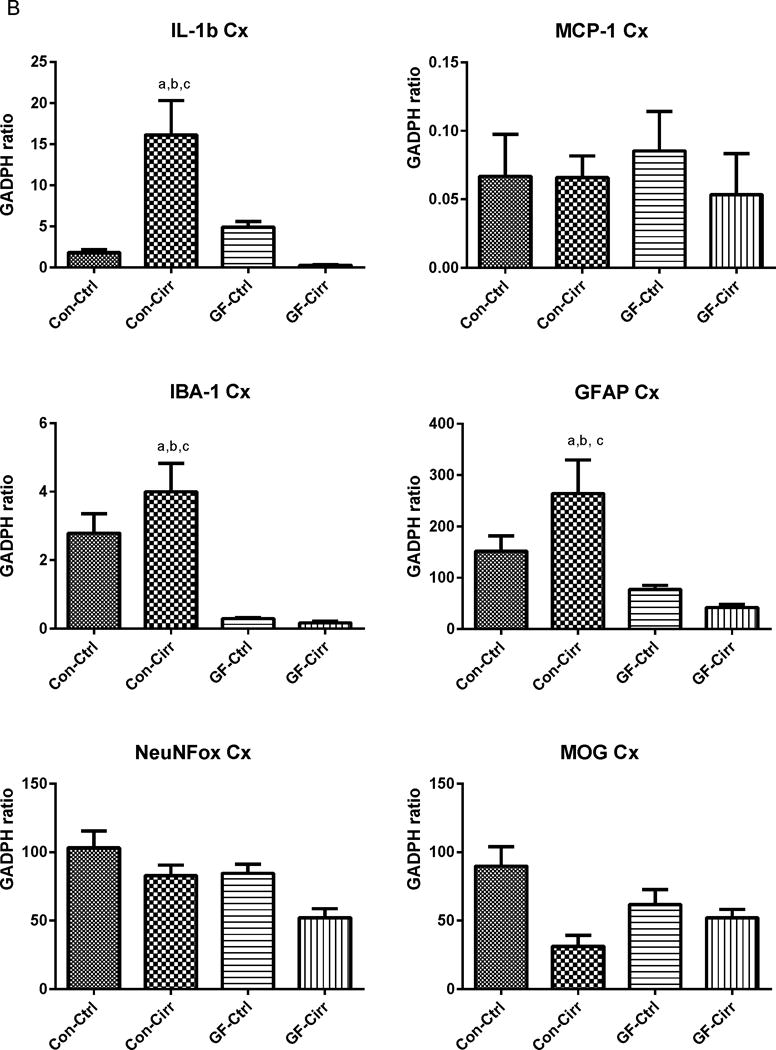
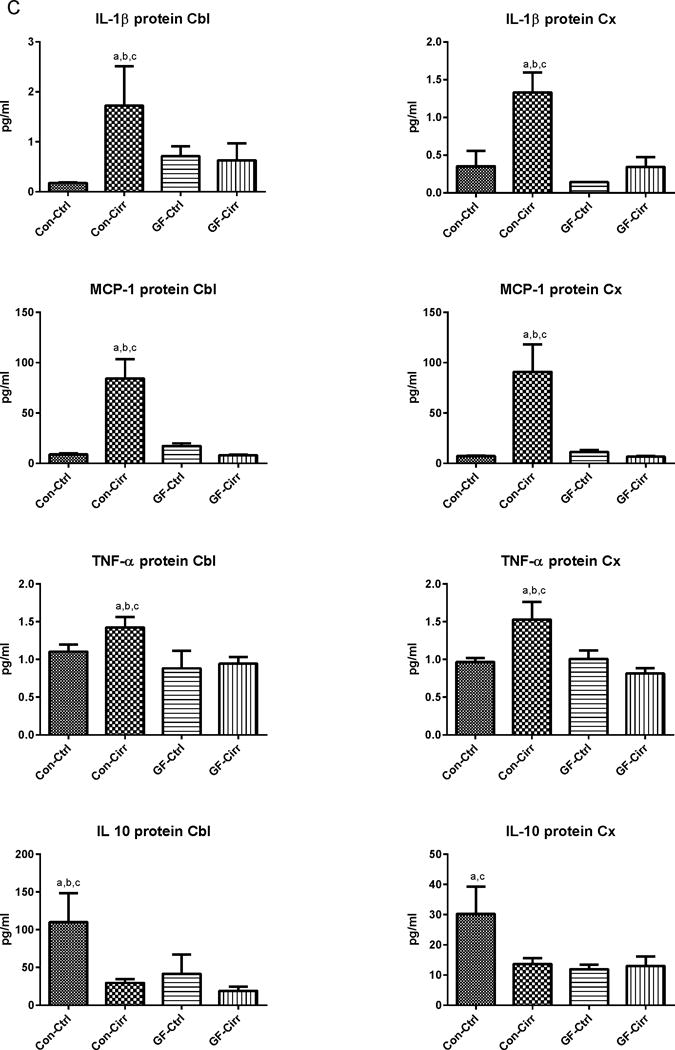
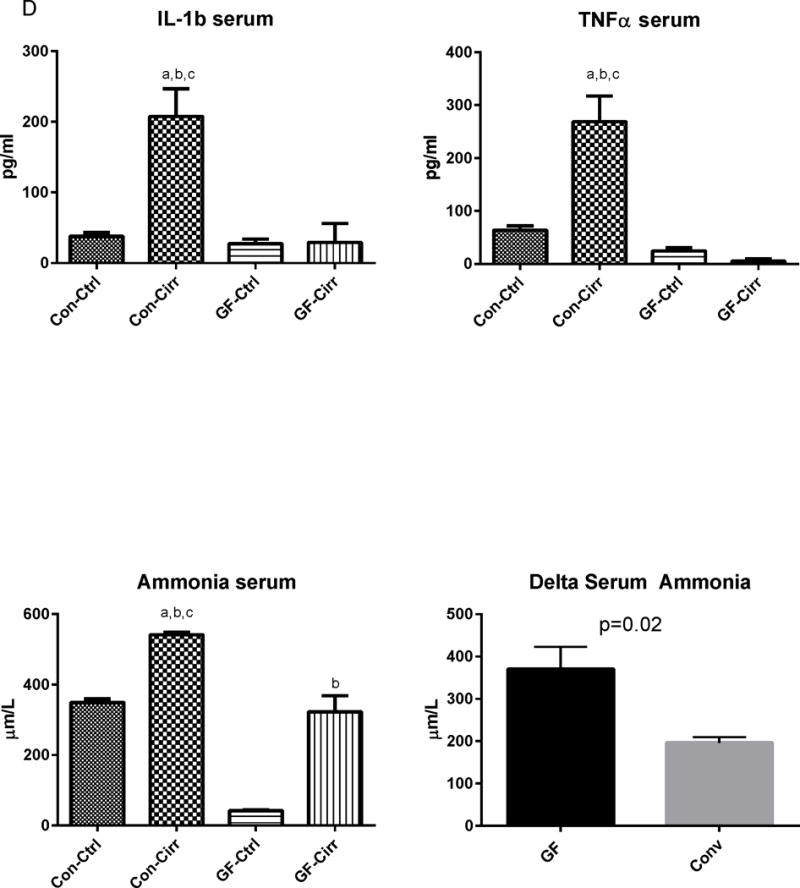
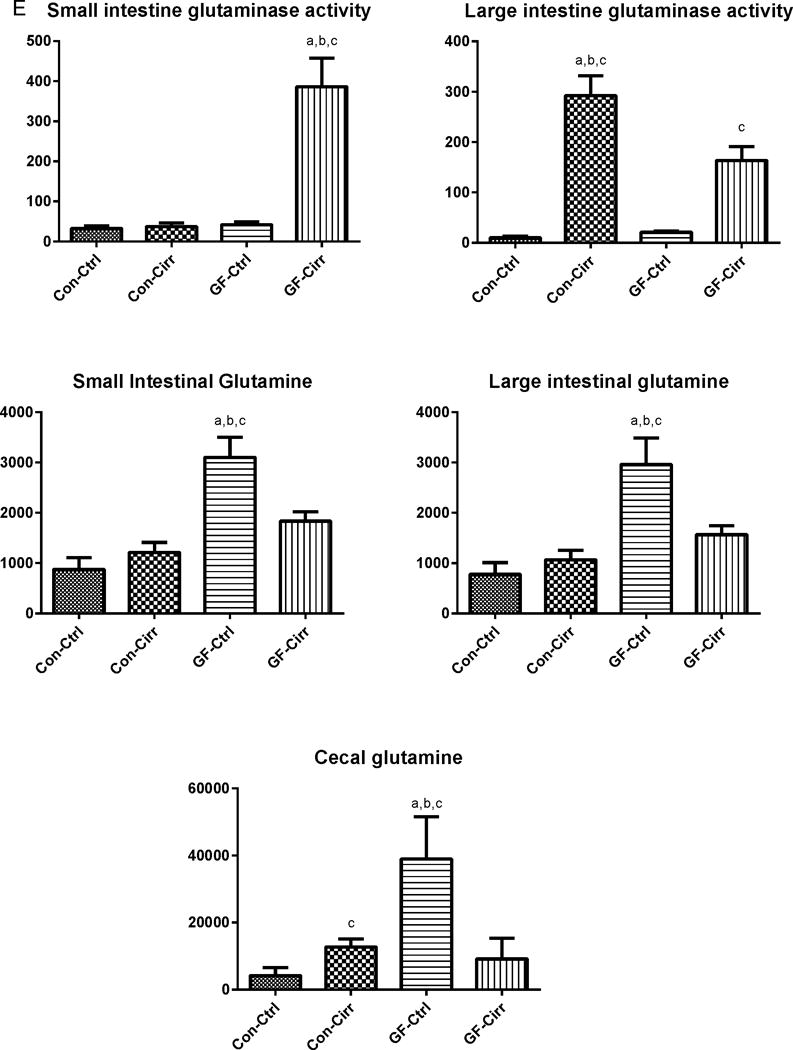
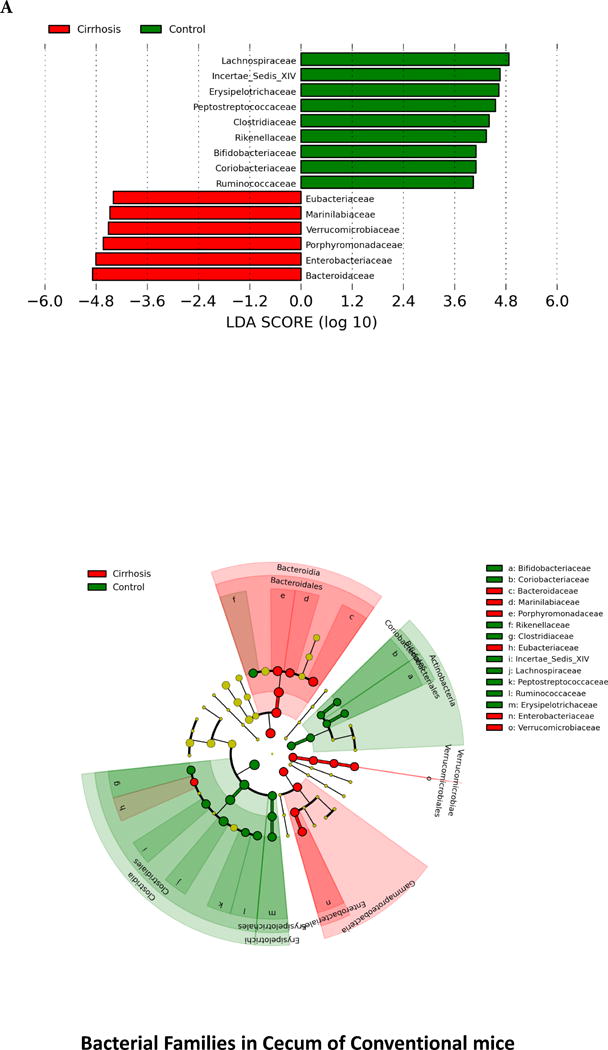
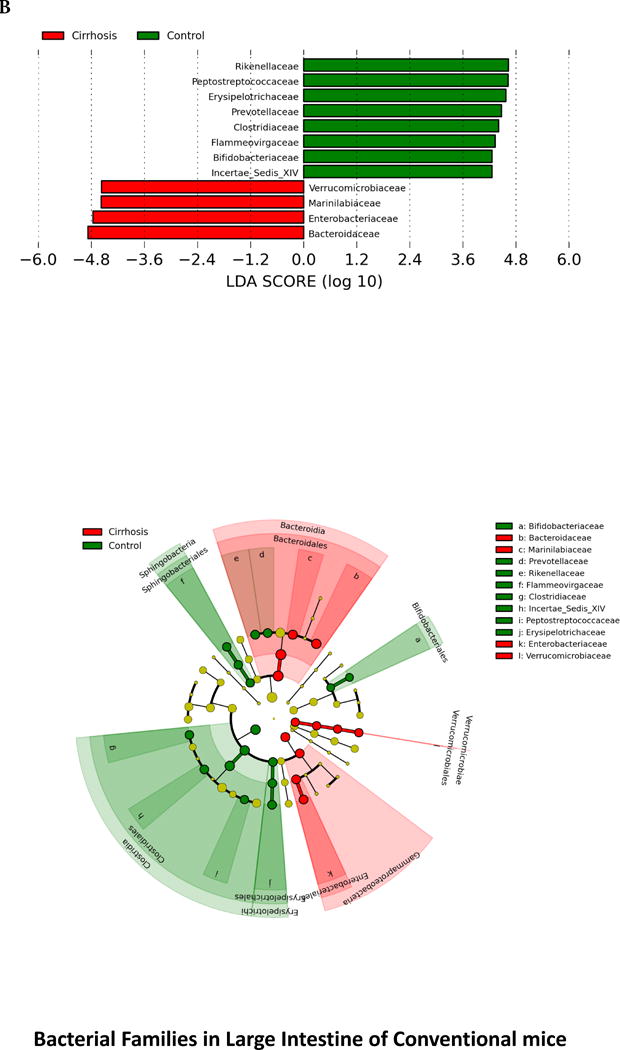
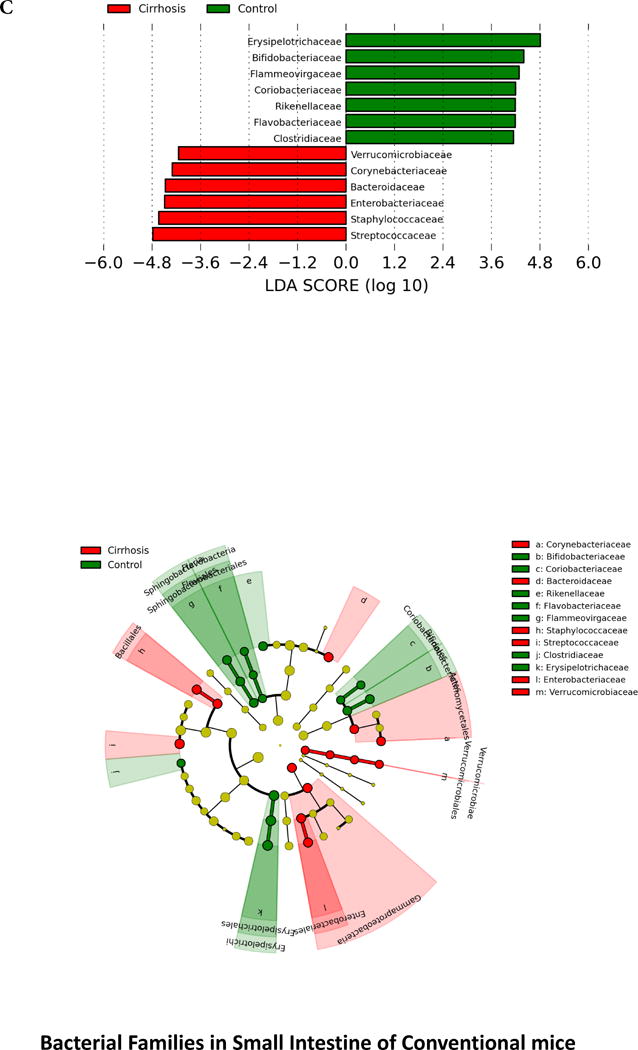
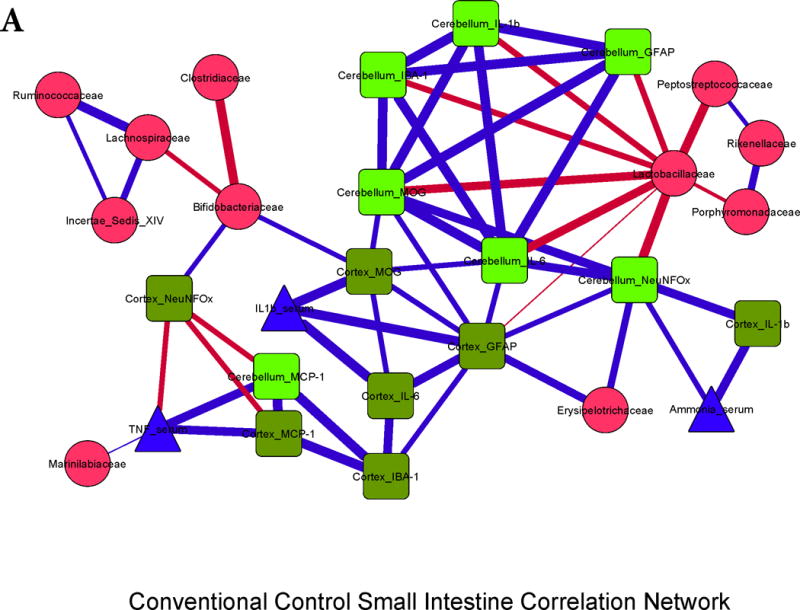
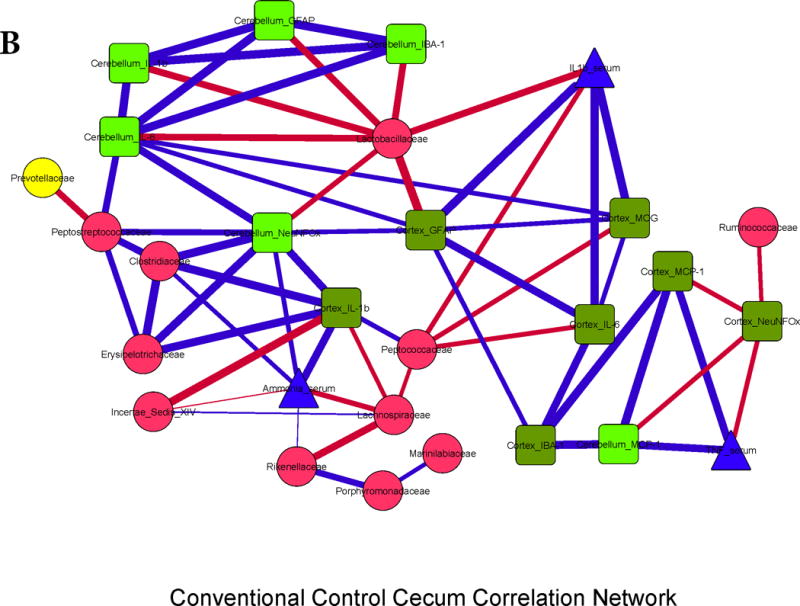
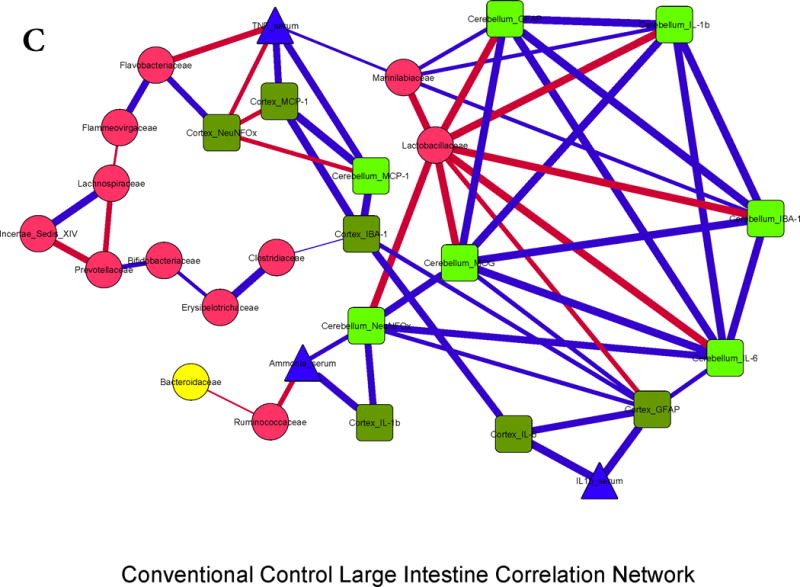
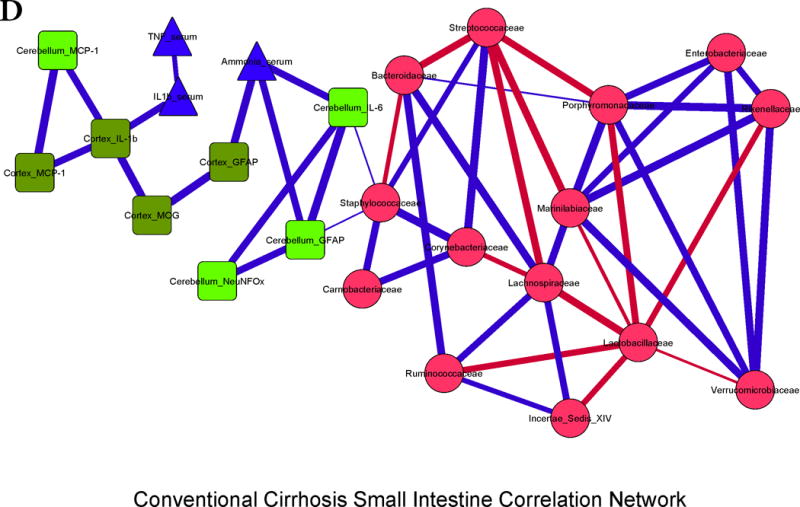
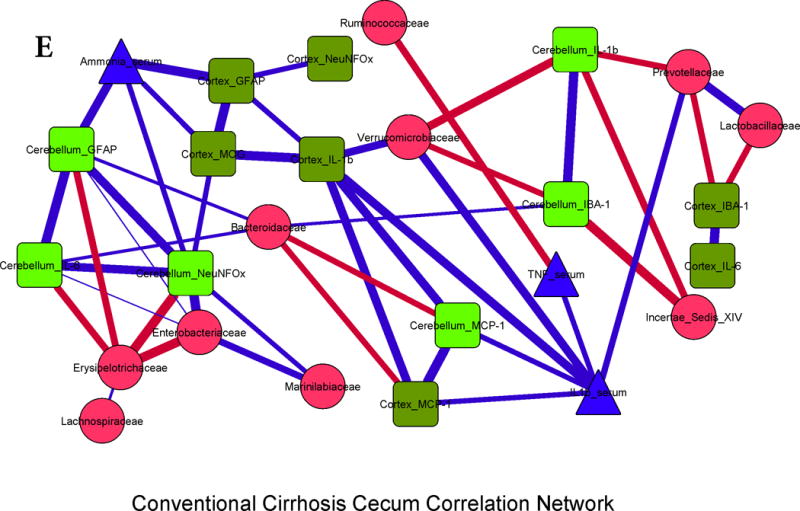
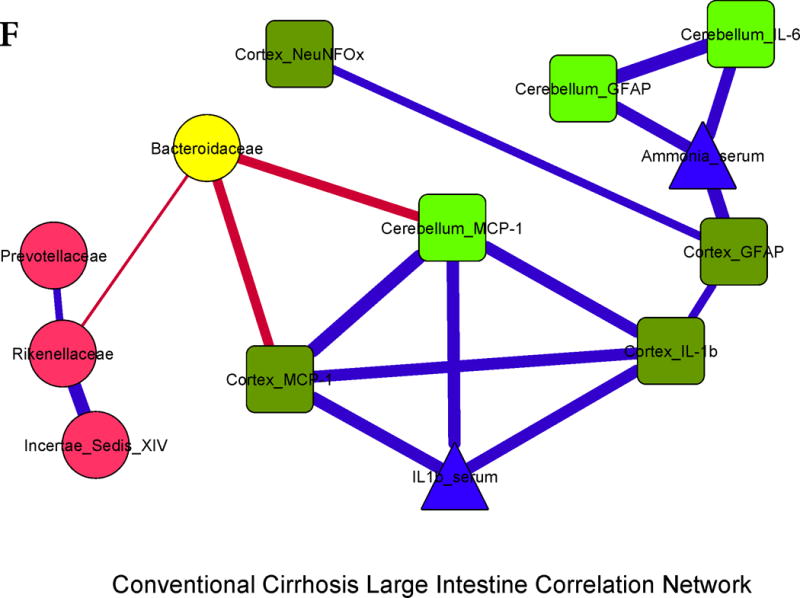
The mechanisms behind the development of hepatic encephalopathy (HE) are unclear, although hyperammonemia and systemic inflammation through gut dysbiosis have been proposed. The aim of this work was to define the individual contribution of hyperammonemia and systemic inflammation on neuroinflammation in cirrhosis using germ-free (GF) and conventional mice. GF and conventional C57BL/6 mice were made cirrhotic using CCl4 gavage. These were compared to their noncirrhotic counterparts. Intestinal microbiota, systemic and neuroinflammation (including microglial and glial activation), serum ammonia, intestinal glutaminase activity, and cecal glutamine content were compared between groups. GF cirrhotic mice developed similar cirrhotic changes to conventional mice after 4 extra weeks (16 vs. 12 weeks) of CCl4 gavage. GF cirrhotic mice exhibited higher ammonia, compared to GF controls, but this was not associated with systemic or neuroinflammation. Ammonia was generated through increased small intestinal glutaminase activity with concomitantly reduced intestinal glutamine levels. However, conventional cirrhotic mice had intestinal dysbiosis as well as systemic inflammation, associated with increased serum ammonia, compared to conventional controls. This was associated with neuroinflammation and glial/microglial activation. Correlation network analysis in conventional mice showed significant linkages between systemic/neuroinflammation, intestinal microbiota, and ammonia. Specifically beneficial, autochthonous taxa were negatively linked with brain and systemic inflammation, ammonia, and with Staphylococcaceae, Lactobacillaceae, and Streptococcaceae. Enterobacteriaceae were positively linked with serum inflammatory cytokines.

Conclusion: Gut microbiota changes drive development of neuroinflammatory and systemic inflammatory responses in cirrhotic animals. (Hepatology 2016;64:1232-1248).


Conflict of interest statement

No competing interests exist for any author.

Figures

Figure 1
Figure 1. Ammonia and inflammation-related results
Legends common to all figures: Data is shown as mean±SEM, ap<0.05 on one-way ANOVA, bp<0.05 GF vs conventional, cp<0.05 control vs. cirrhosis within that group Con: conventional, Ctrl: control or non-cirrhotic, GF: Germ-free, Cirr: cirrhotic, Cbl: cerebellum, Cx: cerebral cortex, MCP-1: monocyte chemoattractant protein-1, GFAP: glial fibrillary acidic protein, MOG: myelin oligodendrocyte glycoprotein IBA-1: microglial ionized calcium binding adaptor molecule 1, NeuNFox: neuronal nuclei Fox3 A. Changes in mRNA expression in the mouse cerebellum: Conventional cirrhotic mice had the highest expression of IL-1b, MCP-1 along with IBA-1 and GFAP compared to other groups. Both conventional groups had higher expression of MCP-1, GFAP and IBA-1 compared to germ-free groups (p<0.002 for all comparisons). No changes within the germ-free groups were seen. No significant differences in MOG or NeuNFox were identified. B. Changes in mRNA expression in the mouse cerebral cortex: Similar to the cerebellum, conventional cirrhotic mice had the highest expression of IL-1balong with IBA-1 and GFAP compared to other groups. Both conventional groups had higher expression of MCP-1, GFAP and IBA-1 compared to germ-free groups (p<0.005 for all comparisons). No changes within the germ-free groups were seen. No significant differences in MCP-1, MOG or NeuNFox were identified. C. Changes in brain protein expression in cerebellum and cortex: Pro-inflammatory cytokines were significantly higher in the cortex and cerebellum in conv-cirr compared to others (ANOVA p<0.001 in all except TNF-α where it was p<0.03). In contrast, the anti-inflammatory cytokine IL-10 was the highest in conventional controls and reduced with the development of cirrhosis. All cytokines (pro and anti-inflammatory) were significantly higher in conventional compared to GF mice. No differences within GF and GF-cirr mice were seen while apart from cortical IL-10, all conv-cirr mice had significantly different cytokine expression compared to their respective controls. D. Changes in serum markers: A significant increase in serum IL-1b and TNF-α were seen in conventional cirrhotic mice compared to other groups. Serum ammonia was the lowest in germ-free controls and highest in conventional cirrhotics. Serum ammonia levels were significantly higher in GF-cirr compared to GF (p<0.0001), in conv-cirr compared to GF-cirr (p=0.002), and in conv-cirr compared to conv-control (p<0.001). Delta ammonia was significantly higher in GF mice compared to conventional mice (p=0.02). E. Changes in glutaminase activity and glutamine content: A significantly increased glutaminase activity was seen in the small intestine of GF-cirr mice (p<0.003) compared to the other groups. In the large intestine, both cirrhotic groups had significantly higher glutaminase activity compared to non-cirrhotic ones (p<0.001). Conv-cirr had a significantly higher large intestinal glutaminase activity compared to GF-cirr (p=0.03). Glutamine content was highest in GF-control mice which reduced significantly after development of cirrhosis (p=0.01). In contrast, cecal glutamine increased after cirrhosis development in conventional mice (p=0.02). In the small intestine and large intestine, the highest glutamine was again seen in conventional mice compared to the rest (p=0.005 small and p=0.002 large intestine). This was also higher compared to conventional groups (p=0.01 in both intestinal contents) and in GF-cirrhotic compared to control mice (p<0.001 in both intestinal contents). There was no significant difference in glutamine content of small and large intestines between the two conventional groups.
Figure 2
Figure 2. Microbial composition changes between conventional control mice compared to those with CCL4-induced cirrhosis
Legend common to all sub-parts: LEfSe predictions for bacterial families. LDA score represents log changes in relative bacterial family representation. The cladogram shows the phylogenetic relationship between the bacterial families. LDA, linear discriminant analysis, red=cirrhotic mice, green=control mice 2A. LEfSe predictions for bacterial families found in Cecum 2B. LEfSe predictions for bacterial families found in large intestine 2C. LEfSe predictions for bacterial families found in small intestine
Figure 3
Figure 3. Correlation networks between microbiota, systemic and neuro-inflammatory markers in conventional mice
Legends common to all sub-parts: Red nodes: stool bacterial families, light green: cerebellar markers, dark green: cortical markers, blue nodes: serum results. MCP-1: monocyte chemoattractant protein-1, GFAP: glial fibrillary acidic protein, MOG: myelin oligodendrocyte glycoprotein IBA-1: microglial ionized calcium binding adaptor molecule 1, NeuNFox: neuronal nuclei Fox3 In all correlation networks, blue lines joining nodes represent positive correlations between those nodes while red lines indicate negative correlations. All correlations represented are significant at p<0.01 with a correlation coefficient of r>0.6 or <−0.6. Thick correlation lines indicate p<0.001 while thin lines indicate p values between 0.01 and 0.001. 3A. Control small intestine: Cerebellar and cortical inflammatory markers were positively correlated with glial, microglial, oligodendrocyte and neuronal markers as well as with systemic inflammatory cytokines. These markers were negatively correlated with Lactobacillaceae and positively with Erysipelothricaceae. Ammonia was positively correlated with cortical IL-1β. 3B. Control cecum: Similar to the small intestine, brain markers were positively linked to each other, to serum ammonia and peripheral inflammatory cytokines. Brain inflammatory cytokines and neuronal markers, and ammonia were negatively linked with autochthonous bacterial families (Lactobacillaceae, Ruminococcaceae, Lachnospiraceae and Clostridiales XIV) and positively with Erysipelothricaceae and Clostridiaceae. 3C. Control large intestine: Similar trends to the small intestine and cecum were seen with regards to inter-relationship between brain activation and inflammatory markers with serum inflammation and ammonia. Also the negative relationship between autochthonous bacteria (Lactobacillaceae and Ruminococcacae) with ammonia and brain markers of inflammation, microglial and glial activation was again seen. 3D. Cirrhosis small intestine: There was a positive correlation between ammonia and brain inflammation and glial activation markers. Brain inflammation was linked with serum inflammatory cytokines and with Staphylococcaceae. Lactobacillaceae and Streptococcaceae were negatively linked with autochthonous bacterial families and positively with Staphylococcaceae, while Porphyromonadaceae, Enterobacteriaceae and Rikenellaceae were positively linked with each other. 3E. Cirrhosis cecum: Positive linkages within brain inflammatory markers, ammonia and serum inflammation were seen. Autochthonous bacteria (Ruminococcaceae, Clostriales XIV) and Bacteroidaceae, Erysipelothriaceae, were negatively linked with systemic and cerebellar inflammation, while Enterobacteriaceae were positively correlated. 3F. Cirrhosis large intestine: Similar inter-relationships between brain inflammatory markers and serum inflammation and ammonia were found. Similar to the cecal findings, Bacteroidaceae were negatively correlated with brain inflammation.

References

    1. Vilstrup H, Amodio P, Bajaj J, Cordoba J, Ferenci P, Mullen KD, Weissenborn K, et al. Hepatic encephalopathy in chronic liver disease: 2014 Practice Guideline by the American Association for the Study of Liver Diseases and the European Association for the Study of the Liver. Hepatology. 2014;60:715–735. - PubMed
    1. Bajaj JS, Heuman DM, Hylemon PB, Sanyal AJ, White MB, Monteith P, Noble NA, et al. Altered profile of human gut microbiome is associated with cirrhosis and its complications. J Hepatol. 2014;60:940–947. - PMC - PubMed
    1. Shawcross DL, Davies NA, Williams R, Jalan R. Systemic inflammatory response exacerbates the neuropsychological effects of induced hyperammonemia in cirrhosis. J Hepatol. 2004;40:247–254. - PubMed
    1. Romero-Gomez M, Jover M, Galan JJ, Ruiz A. Gut ammonia production and its modulation. Metab Brain Dis. 2009;24:147–157. - PubMed
    1. Tenorio-Laranga J, Montoliu C, Urios A, Hernandez-Rabaza V, Ahabrach H, Garcia-Horsman JA, Felipo V. The expression levels of prolyl oligopeptidase responds not only to neuroinflammation but also to systemic inflammation upon liver failure in rat models and cirrhotic patients. J Neuroinflammation. 2015;12:183. - PMC - PubMed

Publication types