

Spatial distributions of phosphorylated membrane proteins aquaporin 0 and MP20 across young and aged human lenses
- PMID: 27339748
- PMCID: PMC5791148
- DOI: 10.1016/j.exer.2016.06.015
Spatial distributions of phosphorylated membrane proteins aquaporin 0 and MP20 across young and aged human lenses
Abstract
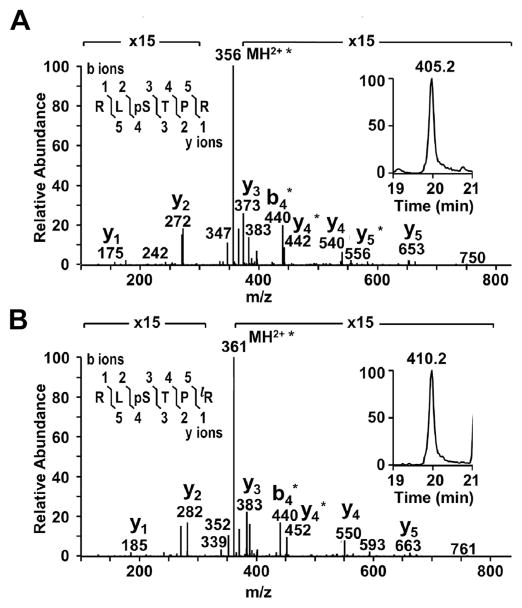
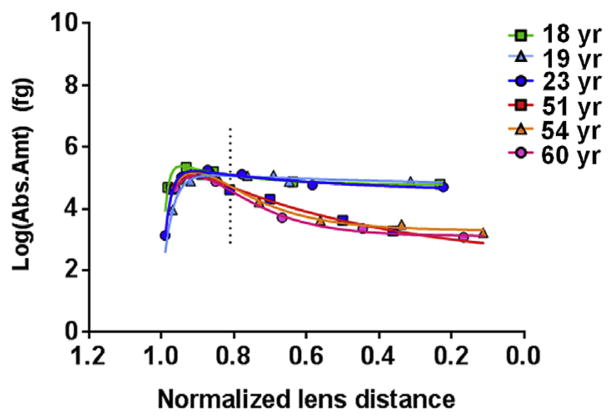
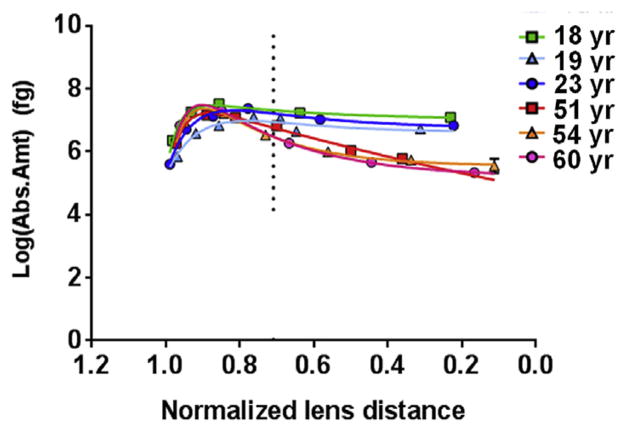
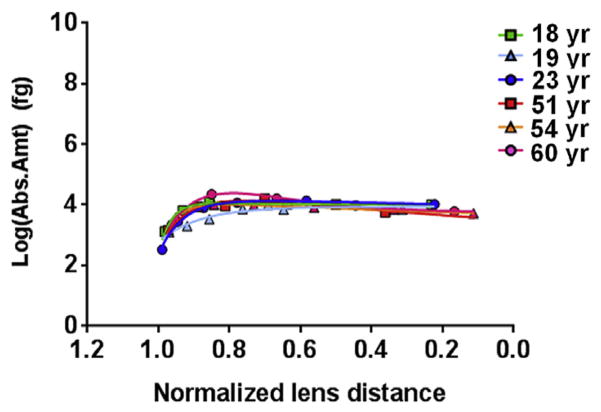
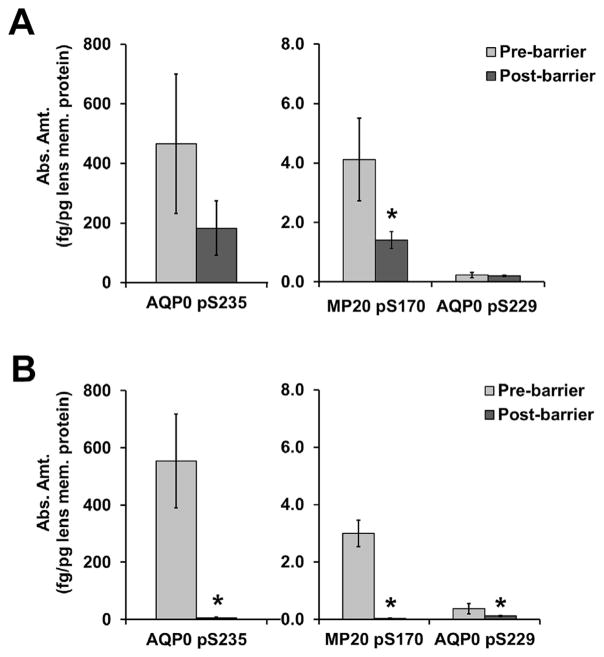
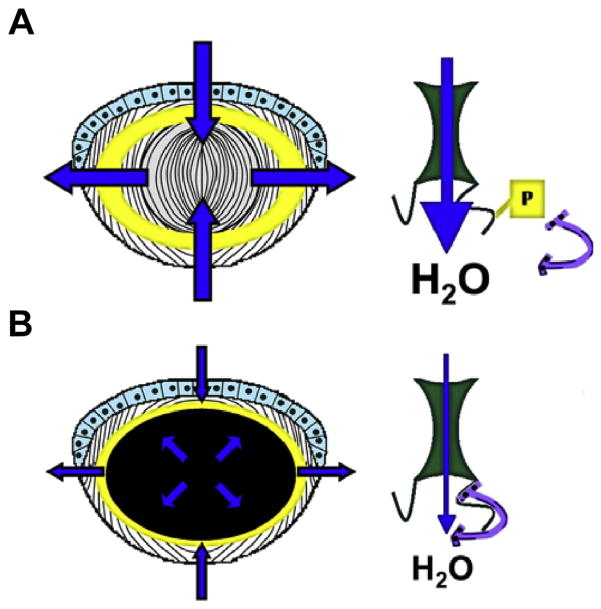
In the human ocular lens it is now realized that post-translational modifications can alter protein function and/or localization in fiber cells that no longer synthesize proteins. The specific sites of post-translational modification to the abundant ocular lens membrane proteins AQP0 and MP20 have been previously identified and their functional effects are emerging. To further understand how changes in protein function and/or localization induced by these modifications alter lens homeostasis, it is necessary to determine the spatial distributions of these modifications across the lens. In this study, a quantitative LC-MS approach was used to determine the spatial distributions of phosphorylated AQP0 and MP20 peptides from manually dissected, concentric layers of fiber cells from young and aged human lenses. The absolute amounts of phosphorylation were determined for AQP0 Ser235 and Ser229 and for MP20 Ser170 in fiber cells from the lens periphery to the lens center. Phosphorylation of AQP0 Ser229 represented a minor portion of the total phosphorylated AQP0. Changes in spatial distributions of phosphorylated APQ0 Ser235 and MP20 Ser170 correlated with regions of physiological interest in aged lenses, specifically, where barriers to water transport and extracellular diffusion form.
Keywords: Aquaporin 0; MP20; Mass spectrometry; Membrane protein; Ocular lens; Phosphorylation.
Copyright © 2016 Elsevier Ltd. All rights reserved.
Figures
Similar articles
-
The Role of Aquaporins in Ocular Lens Homeostasis.Int J Mol Sci. 2017 Dec 12;18(12):2693. doi: 10.3390/ijms18122693. Int J Mol Sci. 2017. PMID: 29231874 Free PMC article. Review.
-
Spatial analysis of human lens aquaporin-0 post-translational modifications by MALDI mass spectrometry tissue profiling.Exp Eye Res. 2011 Dec;93(6):912-20. doi: 10.1016/j.exer.2011.10.007. Epub 2011 Oct 25. Exp Eye Res. 2011. PMID: 22036630 Free PMC article.
-
Post-translational modifications of aquaporin 0 (AQP0) in the normal human lens: spatial and temporal occurrence.Biochemistry. 2004 Aug 3;43(30):9856-65. doi: 10.1021/bi0496034. Biochemistry. 2004. PMID: 15274640
-
MALDI Imaging Mass Spectrometry Spatially Maps Age-Related Deamidation and Truncation of Human Lens Aquaporin-0.Invest Ophthalmol Vis Sci. 2015 Nov;56(12):7398-405. doi: 10.1167/iovs.15-18117. Invest Ophthalmol Vis Sci. 2015. PMID: 26574799 Free PMC article.
-
Structural function of MIP/aquaporin 0 in the eye lens; genetic defects lead to congenital inherited cataracts.Handb Exp Pharmacol. 2009;(190):265-97. doi: 10.1007/978-3-540-79885-9_14. Handb Exp Pharmacol. 2009. PMID: 19096783 Review.
Cited by
-
Proteomic characterization of the human lens and Cataractogenesis.Expert Rev Proteomics. 2021 Feb;18(2):119-135. doi: 10.1080/14789450.2021.1913062. Epub 2021 Apr 14. Expert Rev Proteomics. 2021. PMID: 33849365 Free PMC article. Review.
-
Spatially Resolved Proteomics Reveals Lens Suture-Related Cell-Cell Junctional Protein Distributions.Invest Ophthalmol Vis Sci. 2023 Aug 1;64(11):28. doi: 10.1167/iovs.64.11.28. Invest Ophthalmol Vis Sci. 2023. PMID: 37603353 Free PMC article.
-
A novel mutation of LIM2 causes autosomal dominant membranous cataract in a Chinese family.Int J Ophthalmol. 2020 Oct 18;13(10):1512-1520. doi: 10.18240/ijo.2020.10.02. eCollection 2020. Int J Ophthalmol. 2020. PMID: 33078099 Free PMC article.
-
The Role of Aquaporins in Ocular Lens Homeostasis.Int J Mol Sci. 2017 Dec 12;18(12):2693. doi: 10.3390/ijms18122693. Int J Mol Sci. 2017. PMID: 29231874 Free PMC article. Review.
-
Spatiotemporal changes in the human lens proteome: Critical insights into long-lived proteins.Prog Retin Eye Res. 2020 May;76:100802. doi: 10.1016/j.preteyeres.2019.100802. Epub 2019 Nov 6. Prog Retin Eye Res. 2020. PMID: 31704338 Free PMC article. Review.
References
-
- Al-Ghoul KJ, Kirk T, Kuszak AJ, Zoltoski RK, Shiels A, Kuszak JR. Lens structure in MIP-deficient mice. Anat Rec A Discov Mol Cell Evol Biol. 2003;273:714–730. http://dx.doi.org/10.1002/ar.a.10080. - DOI - PubMed
-
- Ball LE, Garland DL, Crouch RK, Schey KL. Post-translational modifications of aquaporin 0 (AQP0) in the normal human lens: spatial and temporal occurrence. Biochemistry. 2004;43:9856–9865. http://dx.doi.org/10.1021/bi0496034. - DOI - PubMed
-
- Bassnett S. Lens organelle degradation. Exp Eye Res. 2002;74:1–6. http://dx.doi.org/10.1006/exer.2001.1111. - DOI - PubMed
-
- Broekhuyse RM, Kuhlmann ED, Stols AL. Lens membranes II. Isolation and characterization of the main intrinsic polypeptide (MIP) of bovine lens fiber membranes. Exp Eye Res. 1976;23:365–371. - PubMed
-
- Brönstrup M. Absolute quantification strategies in proteomics based on mass spectrometry. Expert Rev Proteomics. 2004;1:503–512. http://dx.doi.org/10.1586/14789450.1.4.503. - DOI - PubMed
Publication types
MeSH terms
Substances
Grants and funding
LinkOut - more resources
Full Text Sources
Other Literature Sources
Medical
Molecular Biology Databases
Miscellaneous
