. 2016 Jun 24;352(6293):1535-42.
doi: 10.1126/science.aaf7419.

A sentinel goblet cell guards the colonic crypt by triggering Nlrp6-dependent Muc2 secretion

Affiliations

A sentinel goblet cell guards the colonic crypt by triggering Nlrp6-dependent Muc2 secretion

George M H Birchenough et al. Science. .

Abstract

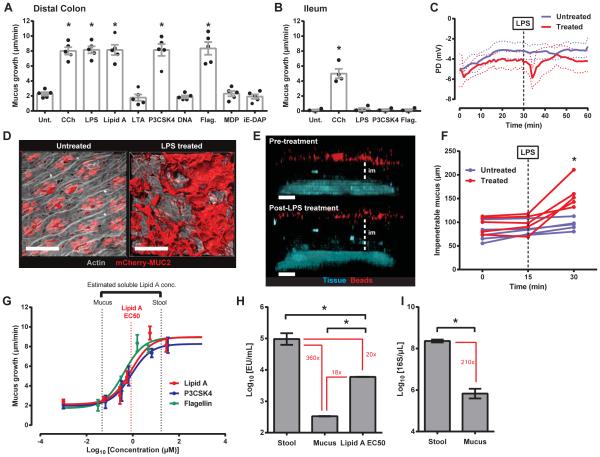
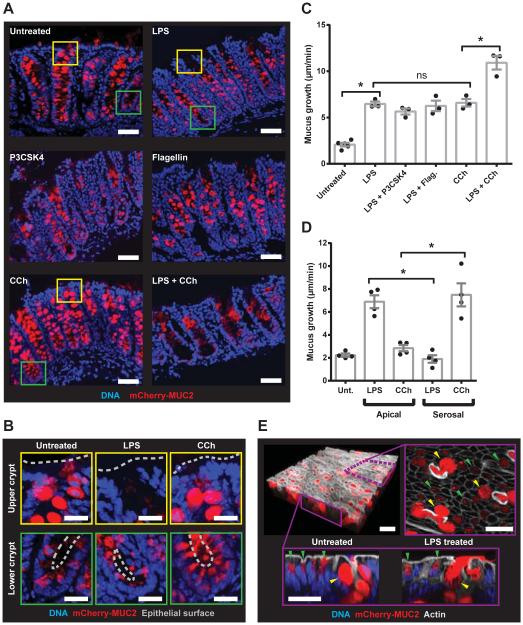
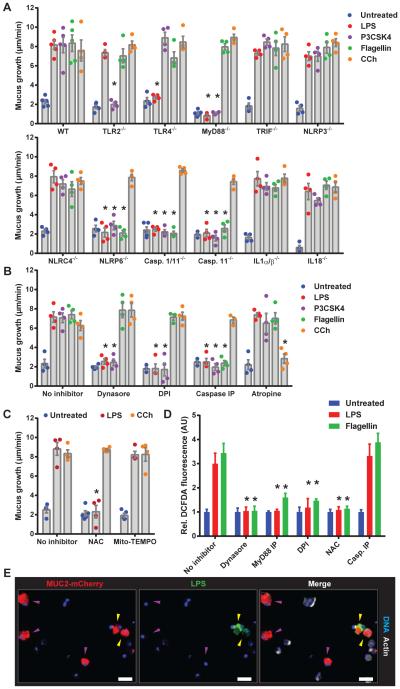
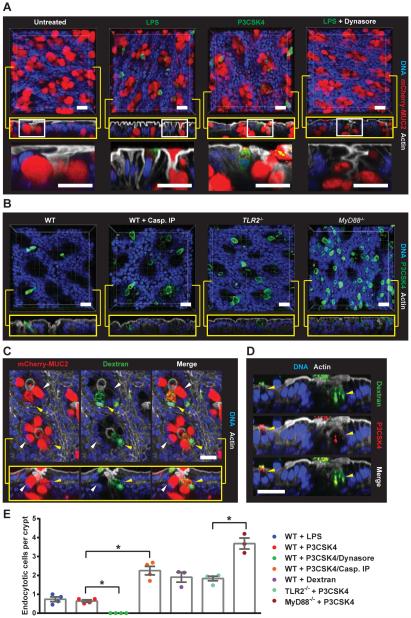
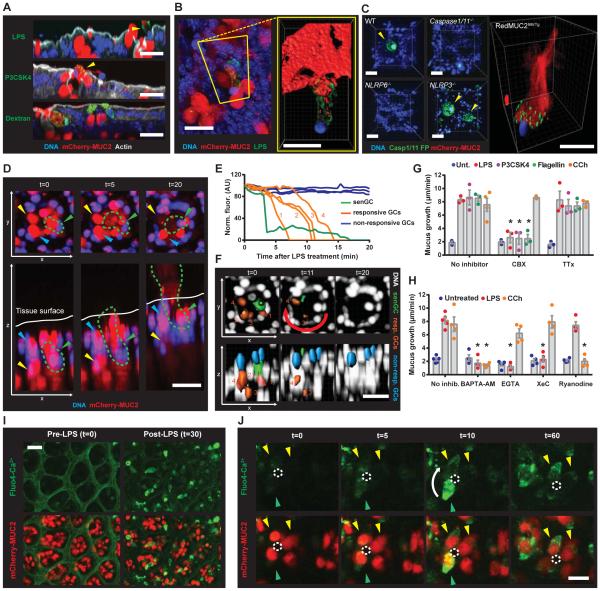
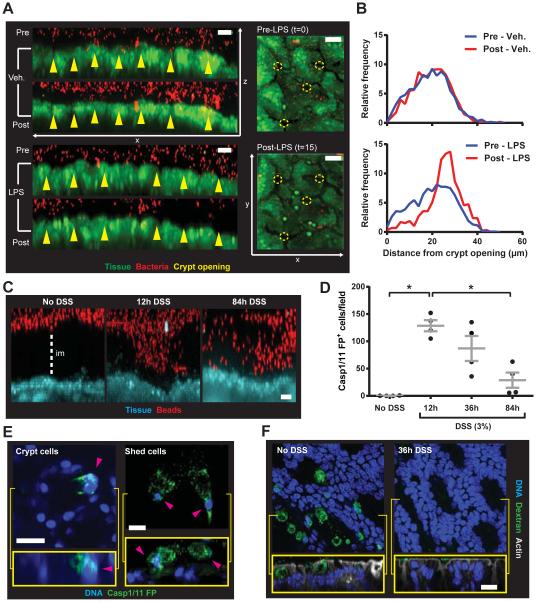
Innate immune signaling pathways contribute to the protection of host tissue when bacterially challenged. Colonic goblet cells are responsible for generating the two mucus layers that physically separate the luminal microbiota from the host epithelium. Analysis of colonic tissues from multiple mouse strains allowed us to identify a "sentinel" goblet cell (senGC) localized to the colonic crypt entrance. This cell nonspecifically endocytoses and reacts to the TLR2/1, TLR4, and TLR5 ligands by activating the Nlrp6 inflammasome downstream of TLR- and MyD88-dependent Nox/Duox reactive oxygen species synthesis. This triggers calcium ion-dependent compound exocytosis of Muc2 mucin from the senGC and generates an intercellular gap junction signal; in turn, this signal induces Muc2 secretion from adjacent goblet cells in the upper crypt, which expels bacteria. Thus, senGCs guard and protect the colonic crypt from bacterial intruders that have penetrated the inner mucus layer.


Figures

Fig. 1
Fig. 1. Select TLR-ligands induce Muc2 secretion in distal colon
(A-G) Intestinal explants treated with TLR-ligands or carbachol. (A, B) Quantification of mucus growth from distal colonic (A) or ileal (B) explants: untreated (Unt.), flagellin (Flag.). (C) PD measurement. (D) Confocal micrographs of RedMUC298trTg: actin (grey), mCherry-MUC2 (red). (E) Confocal z-stacks of tissue and 1 μm beads: tissue (blue), beads (red), impenetrable mucus (im). (F) Impenetrable mucus thickness. (G) Concentration-response curves: Lipid A EC50 (red dashed line), estimated mucus and stool Lipid A concentrations (black dashed lines). (H) LAL reactivity of stool, mucus, and Lipid A EC50 (0.85 μM): indicated fold differences between data (red). (I) Quantification of 16S in stool and mucus by qPCR: indicated fold differences (red). Errors SEM of 4-5 animals; significance by Dunnett (A, B, H), Sidak (F) or Mann-Whitney (I) test (* p<0.05); scales 50 μm.
Fig. 2
Fig. 2. TLR-ligand responsive GCs are localized to the upper crypt
(A-E) Colonic explants were treated with TLR-ligands or CCh (A) Confocal micrographs of cryosections from RedMUC298trTg: MUC2 (red), DNA (blue). (B) Magnified upper crypt (yellow boxes) or lower crypt (green boxes) in (A): epithelial surface (grey line). (C, D) Quantification of mucus growth rates. (E) Upper crypt GCs (yellow arrows) and inter-crypt GCs (green arrows) in RedMUC298trTg colon: confocal z-stack of tissue surface (upper left), x/y-axis cross-section (upper right), x/z-axis cross-sections (lower left/right), DNA (blue), mCherry-MUC2 (red), actin (grey). Errors SEM of 3-4 animals; significance by Tukey’s multiple comparison (* p<0.05). Scales 50 μm (A) or 20 μm (B, E).
Fig. 3
Fig. 3. TLR-ligand driven Muc2 secretion requires endocytosis, signaling and ROS synthesis upstream of inflammasome activation
Colonic explants (A-C) or cell suspensions (D, E) were treated with TLR-ligands or CCh. (A) Quantification of mucus growth in WT or KO or (B) pre-treated with inhibitors. (C) Quantification of mucus growth pre-treated with ROS scavengers. (D) DCFDA-fluorescence in epithelial cells pre-treated with inhibitors. (E) Confocal micrographs of RedMUC298trTg epithelial cells with Caspase inhibitory peptide (Casp. IP): non-endocytotic GCs (purple arrows), endocytotic GCs (yellow arrows), mCherry-MUC2 (red), DNA (blue) actin (grey). Errors SEM of 4-5 animals; significance by Dunnett’s multiple comparison of WT vs. KO (A) or no inhibitor vs. inhibitor (B, C, D) data (* p<0.05). Scales 50 μm.
Fig. 4
Fig. 4. TLR-ligands are endocytosed by a sentinel GC
(A-D) Colonic explants were treated as indicated, whole mounted and visualized by confocal microscopy: (A-C) x/y-axis cross-sections (upper), x/z-axis cross-sections (yellow boxes), DNA (blue), actin (grey). (A) RedMUC298trTg tissue: magnified x/z-axis cross-section regions indicated by white boxes (lower), LPS/P3CSK4 (green), mCherry-MUC2 (red). (B) WT with or without Casp. IP, Tlr2−/− , and MyD88−/− tissue: P3CSK4 (green). (C) RedMUC298trTg tissue: endocytotic GC (yellow arrow), non-endocytotic GC (white arrow), mCherry-MUC2 (red), dextran (green). (D) P3CSK4/dextran co-treated WT colon. (E) Quantification of endocytotic cells. Errors SEM of 3-4 animals; significance by Tukey’s multiple comparison (* p<0.05). Scales 20 μm.
Fig. 5
Fig. 5. Activated senGCs are expelled from the epithelium and trigger GJ and Ca2+-dependent Muc2 secretion from responsive upper crypt GCs
(A-J) Colonic explants were treated with TLR-ligands or CCh. (A, B) RedMUC298trTg tissue whole mounts visualized by confocal microscopy: DNA (blue), actin (grey), mCherry-MUC2 (red), LPS/P3CSK4/dextran (green). (A) x/z-axis cross-sections showing expelled senGCs (yellow arrows). (B) Expelled senGC overview (left panel) and isosurface enhanced view (right panel, yellow box). (C) Localization of inflammasome activity after LPS treatment of WT, KO and RedMUC298trTg tissue: Caspase1/11 fluorogenic probe (Casp1/11 FP, green), DNA (blue), senGCs (yellow arrows). (D-F) RedMUC298trTg tissue imaged by confocal microscopy (D) x/y-axis (upper) and x/z-axis views (lower) of a crypt at different time-points after LPS treatment: senGC (green arrow, green dashed line), responsive GC (yellow arrow), non-responsive GC (blue arrow). (E) Quantification of mCherry-MUC2 fluorescence of individual GCs from crypt in (D). (F) Fluorescent isosurfaces used to generate data in (E), responsive GC numbering corresponds to plots in (E), sequence of responsive cell secretion (red arrow): DNA (white), senGC (green), responsive GCs (orange), non-responsive GCs (blue). (G, H) Quantification of mucus growth with or without carbenoxolone (CBX), tetrodotoxin (TTx) or Ca2+-signaling inhibitors. (I, J) RedMUC298trTg tissue loaded with fluorogenic Ca2+ indicator (Fluo4) and imaged by confocal microscopy: Fluo4 (green), mCherry-MUC2 (red). (I) x/y-axis view of tissue pre- and post-treatment. (J) x/y-axis view of a crypt at different time-points after LPS treatment: sequence of GC secretion (white arrow), crypt opening (white dashed line), senGC (green arrow), responsive GCs (yellow arrows). Errors SEM of 4-5 animals; significance by Dunnett’s multiple comparison (* p<0.05). Scales 20 μm.
Figure 6
Figure 6. senGC activation removes bacteria from crypt openings ex vivo and is triggered by disruption of the inner colonic mucus layer in vivo
(A) Fluorescent bacteria (red) applied to colonic explant tissue (green) and imaged pre- (upper) and post- (lower) LPS or vehicle treatment: x/z-axis view (left), x/y-axis view (right), crypt openings (yellow arrows and circles). (B) Distribution of bacteria in relation to crypt openings as in (A). Data representative of 4 independent experiments. (C-F) Mice given 3% DSS in drinking water; samples collected after 0 (no DSS), 12, 36 and 84 h. (C) Confocal z-stacks of colonic explants and 1 μm beads: tissue (blue), beads (red), impenetrable mucus (im). (D) Quantification of cells with inflammasome activity (Casp1/11 FP+) detected in live tissue. (E) Casp1/11 FP+ cells (pink arrows) with GC morphology in the upper crypt (left) and shed from tissue (right): x/y-axis view (upper), x/z-axis view (lower). (F) Colonic explants were treated with fluorescent dextran, fixed, whole mounted, and visualized by confocal microscopy: x/y-axis view (upper), x/z-axis view (lower), DNA (blue), dextran (green), actin (grey). Errors SEM of 4 animals; significance by Dunn’s multiple comparison (* p<0.05); scales 20 μm.

Comment in

Similar articles

Cited by

References

    1. Johansson MEV, et al. Proc. Natl. Acad. Sci. USA. 2008;105:15064–15069. - PMC - PubMed
    1. Ambort D, et al. Proc. Natl. Acad. Sci. U. S. A. 2012;109:5645–5650. - PMC - PubMed
    1. Velcich A, et al. Science. 2002;295:1726–1729. - PubMed
    1. Rakoff-Nahoum S, et al. Cell. 2004;118:229–241. - PubMed
    1. Frantz AL, et al. Mucosal Immunol. 2012;5:501–512. - PMC - PubMed

Publication types

MeSH terms