

Methods to Assess Measurement Error in Questionnaires of Sedentary Behavior
- PMID: 27340315
- PMCID: PMC4915393
- DOI: 10.1080/02664763.2015.1117593
Methods to Assess Measurement Error in Questionnaires of Sedentary Behavior
Abstract
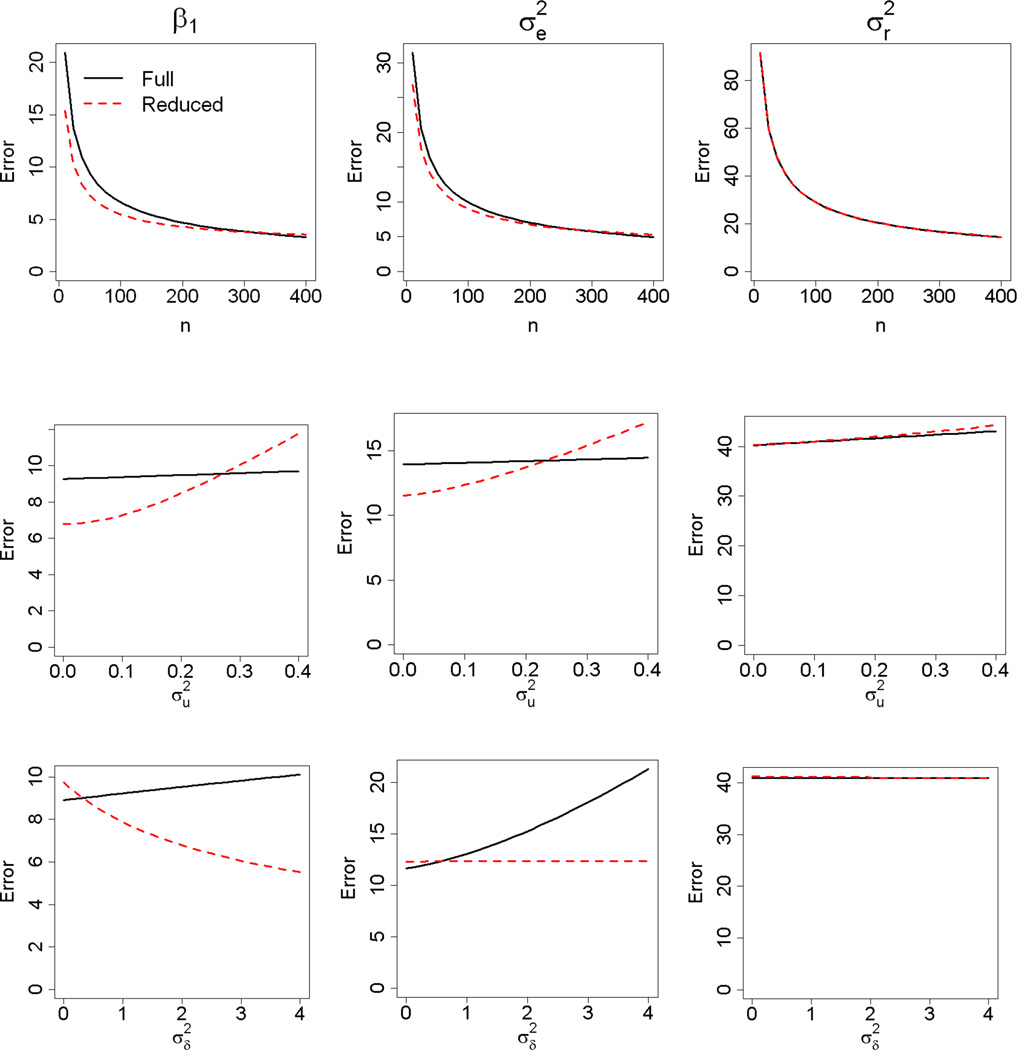
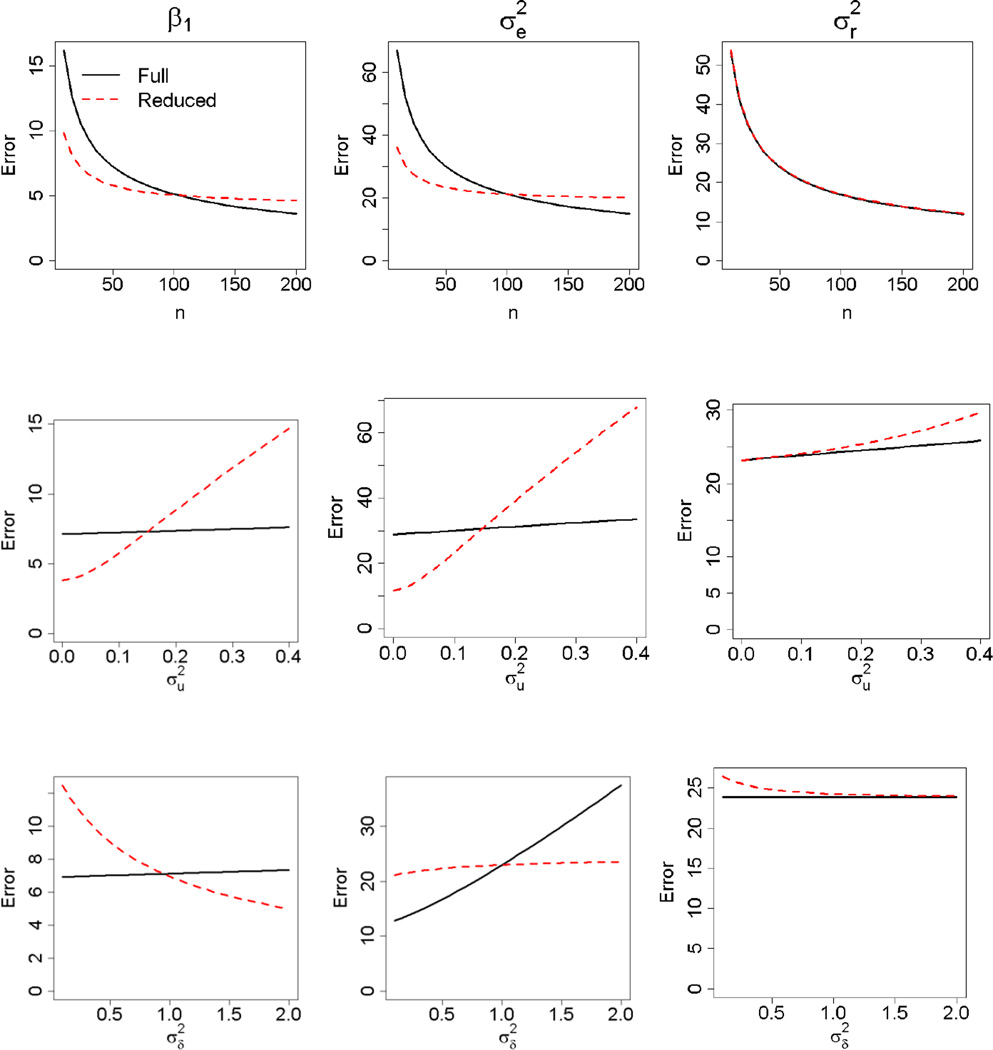
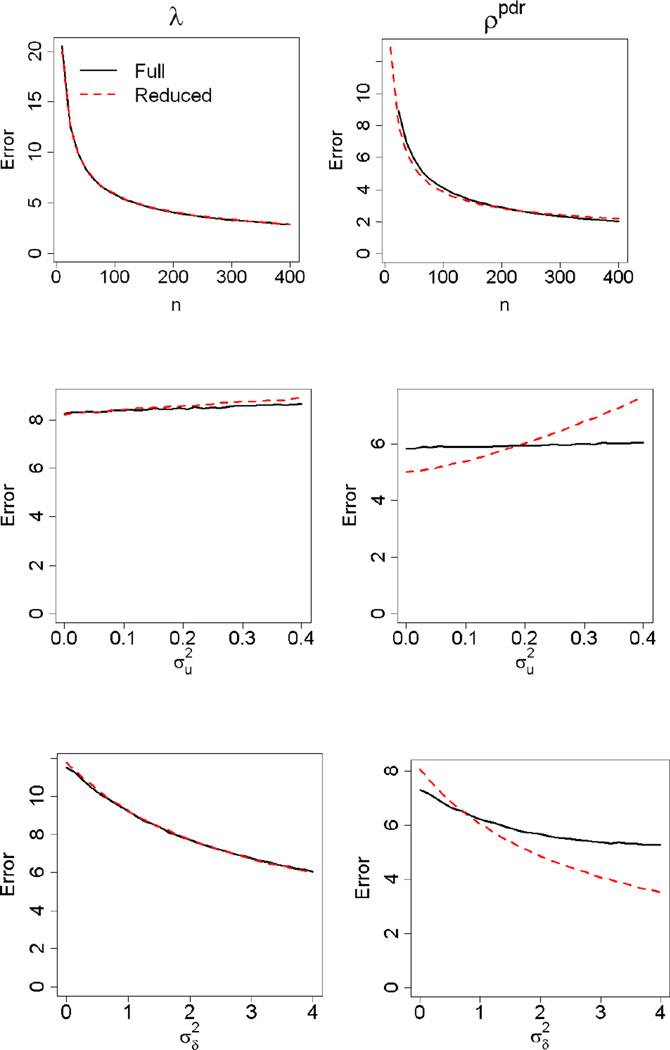
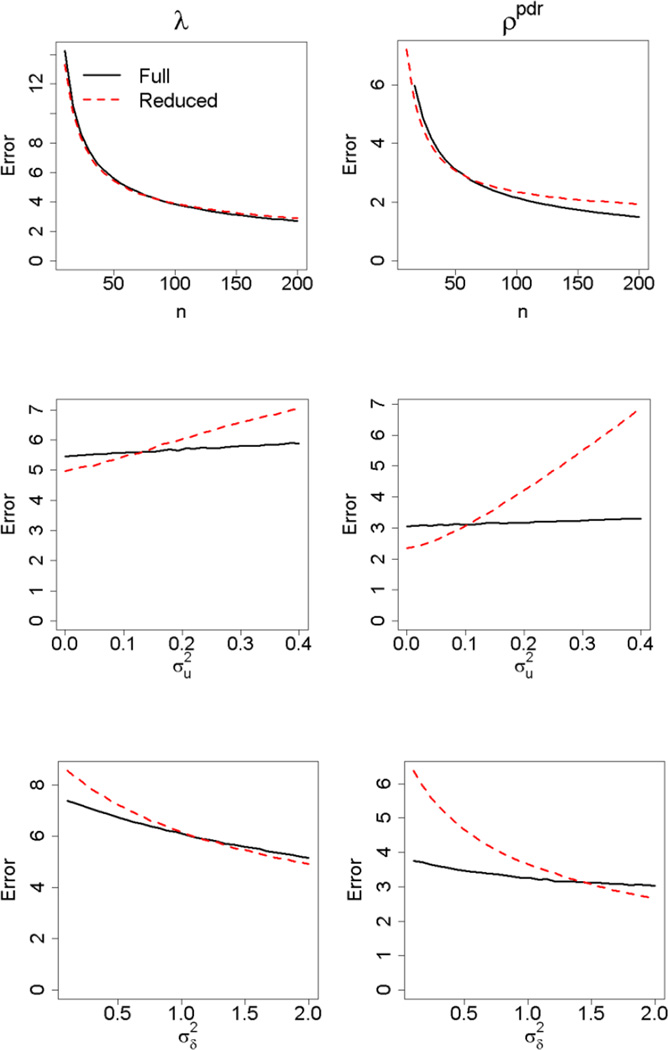
Sedentary behavior has already been associated with mortality, cardiovascular disease, and cancer. Questionnaires are an affordable tool for measuring sedentary behavior in large epidemiological studies. Here, we introduce and evaluate two statistical methods for quantifying measurement error in questionnaires. Accurate estimates are needed for assessing questionnaire quality. The two methods would be applied to validation studies that measure a sedentary behavior by both questionnaire and accelerometer on multiple days. The first method fits a reduced model by assuming the accelerometer is without error, while the second method fits a more complete model that allows both measures to have error. Because accelerometers tend to be highly accurate, we show that ignoring the accelerometer's measurement error, can result in more accurate estimates of measurement error in some scenarios. In this manuscript, we derive asymptotic approximations for the Mean-Squared Error of the estimated parameters from both methods, evaluate their dependence on study design and behavior characteristics, and offer an R package so investigators can make an informed choice between the two methods. We demonstrate the difference between the two methods in a recent validation study comparing Previous Day Recalls (PDR) to an accelerometer-based ActivPal.
Keywords: PDR; measurement error; questionnaire; sedentary.
Figures
Similar articles
-
Validation of a previous-day recall measure of active and sedentary behaviors.Med Sci Sports Exerc. 2013 Aug;45(8):1629-38. doi: 10.1249/MSS.0b013e3182897690. Med Sci Sports Exerc. 2013. PMID: 23863547 Free PMC article.
-
Adults' past-day recall of sedentary time: reliability, validity, and responsiveness.Med Sci Sports Exerc. 2013 Jun;45(6):1198-207. doi: 10.1249/MSS.0b013e3182837f57. Med Sci Sports Exerc. 2013. PMID: 23274615 Clinical Trial.
-
Level of agreement between methods for measuring moderate to vigorous physical activity and sedentary time in people with obstructive sleep apnea and obesity.Phys Ther. 2013 Jan;93(1):50-9. doi: 10.2522/ptj.20120123. Epub 2012 Sep 6. Phys Ther. 2013. PMID: 22956426
-
Using the SenseCam to improve classifications of sedentary behavior in free-living settings.Am J Prev Med. 2013 Mar;44(3):290-6. doi: 10.1016/j.amepre.2012.11.004. Am J Prev Med. 2013. PMID: 23415127
-
Accelerometer-based measures in physical activity surveillance: current practices and issues.Br J Sports Med. 2015 Feb;49(4):219-23. doi: 10.1136/bjsports-2013-093407. Epub 2014 Nov 4. Br J Sports Med. 2015. PMID: 25370153 Review.
References
-
- Atkinson G, Nevill AM. Statistical methods for assessing measurement error (reliability) in variables relevant to sports medicine. Sports medicine. 1998;26:217–238. - PubMed
-
- Bartlett JW, De Stavola BL, Frost C. Linear mixed models for replication data to efficiently allow for covariate measurement error. Statistics in Medicine. 2009;28:3158–3178. - PubMed
-
- Bowles HR. Measurement of active and sedentary behaviors: closing the gaps in self-report methods. Journal of physical activity & health. 2012;9(Suppl 1):S1–S4. - PubMed
-
- Buonaccorsi JD Eugene; Tosteson, Tor. ESTIMATION IN LONGITUDINAL RANDOM EFFECTS MODELS WITH MEASUREMENT ERROR. Statistica Sinica. 2000;10:885–903.
-
- Carroll RJ, Ruppert D, Stefanski LA, et al. Measurement Error in Nonlinear Models. Boca Raton: Chapman and Hall, CRC; 2006.
Grants and funding
LinkOut - more resources
Full Text Sources
Other Literature Sources