. 2014 Sep;10(9):683-690.
doi: 10.1038/nphys3040.

Forces driving epithelial wound healing

Affiliations

Forces driving epithelial wound healing

Agustí Brugués et al. Nat Phys. 2014 Sep.

Abstract

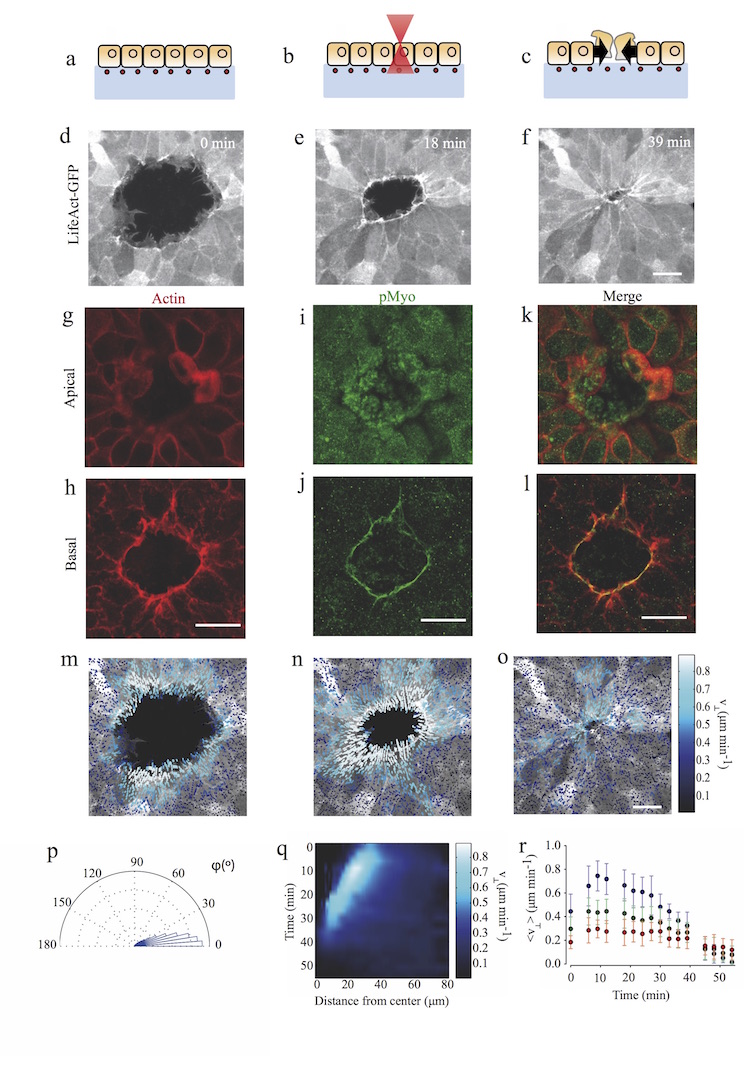
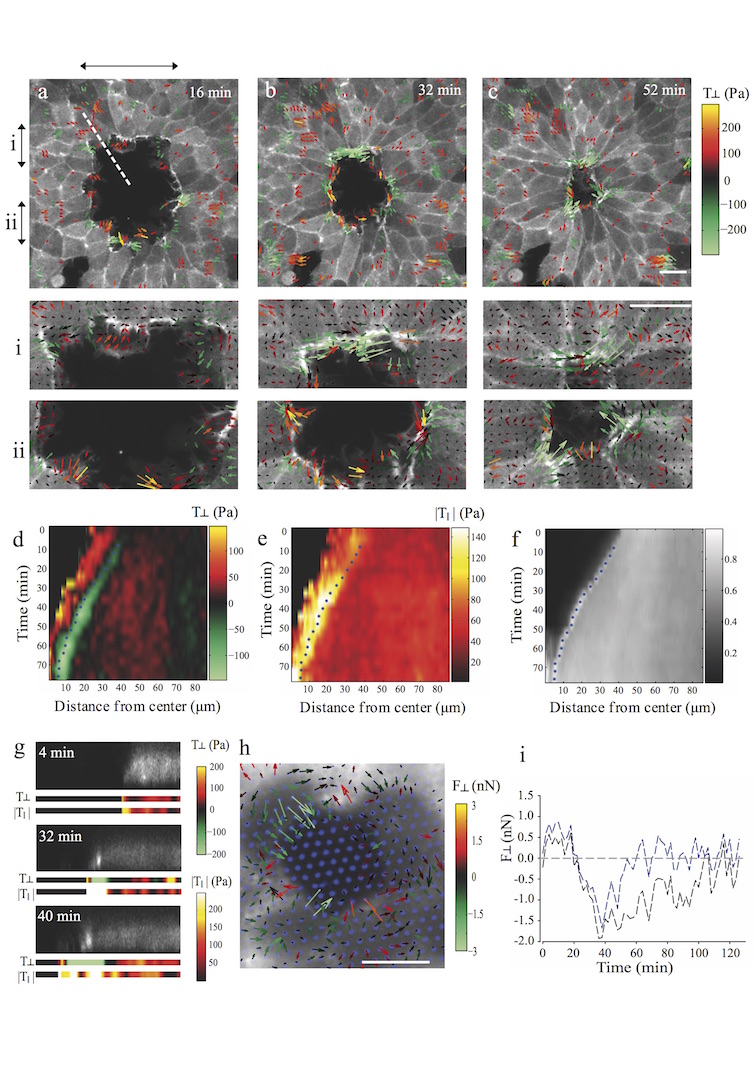
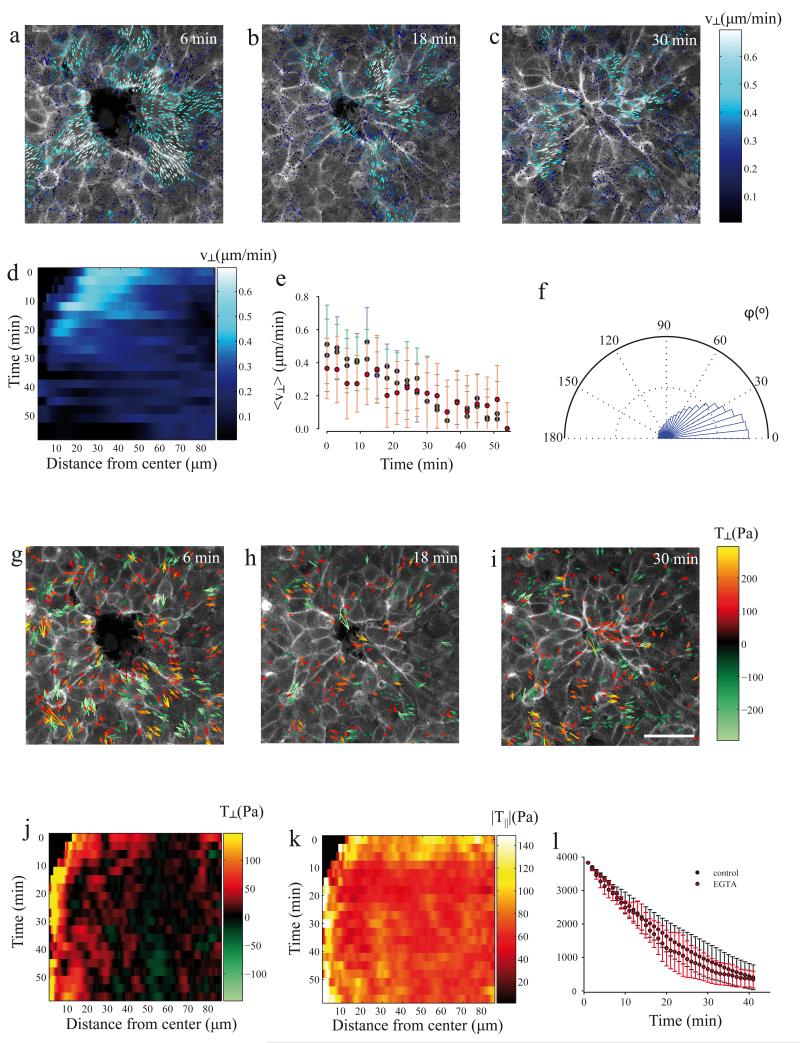
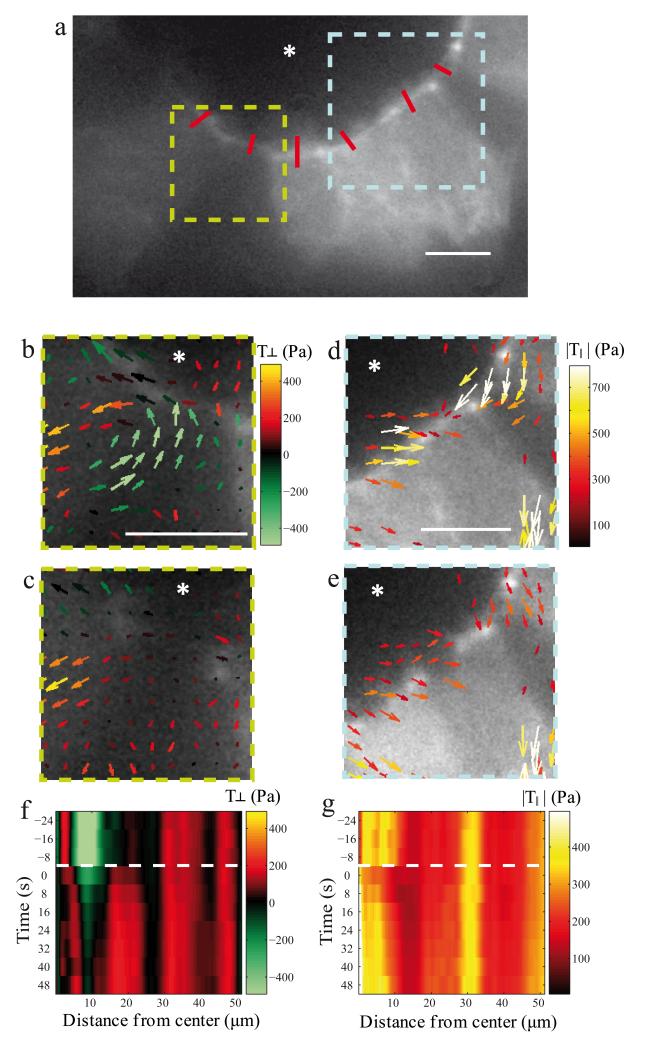
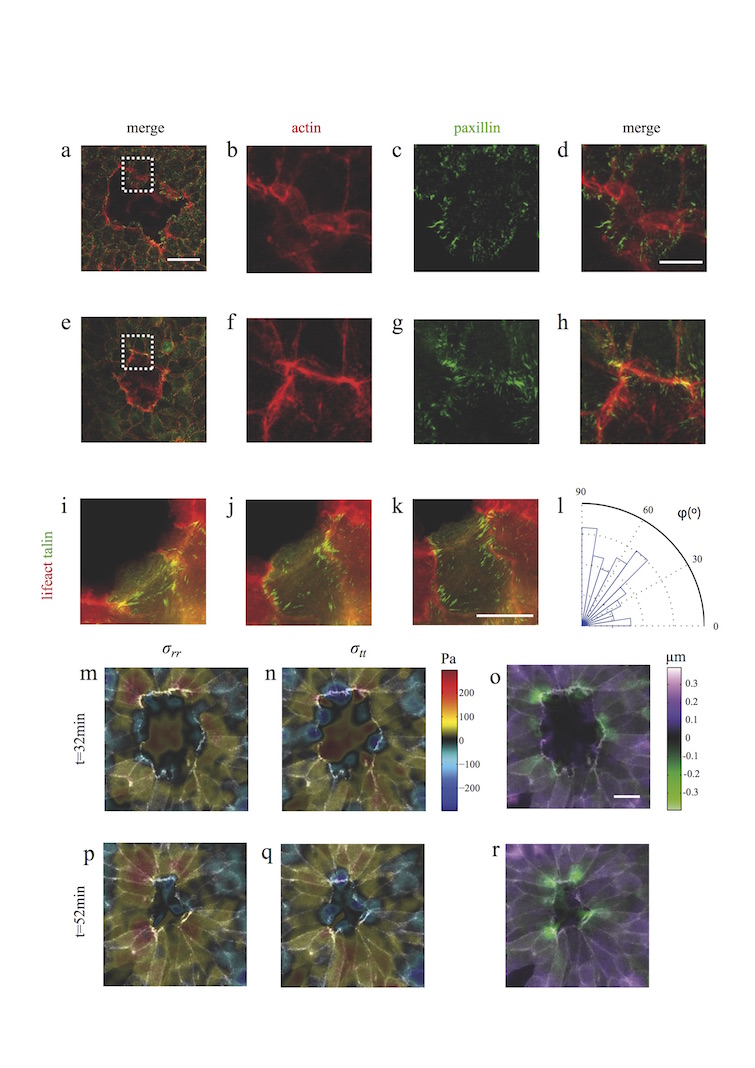
A fundamental feature of multicellular organisms is their ability to self-repair wounds through the movement of epithelial cells into the damaged area. This collective cellular movement is commonly attributed to a combination of cell crawling and "purse-string" contraction of a supracellular actomyosin ring. Here we show by direct experimental measurement that these two mechanisms are insufficient to explain force patterns observed during wound closure. At early stages of the process, leading actin protrusions generate traction forces that point away from the wound, showing that wound closure is initially driven by cell crawling. At later stages, we observed unanticipated patterns of traction forces pointing towards the wound. Such patterns have strong force components that are both radial and tangential to the wound. We show that these force components arise from tensions transmitted by a heterogeneous actomyosin ring to the underlying substrate through focal adhesions. The structural and mechanical organization reported here provides cells with a mechanism to close the wound by cooperatively compressing the underlying substrate.


Figures

Figure 1
Figure 1. Cell morphology and kinematics during wound healing
(a-c) Scheme of the experimental design. (d-f) Time course of wound closure in LifeAct-GFP MDCK cells. Images are maximum projections of confocal z-stacks. Staining of phalloidin and pMyo at the apical (g-k) and basal (h-l) planes. (m-o) Vectorial representation of cell velocities measured by PIV at the same time points as in d-f. (p) Distribution of the angle φ between cell velocities and the direction normal to the wound edge. Data are a pool of all time points for one experiment. (q) Kymograph of the radial component of cell velocities (see supplementary methods). (r) Time evolution of cell velocities as a function of the distance from the leading edge. The Time axis indicates the time after the beginning of image acquisition (~20 min after wounding). Each dataset represents the average radial velocity within concentric rings of width 15 μm (blue for cells located between 0-15 μm from the leading edge, green for 15-30 μm, red for 30-45 μm). Error bars represent standard deviation. Missing time points in (r) are due to image refocusing. Data for these time points have been interpolated in (q) to help visualization. All scale bars are 20μm.
Figure 2
Figure 2. Traction forces during wound healing
(a-c) Vectorial representation of traction forces in LifeAct-GFP MDCK cells. Color coding is based on the values of the radial component, with positive forces pointing away from the wound. For clarity, values between −100 and 100 Pa were not plotted. Panels labeled as i and ii show a close-up of the regions indicated by arrows in panels a-c. Scale bar is 20 μm. (d) Kymograph for radial traction component T. (e) Kymograph for tangential traction component T. (f) Kymograph of actin density based LifeAct-GFP fluorescence. Asterisks in panels d,e, and f show the position of the maximum actin density for each time point. (g) A confocal z-section of LifeAct-GFP along the dashed line shown in Fig. 2a. Radial and tangential traction forces along that dashed line are shown below LifeAct-GFP images. Total length is 68 μm. (h) Traction force maps obtained using micropillar arrays (blue). Scale bar is 10 μm. Forces are color-coded according to the radial component. (i) Time-evolution of the radial forces of two distinct pillars. Positive forces point towards the wound exterior, whereas negative forces point towards the wound interior.
Figure 3
Figure 3. Traction forces in the absence of an actomyosin ring
(a-c) Vectorial plot of velocities measured by PIV. (d) Kymograph of the radial component of velocities. (e) Time evolution of velocities averaged over adjacent rings of width 15 μm (blue for cells located between 0-15 μm from the leading edge, green for 15-30 μm, red for 30-45 μm). Error bars represent standard deviation. (f) Angular distribution of the angle φ between cell velocities and the direction normal to the wound edge. (g-i) Vectorial representation of measured tractions. Color coding is based on the values of the radial component. For clarity, values between −100 and 100 Pa were not plotted. Kymographs of radial (j) and tangential (k) components of traction forces. (l) Time evolution of the wound area in control cells and EGTA-treated cells. Error bars indicate standard deviation of n=5 (control) and n=6 (EGTA) samples. All scale bars are 40 μm.
Figure 4
Figure 4. Traction forces after laser ablation of the actomyosin ring
(a) Fluorescence image of LifeAct-GFP cells prior to laser ablation. Red segments mark the sites of ablation. (b-c) A region displaying inward-pointing tractions before (b) and after (c) ring ablation. (c) Immediately after ablation, normal tractions were abrogated. (d-e) A region with strong tangential tractions before (d) and after ablation (e). (e) Tangential tractions were strongly attenuated by ring ablation. For clarity, only forces forming angles of less than 45° with the tangent were plotted. (f-g) Kymograph showing the time evolution of radial (f) and tangential (g) forces before and after ablation. The cut was performed immediately before t=0s (dashed white line). All scale bars are 10 μm. Asterisks indicate the interior of the wound.
Figure 5
Figure 5. Force transmission from the ring to the substrate creates heterogeneous stresses and inward-pointing displacements of the underlying substrate
Representative immunofluorescence micrographs of paxillin and F-actin showing the characteristic structural organization of the leading edge during early (a-d) and late (e-h) stages of wound closure. (a-d) During initial stages, focal adhesions were localized at the tip of lamellipodia and were perpendicular to the leading edge. (e-h) During later stages, focal adhesions appeared under the actomyosin ring. (i-k) Time-lapse snap-shots of MDCK cells expressing LifeAct-Ruby and talin-GFP at three different time points of wound closure (see also Supplementary video 4). (l) Angular distribution of focal adhesion orientation with respect to the normal direction (0° is normal to the ring, n=112 focal adhesions from 5 experiments). The analysis is performed in a 3 μm thick band located immediately behind the ring (including the ring). (m,p) Radial normal stress and (n,q) tangential normal stress in the upper surface of gel during the latest stages of wound closure. (o,r) Radial displacement of the gel surface. Negative displacements point towards the wound. The two time points considered in panels m to r correspond to panels b and c in Fig. 2. Scale bars are 40 μm for (a) and (e), 10 μm for (b-d) and (f-k), and 20 μm for (o).

Similar articles

Cited by

References

    1. Shaw TJ, Martin P. Wound repair at a glance. J Cell Sci. 2009;122:3209–3213. - PMC - PubMed
    1. Sonnemann KJ, Bement WM. Wound Repair: Toward Understanding and Integration of Single-Cell and Multicellular Wound Responses. Annu Rev Cell Dev Biol. 2011;27:237–263. - PMC - PubMed
    1. Cordeiro J. o. V., Jacinto A. n. The role of transcription-independent damage signals in the initiation of epithelial wound healing. Nat Rev Mol Cell Biol. 2013;14:249–262. - PubMed
    1. Crosby LM, Waters CM. Epithelial repair mechanisms in the lung. Am J Physiol Lung Cell Mol Physio. 2010;298:L715–L731. - PMC - PubMed
    1. Arwert EN, Hoste E, Watt FM. Epithelial stem cells, wound healing and cancer. Nat Rev Cancer. 2012;12:170–180. - PubMed