. 2015 Apr;6(2 Suppl):13S-29S.
doi: 10.1177/1947603515571002. Epub 2015 Mar 24.

Next Generation Mesenchymal Stem Cell (MSC)-Based Cartilage Repair Using Scaffold-Free Tissue Engineered Constructs Generated with Synovial Mesenchymal Stem Cells

Affiliations

Next Generation Mesenchymal Stem Cell (MSC)-Based Cartilage Repair Using Scaffold-Free Tissue Engineered Constructs Generated with Synovial Mesenchymal Stem Cells

Kazunori Shimomura et al. Cartilage. 2015 Apr.

Abstract

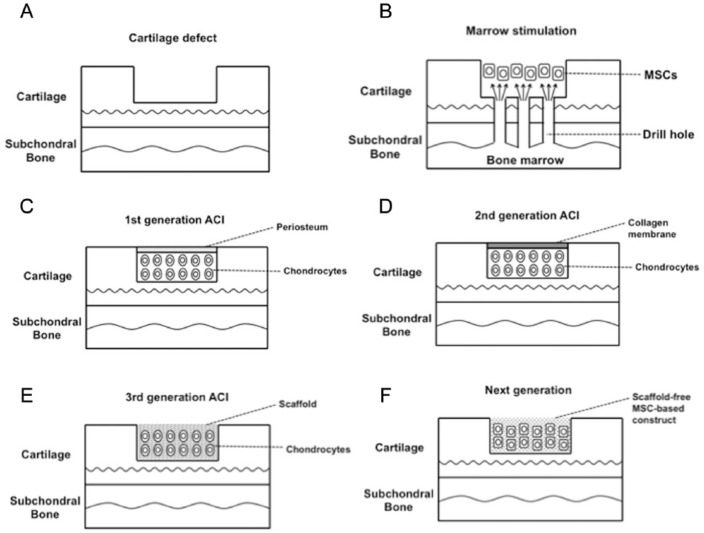
Because of its limited healing capacity, treatments for articular cartilage injuries are still challenging. Since the first report by Brittberg, autologous chondrocyte implantation has been extensively studied. Recently, as an alternative for chondrocyte-based therapy, mesenchymal stem cell-based therapy has received considerable research attention because of the relative ease in handling for tissue harvest, and subsequent cell expansion and differentiation. This review summarizes latest development of stem cell therapies in cartilage repair with special attention to scaffold-free approaches.

Keywords: animal models; articular cartilage; biomaterials; mesenchymal stem cells; synovial cells.


Conflict of interest statement

Declaration of Conflicting Interests: The author(s) declared no potential conflicts of interest with respect to the research, authorship, and/or publication of this article.

Figures

Figure 1.
Figure 1.
Schematic representation of cell-based cartilage repair. (A) Typical cartilage defect. (B) Marrow stimulation technique. Subchondral bone penetration to release bone marrow mesenchymal stem cells (MSCs) that form a stem cell–rich clot into the cartilage defect. (C) First generation of autologous chondrocyte implantation (ACI). Chondrocytes isolated from a biopsy of a non-weightbearing location are culture-expanded and subsequently implanted under a periosteal cover. (D) Second generation of ACI. A cover of a collagen membrane replaces the periosteal cover of the first generation of ACI. (E) Third generation of ACI. Autologous chondrocytes are delivered into the defect using biomaterial scaffolds. (F) Next generation cartilage repair using scaffoldless MSC-based technique. In vitro generated scaffold-free 3-dimensional tissue-engineered construct (TEC) that is composed of MSCs derived from synovium and the extracellular matrices (ECM) synthesized by the cells is implanted into cartilage defect.
Figure 2.
Figure 2.
Pluripotency of the synovial cells. (A) Alcian blue staining of the cultured synovial cells under a pellet culture system in chondrogenic medium. There is intense blue staining observed. Bar = 500 μm. (B) Alizarin red staining of the synovial cells (at passage 5) under osteogenic medium. These synovial cells form a mineralized matrix as evidenced by Alizarin red staining. Bar = 100 μm. (C) Oil-red O staining of synovial cells (at passage 5) after exposure to an adipogenic medium. Morphological changes in cells, as well as the formation of neutral lipid vacuoles are noticeable. Bar = 100 μm.
Figure 3.
Figure 3.
Development of the tissue-engineered construct (TEC). (A) Photomicrograph of monolayer culture in the absence (left) or presence (right) of 0.2 mM ascorbic acid 2-phosphate (Asc-2P). Bar = 100 μm. (B) The hydroxyproline contents of the TEC (1.6 × 10⁶ cells/12-well culture plate) cultured in the growth medium in the absence or presence of Asc-2P (0.1, 1, and 5 mM). There is a significant increase in collagen synthesis when Asc-2P is added at the concentration of more than 0.1 mM over 7 days (N = 4, #P < 0.001, compared with 0 mM). There is no significant dose effect of Asc-2P at more than 0.1 mM. In the presence of Asc-2P, collagen synthesis was significantly increased with time-dependency (P < 0.001). (C) Macroscopic view (left, bar = 1 cm), photomicrograph (middle, bar = 100 μm), and scanning electron microscopic view (right, bar = 20 μm) of the TEC. (D) Immunohistochemical analysis of the TEC stained with type I collagen (Col I), type II collagen (Col II), type III collagen (Col III), fibronectin, vitronectin, and negative IgG (control). Red are nuclei and green is target antibody. Adhesion molecules such as fibronectin and vitronectin are diffusely distributed within the TEC. Bar = 100 μm. (E) Macroscopic view of the TEC (8.0 × 10⁶ cells/6-cm dish, 14 days culture) that was integrated to one spherical body. The diameter of this TEC was 5 mm and the thickness was 2 mm. (F) Hematoxylin and eosin staining (left), and fibronectin staining (right) of the TEC that was integrated to one spherical body with additional 7 days culture. Bar = 100 μm.
Figure 4.
Figure 4.
Tissue-engineered constructs (TECs) exhibit adhesiveness to a normal cartilage matrix. (A) Photomicrograph (hematoxylin and eosin staining) of a cultured chondral fragment for 7 days after the implantation of a TEC on the injured surface. As can be seen, the bioengineered tissue is closely attached to the injured surface. Bar =200 μm. (B) Immunohistochemical analysis staining for fibronectin in area enclosed by dotted rectangle in A. Bar = 50 μm.
Figure 5.
Figure 5.
Chondrogenesis of the tissue-engineered construct (TEC). (A) Alcian blue staining of a monolayer of cultured synovial cells, a TEC in control medium or in chondrogenic medium for 14 days, respectively. (B, C) The quantification of Alcian blue staining (B) and glycosaminoglycan (GAG) contents (C) of a monolayer culture complex, or a TEC in control medium or chondrogenic medium, respectively. GAG synthesis is significantly higher in the TEC cultured in chondrogenic medium (N = 8, P = 0.047, §P = 0.016). (D) Semiquantitative reverse transcription–polymerase chain reaction (RT-PCR) analysis for chondrogenic marker genes, type II collagen (Col2a1), aggrecan, Sox 9, and glyceraldehyde 3-phosphate dehydrogenase (GAPDH).
Figure 6.
Figure 6.
Cell proliferation assay and chondrogenic potential of porcine mesenchymal stem cells (MSCs) derived from immature and mature animals. The cell proliferation assay was assessed by cell counting (A) and the WST-1 method (B). There were no significant differences in proliferative capacity between immature (N = 3) and mature porcine synovial MSCs (N = 3). Chondrogenic potential of porcine MSCs derived from immature and mature animals assessed by reverse transcription–polymerase chain reaction (RT-PCR) for collagen II expression (C, D), Alcian blue staining (E), and glycosaminoglycan (GAG) synthesis (F). Bar = 200 mm. There were no significant differences detected between immature-cell pellets (N = 3) and mature-cell pellets (N = 3) by RT-PCR analysis (D) or GAG synthesis (F).
Figure 7.
Figure 7.
Macroscopic and histologic assessment of tissue-engineered construct (TEC) implanted in vivo on porcine chondral defects. (A-C) Photomicrograph (hematoxylin and eosin [HE] staining; A), the interface view using a digital microscope (B), and fibronectin staining (C) of porcine chondral defects treated with a TEC at day 7. Arrows indicate interface between the TEC and the cartilage defect. Bar = 50 μm. (D) Macroscopic view of immature or mature porcine chondral lesions treated with a TEC or left untreated at 6 months after surgery. Bar = 10 mm. (E) Macroscopic score of chondral lesions treated with a TEC (immature animals, N = 8; mature animals, N = 6) or left untreated (immature animals, N = 4; mature animals, N = 6) at 6 months postsurgery. Regardless of age, the TEC group showed significantly higher scores than did the untreated group. P < 0.05. (F) Safranin-O staining of untreated chondral lesions or lesions repaired with a TEC. Bar = 1 mm. (G-J) Higher magnification view at the TEC/normal cartilage boundary area (G, H) and the central area (I, J) of TEC-mediated repair tissue. Bar = 200 mm. Regardless of age, the defects treated with a TEC were completely filled with Safranin-O-positive repair tissue (I, J) with good integration to normal cartilage (G, H, arrow). (K-M) Modified International Carticlage Repair Society (ICRS) score for repair cartilage in immature (K) and mature animals (L). The TEC group (N = 8) exhibited significantly higher scores than did the untreated control group (N = 4) in all the criteria categories in the immature animals. P < 0.05. Likewise, the TEC group (N = 6) exhibited significantly higher scores than did the untreated control group (N = 6) in all the criteria categories except for the “Matrix” and “Cell Distribution” categories in the mature recipients. P < 0.05. (M) As to the quality of the repair cartilage mediated by the TEC, there were no significant differences observed in any criteria category between the immature (N = 8) and mature animals (N = 6).
Figure 8.
Figure 8.
Mechanical assessment of in vivo implanted tissue-engineered construct (TEC) in porcine chondral defect model. (A, B) The results of compression tests at slower compression speed (4 μm/s) (A) and at faster compression speed (100 μm/s) (B). (Immature animals: normal cartilage, N = 11, TEC, N = 7, untreated, N = 4. Mature animals: normal cartilage, N = 5, TEC, N = 5, untreated, N = 5.) Regardless of age, there were no significant differences detected in the tangent modulus of the repair tissue mediated by a TEC compared with normal cartilage at either the slower or faster compression speed. Conversely, the untreated cartilage defects, whether immature or mature, showed significantly lower tangent modulus than did normal cartilage at either the slower or faster compression speed. P < 0.05.
Figure 9.
Figure 9.
Comparison of zonal structure and mechanical properties of repair cartilage generated from a porcine-derived tissue-engineered construct (TEC). (A) Safranin O staining of uninjured normal porcine articular cartilage and chondral lesions treated with or without a TEC at 6 months after implantation. Bar = 100 μm. (B) Typical stress–strain relationships of TEC-treated repair tissue compared with those of uninjured cartilage and defects left untreated. (C) Tangent modulus of uninjured cartilage (n = 10), repair tissue in chondral lesions of the group treated with a TEC (n = 6), and those in the untreated group (n = 3) at compression rate of 4 μm/s. aP < 0.05, compared with uninjured cartilage. bP < 0.05 compared with the TEC-treated group. There were no significant differences between the tangent modulus of TEC-mediated repair tissue and that of uninjured cartilage. (D) Safranin O staining of superficial, middle and deep zone of porcine chondral lesions 6 months after implantation of TECs and uninjured cartilage. Bar = 25 μm. (E) Zonal histological and histochemical grading scale of uninjured articular cartilage and TEC-mediated repair tissue (n = 8). a,c,gP < 0.001; b,d,hP < 0.01; e,fP < 0.05 compared with the uninjured cartilage. (F) Scanning electron microscopic (SEM) view of normal porcine cartilage and chondral lesions treated with a TEC at 6 months after implantation (upper pictures). Bar = 100 μm. Higher magnification SEM view of uninjured porcine cartilage and chondral lesions treated with a TEC (lower pictures). Bar = 25 μm. Arrow; the thickness of the superficial layer. (G) PRG4/Lubricin expression at the surface zone of uninjured porcine cartilage and chondral lesions treated with or without a TEC. (H) Frictional coefficient of uninjured cartilage (n = 11) and chondral lesions in the TEC-treated group (n = 7) at 60 seconds with the application of a compressive force of 1.76 N. There were no significant differences between the frictional coefficients of repair tissue following implantation of a TEC and those of normal cartilage. (I) The surface stiffness of normal cartilage, the repair tissue of chondral lesions in the TEC-treated group, and that in the untreated group. aP < 0.05, bp < 0.05 compared with normal cartilage. (J) Permeability of uninjured cartilage (n = 11) and repair tissue in chondral lesions of the TEC-treated group (n = 7) at the surface, middle, and deep zone. aP < 0.05, compared with normal cartilage.
Figure 10.
Figure 10.
Arthroscopic and magnetic resonance imaging (MRI) analyses of repair tissue following implantation of a tissue-engineered construct (TEC) to repair human chondral defects in clinical trial. (A, B) Arthroscopic views of the preoperation defect and then 1 year after implantation of a TEC. The cartilage defect was completely covered with a cartilage-like repair tissue. (C) T2-weighted mapping of the lesion at the femoral groove. Left, before implantation; right, 1 year after implantation.

Similar articles

Cited by

References

    1. Hjelle K, Solheim E, Strand T, Muri R, Brittberg M. Articular cartilage defects in 1,000 knee arthroscopies. Arthroscopy. 2002;18:730-4. - PubMed
    1. Buckwalter JA. Articular cartilage injuries. Clin Orthop Relat Res. 2002;(402):21-37. - PubMed
    1. Hunziker EB. Articular cartilage repair: basic science and clinical progress. A review of the current status and prospects. Osteoarthritis Cartilage. 2002;10:432-63. - PubMed
    1. Mithoefer K, Williams RJ, 3rd, Warren RF, Potter HG, Spock CR, Jones EC, et al. The microfracture technique for the treatment of articular cartilage lesions in the knee. A prospective cohort study. J Bone Joint Surg Am. 2005;87:1911-20. - PubMed
    1. Nehrer S, Spector M, Minas T. Histologic analysis of tissue after failed cartilage repair procedures. Clin Orthop Relat Res. 1999;(365):149-62. - PubMed