

Ultrastructural Mapping of the Zebrafish Gastrointestinal System as a Basis for Experimental Drug Studies
- PMID: 27340669
- PMCID: PMC4909927
- DOI: 10.1155/2016/8758460
Ultrastructural Mapping of the Zebrafish Gastrointestinal System as a Basis for Experimental Drug Studies
Abstract
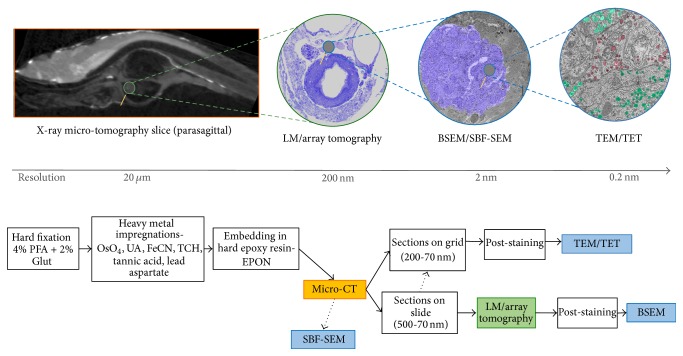
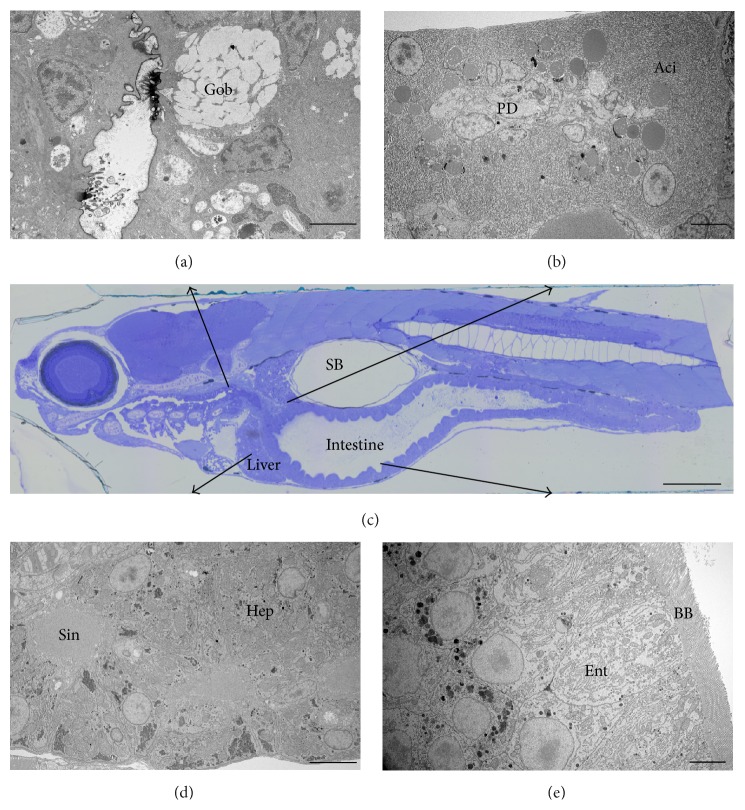
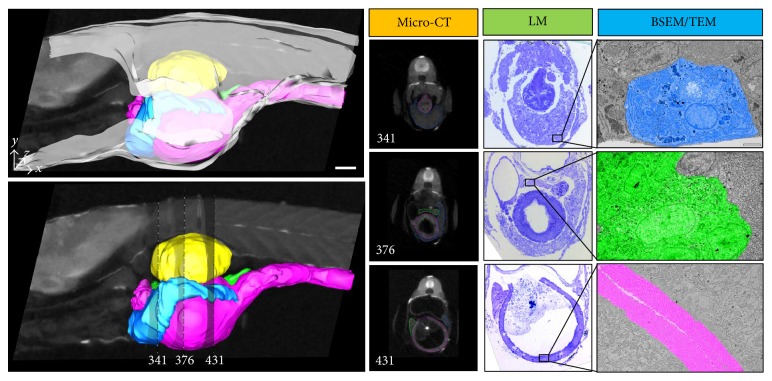
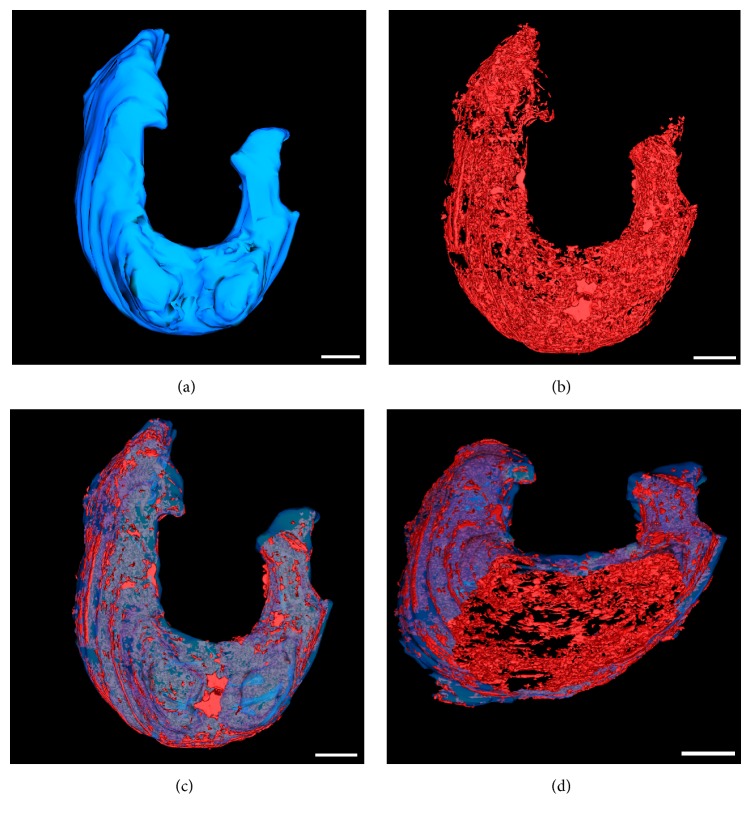
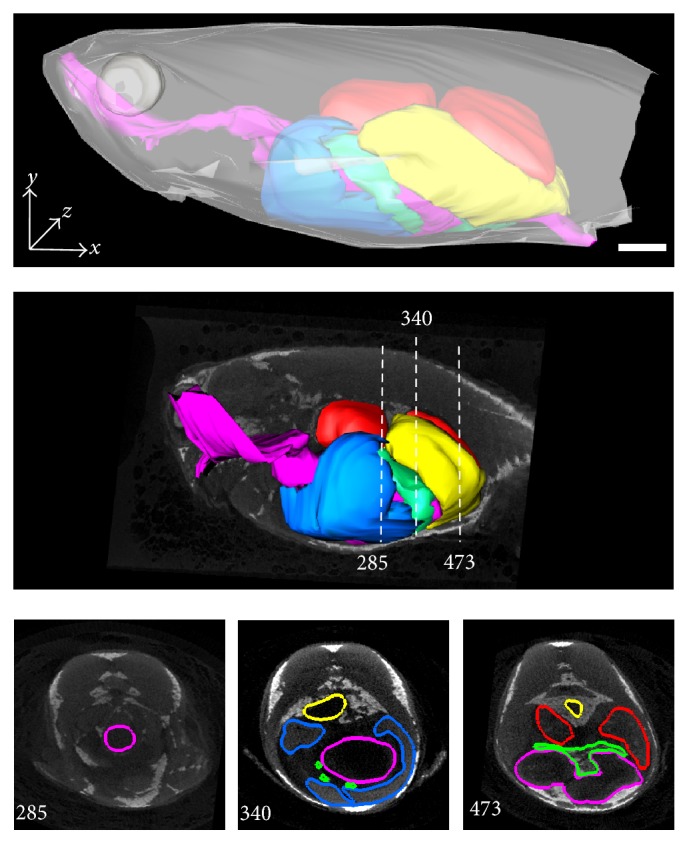
Research in the field of gastroenterology is increasingly focused on the use of alternative nonrodent model organisms to provide new experimental tools to study chronic diseases. The zebrafish is a particularly valuable experimental platform to explore organ and cell structure-function relationships under relevant biological and pathobiological settings. This is due to its optical transparency and its close-to-human genetic makeup. To-date, the structure-function properties of the GIS of the zebrafish are relatively unexplored and limited to histology and fluorescent microscopy. Occasionally those studies include EM of a given subcellular process but lack the required full histological picture. In this work, we employed a novel combined biomolecular imaging approach in order to cross-correlate 3D ultrastructure over different length scales (optical-, X-ray micro-CT, and high-resolution EM). Our correlated imaging studies and subsequent data modelling provide to our knowledge the first detailed 3D picture of the zebrafish larvae GIS. Our results provide unequivocally a limit of confidence for studying various digestive disorders and drug delivery pathways in the zebrafish.
Figures
Similar articles
-
Tools for automating the imaging of zebrafish larvae.Methods. 2016 Mar 1;96:118-126. doi: 10.1016/j.ymeth.2015.11.021. Epub 2015 Nov 26. Methods. 2016. PMID: 26631716
-
Morphologic analysis of the zebrafish digestive system.Methods Mol Biol. 2009;546:289-315. doi: 10.1007/978-1-60327-977-2_18. Methods Mol Biol. 2009. PMID: 19378111
-
Genetic tools for multicolor imaging in zebrafish larvae.Methods. 2013 Aug 15;62(3):279-91. doi: 10.1016/j.ymeth.2013.07.028. Epub 2013 Jul 22. Methods. 2013. PMID: 23886907 Review.
-
Zebrafish based assays for the assessment of cardiac, visual and gut function--potential safety screens for early drug discovery.J Pharmacol Toxicol Methods. 2008 Jul-Aug;58(1):59-68. doi: 10.1016/j.vascn.2008.05.130. Epub 2008 Jun 8. J Pharmacol Toxicol Methods. 2008. PMID: 18585469
-
Improved Imaging of Zebrafish Motility.Neurogastroenterol Motil. 2018 Sep;30(9):e13435. doi: 10.1111/nmo.13435. Neurogastroenterol Motil. 2018. PMID: 30240125 Free PMC article. Review.
Cited by
-
Zebrafish as a Model for Anticancer Nanomedicine Studies.Pharmaceuticals (Basel). 2021 Jun 28;14(7):625. doi: 10.3390/ph14070625. Pharmaceuticals (Basel). 2021. PMID: 34203407 Free PMC article. Review.
-
Fluorescent Imaging-Guided Chemo- and Photodynamic Therapy of Hepatocellular Carcinoma with HCPT@NMOFs-RGD Nanocomposites.Int J Nanomedicine. 2022 Mar 25;17:1381-1395. doi: 10.2147/IJN.S353803. eCollection 2022. Int J Nanomedicine. 2022. PMID: 35369034 Free PMC article.
-
Assessing Bioconcentration and Biotransformation of BDE-47 In Vitro: The Relevance of Bioavailable and Intracellular Concentrations.J Xenobiot. 2025 Jun 16;15(3):93. doi: 10.3390/jox15030093. J Xenobiot. 2025. PMID: 40558876 Free PMC article.
-
Atractylone Alleviates Ethanol-Induced Gastric Ulcer in Rat with Altered Gut Microbiota and Metabolites.J Inflamm Res. 2022 Aug 16;15:4709-4723. doi: 10.2147/JIR.S372389. eCollection 2022. J Inflamm Res. 2022. PMID: 35996682 Free PMC article.
-
Resident Immunity in Tissue Repair and Maintenance: The Zebrafish Model Coming of Age.Front Cell Dev Biol. 2019 Feb 5;7:12. doi: 10.3389/fcell.2019.00012. eCollection 2019. Front Cell Dev Biol. 2019. PMID: 30805338 Free PMC article.
References
MeSH terms
LinkOut - more resources
Full Text Sources
Other Literature Sources
