

Clearance of Hepatic Sphingomyelin by Olipudase Alfa Is Associated With Improvement in Lipid Profiles in Acid Sphingomyelinase Deficiency
- PMID: 27340749
- PMCID: PMC4987207
- DOI: 10.1097/PAS.0000000000000659
Clearance of Hepatic Sphingomyelin by Olipudase Alfa Is Associated With Improvement in Lipid Profiles in Acid Sphingomyelinase Deficiency
Abstract
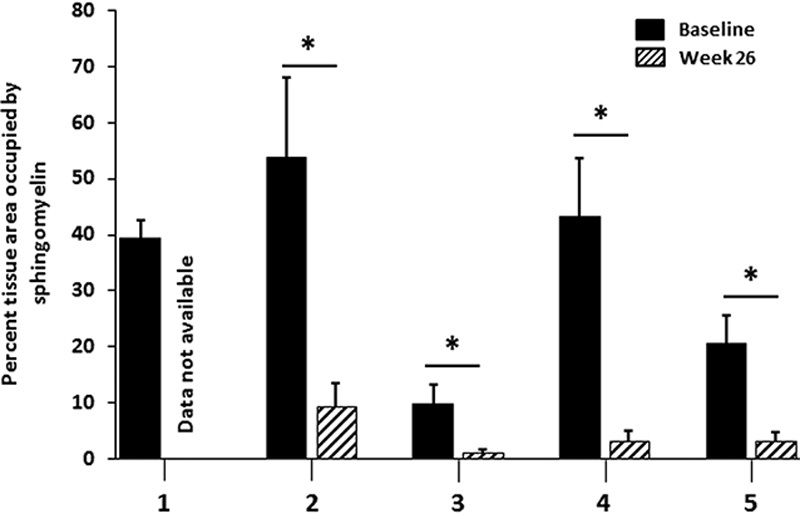
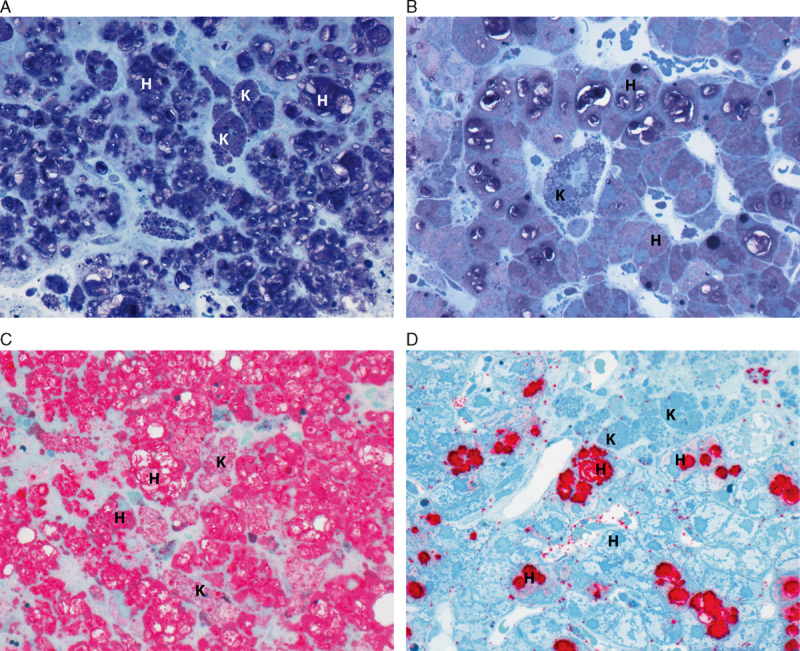
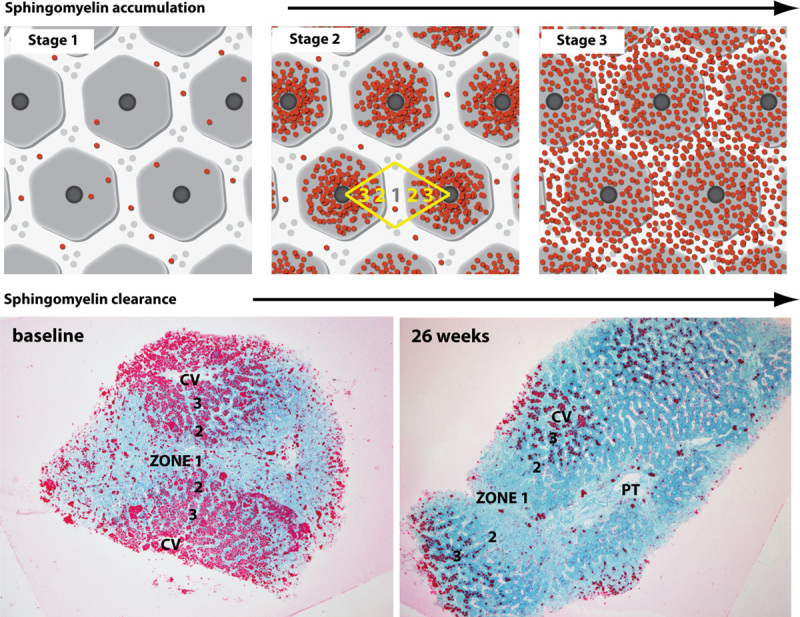
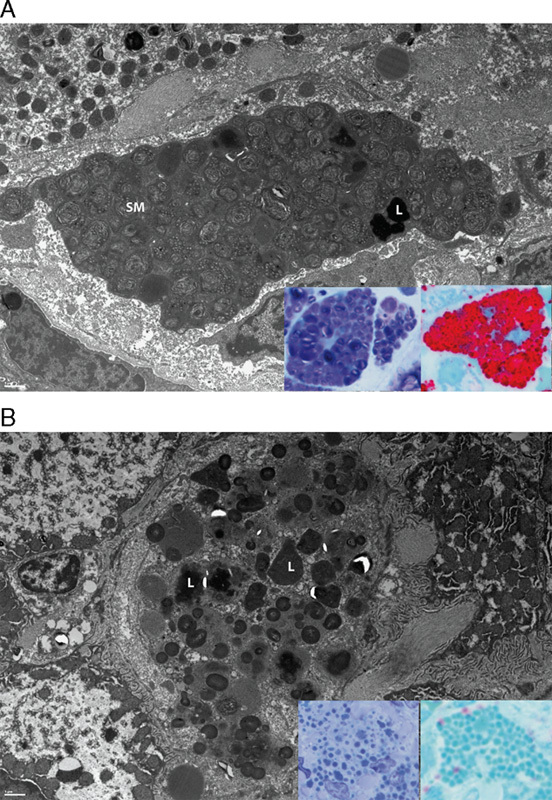
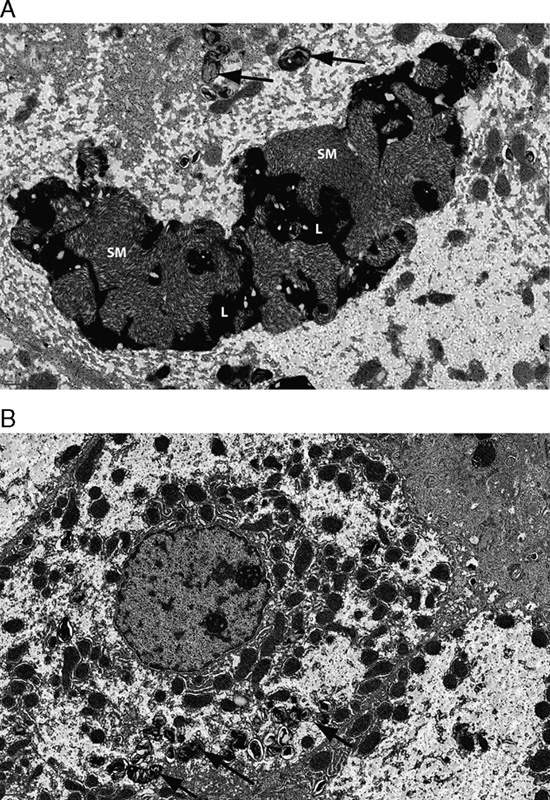
Acid sphingomyelinase deficiency (ASMD; Niemann-Pick disease type A and B) is a lysosomal storage disorder characterized by abnormal intracellular sphingomyelin (SM) accumulation. Prominent liver involvement results in hepatomegaly, fibrosis/cirrhosis, abnormal liver chemistries, and a proatherogenic lipid profile. Olipudase alfa (recombinant human ASM) is in clinical development as an investigational enzyme replacement therapy for the non-neurological manifestations of ASMD. In a phase 1b study conducted to evaluate the safety and tolerability of within-patient dose escalation with olipudase alfa, measurement of SM levels in liver biopsies was used as a pharmacodynamic biomarker of substrate burden. Five adult patients with non neuronopathic ASMD received escalating doses of olipudase alfa every 2 weeks for 26 weeks. Liver biopsies obtained at baseline and 26 weeks after treatment were evaluated for SM storage by histomorphometric analysis, biochemistry, and electron microscopy. Biopsies were also assessed for inflammation and fibrosis, and for the association of SM levels with liver volume, liver function tests, and lipid profiles. At baseline, SM storage present in Kupffer cells and hepatocytes ranged from 9.8% to 53.8% of the microscopic field. After 26 weeks of treatment, statistically significant reductions in SM (P<0.0001) measured by morphometry were seen in 4 patients with evaluable liver biopsies. The 26-week biopsy of the fifth patient was insufficient for morphometric quantitation. Posttreatment SM levels ranged from 1.2% to 9.5% of the microscopic field, corresponding to an 84% to 92% relative reduction from baseline. Improvements in liver volume, liver function tests, and lipid profiles were also observed. This study illustrates the utility of SM assessment by liver biopsy as a pharmacodynamic biomarker of disease burden in these patients.
Trial registration: ClinicalTrials.gov NCT01722526.
Conflict of interest statement
and Source of Funding: Genzyme Corporation was the sponsor and provided support for the design and conduct of the study. The study was supported in part by Grant Number #UL1TR000067 from the National Center for Advancing Translational Sciences (NCATS), a component of the National Institutes of Health (NIH), and contents are solely the responsibility of the authors and do not necessarily represent the official views of NCATS or NIH. M.P.W. has received research support from Genzyme for the conduct of this study; researchers at Mount Sinai have developed and patented olipudase alfa, which they licensed to Genzyme Corporation. S.A.J. has received honoraria for consulting and lectures, travel assistance, and medical writing assistance from Sanofi Genzyme; CMFT entered into a clinical trial agreement to complete the work described in this manuscript. B.L.T., G.F.C., and A.C.P. are employees of Sanofi Genzyme. For the remaining author none was declared.
Figures
References
-
- Schuchman EH, Desnick RJ.Valle D, Beaudet A, Vogelstein B, Kinzler K, Antonarakis S, Ballabio A, Gibson K, Mitchell G. Niemann-Pick disease types A and B: acid sphingomyelinase deficiencies. OMMBID-The Online Metabolic and Molecular Bases of Inherited Disease. New York: McGraw Hill; 2013. http://ommbid.mhmedical.com/content.aspx?bookid=474&Sectionid=45374145. Accessed May 2015.
-
- McGovern MM, Lippa N, Bagiella E, et al. Morbidity and mortality in type B Niemann-Pick disease. Genet Med. 2013;15:618–623. - PubMed
-
- Hegele RA. Plasma lipoproteins: genetic influences and clinical implications. Nat Rev Genet. 2009;10:109–121. - PubMed
-
- Rye K-A, Barter PJ. Regulation of high-density lipoprotein metabolism. Circ Res. 2014;114:143–156. - PubMed
Publication types
MeSH terms
Substances
Associated data
Grants and funding
LinkOut - more resources
Full Text Sources
Other Literature Sources
Medical
