

Historical Prediction Modeling Approach for Estimating Long-Term Concentrations of PM2.5 in Cohort Studies before the 1999 Implementation of Widespread Monitoring
- PMID: 27340825
- PMCID: PMC5226688
- DOI: 10.1289/EHP131
Historical Prediction Modeling Approach for Estimating Long-Term Concentrations of PM2.5 in Cohort Studies before the 1999 Implementation of Widespread Monitoring
Abstract
Introduction: Recent cohort studies have used exposure prediction models to estimate the association between long-term residential concentrations of fine particulate matter (PM2.5) and health. Because these prediction models rely on PM2.5 monitoring data, predictions for times before extensive spatial monitoring present a challenge to understanding long-term exposure effects. The U.S. Environmental Protection Agency (EPA) Federal Reference Method (FRM) network for PM2.5 was established in 1999.
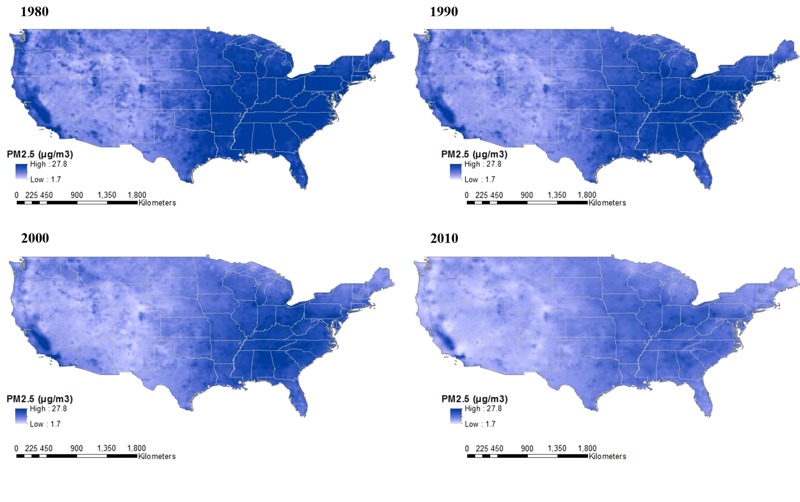
Objectives: We evaluated a novel statistical approach to produce high-quality exposure predictions from 1980 through 2010 in the continental United States for epidemiological applications.
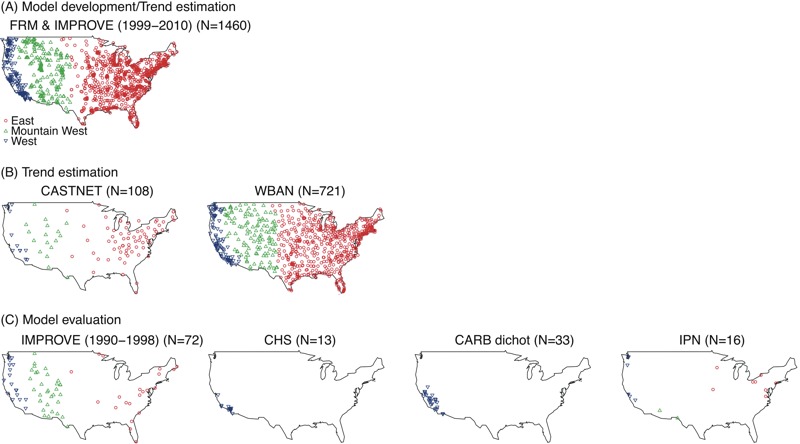
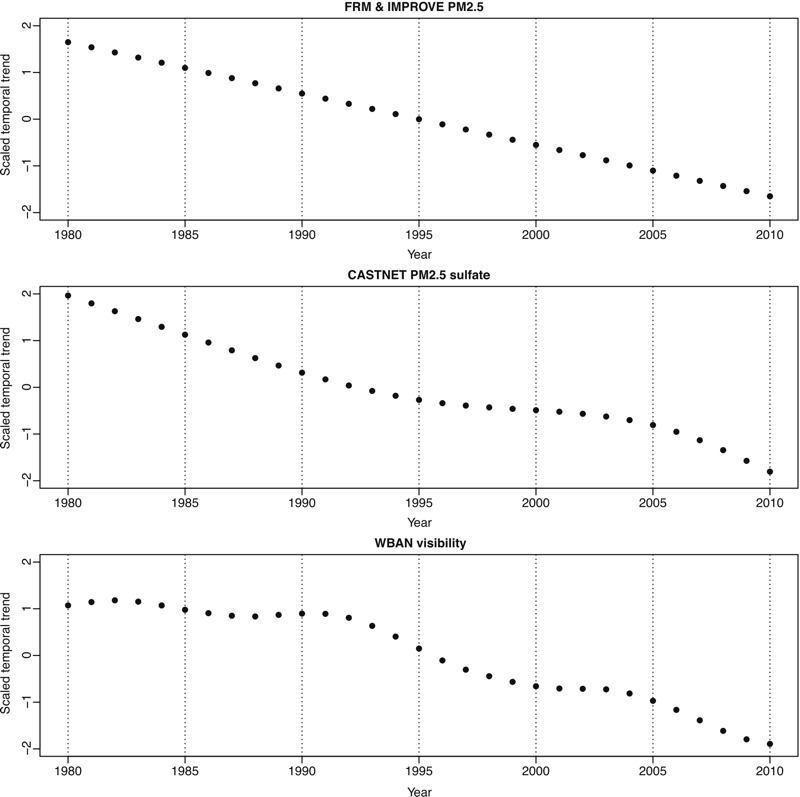
Methods: We developed spatio-temporal prediction models using geographic predictors and annual average PM2.5 data from 1999 through 2010 from the FRM and the Interagency Monitoring of Protected Visual Environments (IMPROVE) networks. Temporal trends before 1999 were estimated by using a) extrapolation based on PM2.5 data in FRM/IMPROVE, b) PM2.5 sulfate data in the Clean Air Status and Trends Network, and c) visibility data across the Weather Bureau Army Navy network. We validated the models using PM2.5 data collected before 1999 from IMPROVE, California Air Resources Board dichotomous sampler monitoring (CARB dichot), the Children's Health Study (CHS), and the Inhalable Particulate Network (IPN).
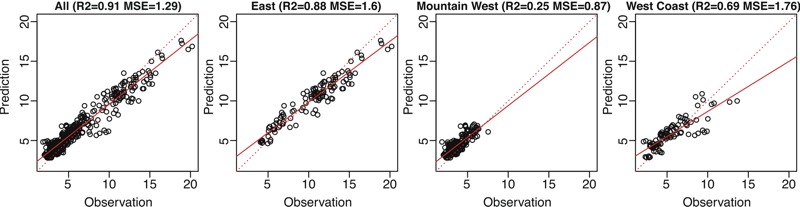
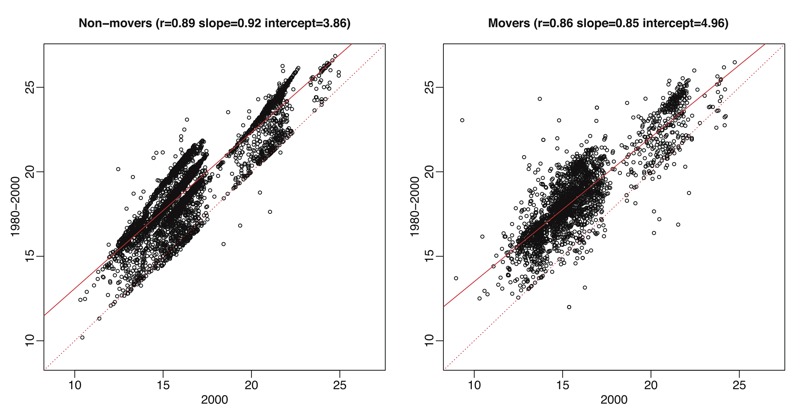
Results: In our validation using pre-1999 data, the prediction model performed well across three trend estimation approaches when validated using IMPROVE and CHS data (R2 = 0.84-0.91) with lower R2 values in early years. Model performance using CARB dichot and IPN data was worse (R2 = 0.00-0.85) most likely because of fewer monitoring sites and inconsistent sampling methods.
Conclusions: Our prediction modeling approach will allow health effects estimation associated with long-term exposures to PM2.5 over extended time periods ≤ 30 years. Citation: Kim SY, Olives C, Sheppard L, Sampson PD, Larson TV, Keller JP, Kaufman JD. 2017. Historical prediction modeling approach for estimating long-term concentrations of PM2.5 in cohort studies before the 1999 implementation of widespread monitoring. Environ Health Perspect 125:38-46; http://dx.doi.org/10.1289/EHP131.
Conflict of interest statement
Although this publication was developed under a Science to Achieve Results (STAR) research assistance agreement (RD831697) awarded by the U.S. EPA, it has not been formally reviewed by the U.S. EPA. The views expressed in this document are solely those of the University of Washington, and the U.S. EPA does not endorse any products or commercial services mentioned in this publication. The authors declare they have no actual or potential competing financial interests.
Figures
References
-
- Alexeeff SE, Schwartz J, Kloog I, Chudnovsky A, Koutrakis P, Coull BA. Consequences of kriging and land use regression for PM2.5 predictions in epidemiologic analyses: insights into spatial variability using high-resolution satellite data. J Expo Sci Environ Epidemiol. 2015;25(2):138–144. - PMC - PubMed
-
- Banerjee S, Carlin BP, Gelfand AE. In: Hierarchical Modeling and Analysis for Spatial Data. Boca Raton, FL: Chapman and Hall/CRC Press; 2004. Basics of point-referenced data models. pp. 21–68.
-
- Beelen R, Raaschou-Nielsen O, Stafoggia M, Andersen ZJ, Weinmayr G, Hoffmann B, et al. Effects of long-term exposure to air pollution on natural-cause mortality: an analysis of 22 European cohorts within the multicentre ESCAPE project. Lancet. 2014;383(9919):785–795. - PubMed
Publication types
MeSH terms
Substances
Grants and funding
LinkOut - more resources
Full Text Sources
Other Literature Sources
Medical
Research Materials
