. 2017 Feb;56(2):594-606.
doi: 10.1002/mc.22519. Epub 2016 Aug 22.

Metabolomic profiles of current cigarette smokers

Affiliations

Metabolomic profiles of current cigarette smokers

Ping-Ching Hsu et al. Mol Carcinog. 2017 Feb.

Abstract

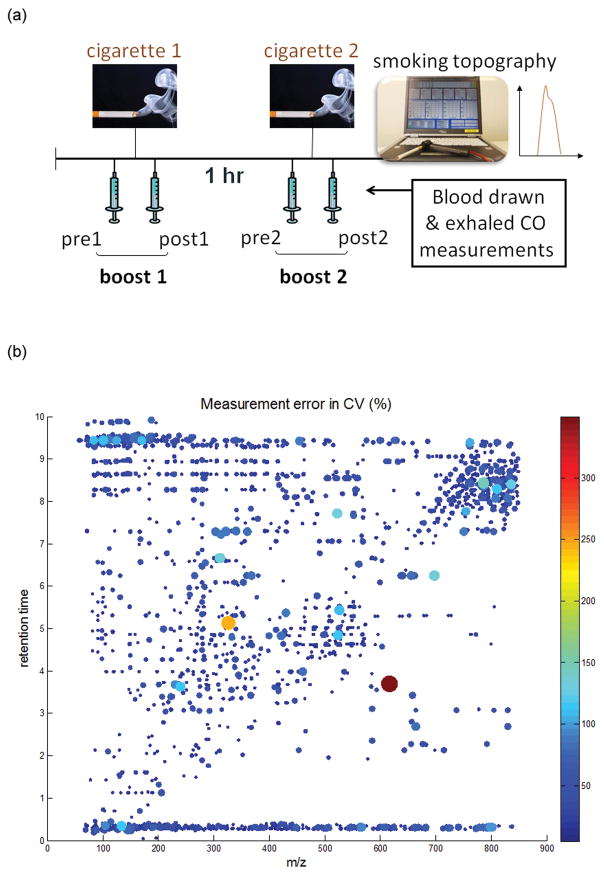
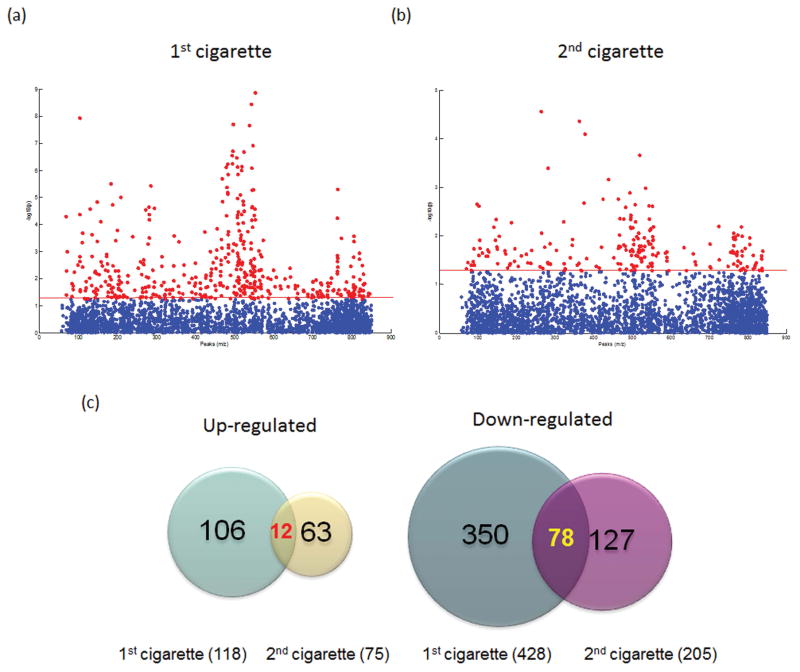
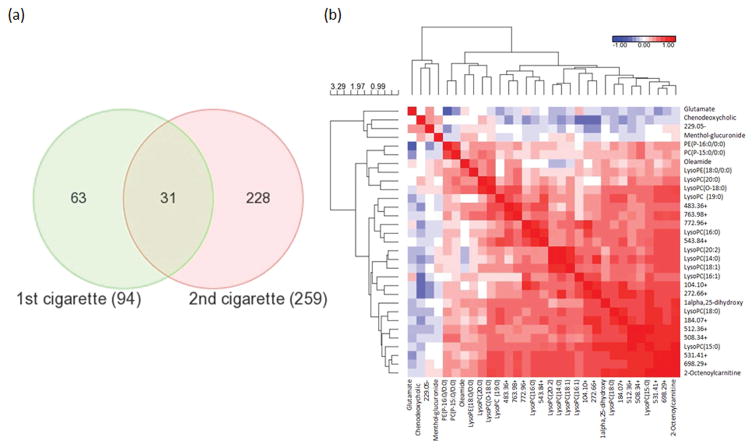
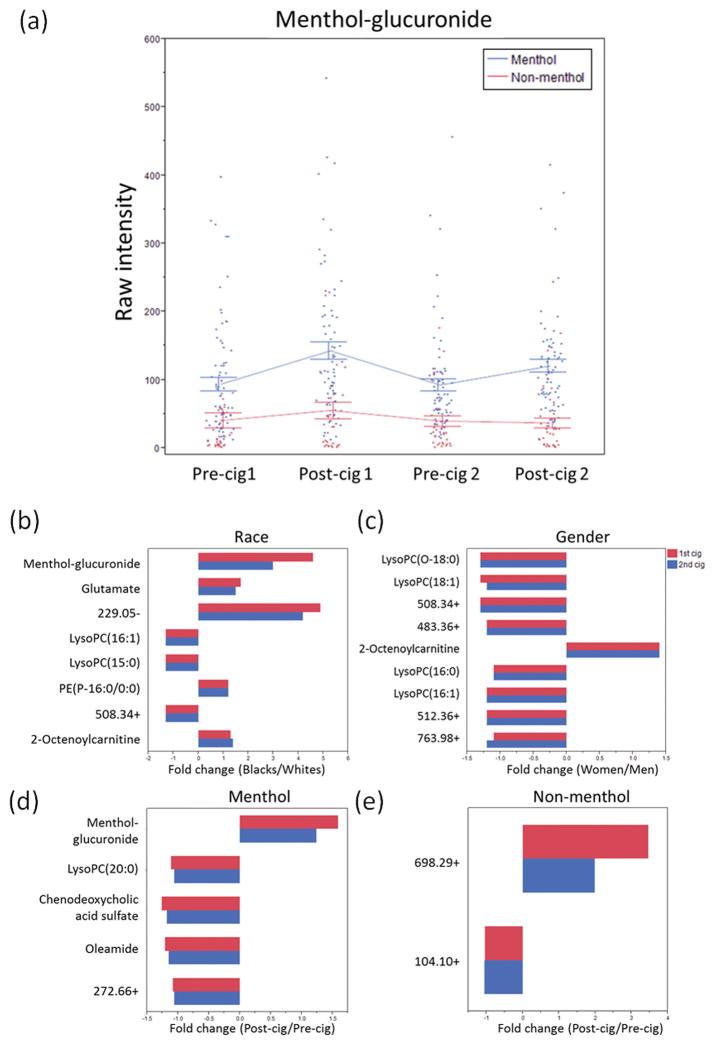
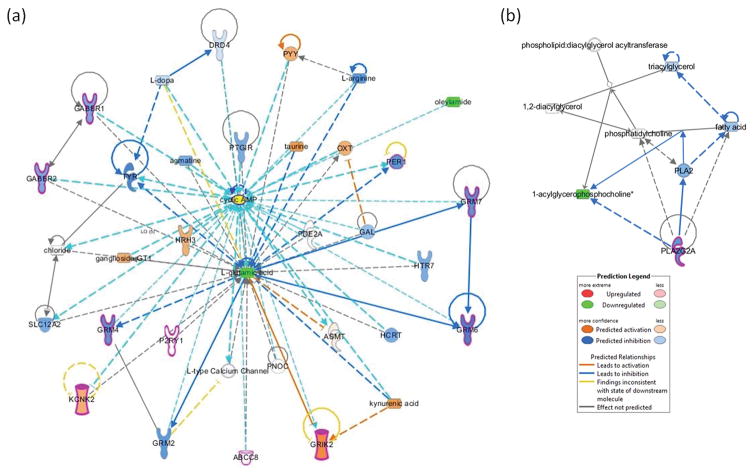
Smoking-related biomarkers for lung cancer and other diseases are needed to enhance early detection strategies and to provide a science base for tobacco product regulation. An untargeted metabolomics approach by ultra-performance liquid chromatography-quadrupole-time of flight mass spectrometry (UHPLC-Q-TOF MS) totaling 957 assays was used in a novel experimental design where 105 current smokers smoked two cigarettes 1 h apart. Blood was collected immediately before and after each cigarette allowing for within-subject replication. Dynamic changes of the metabolomic profiles from smokers' four blood samples were observed and biomarkers affected by cigarette smoking were identified. Thirty-one metabolites were definitively shown to be affected by acute effect of cigarette smoking, uniquely including menthol-glucuronide, the reduction of glutamate, oleamide, and 13 glycerophospholipids. This first time identification of a menthol metabolite in smokers' blood serves as proof-of-principle for using metabolomics to identify new tobacco-exposure biomarkers, and also provides new opportunities in studying menthol-containing tobacco products in humans. Gender and race differences also were observed. Network analysis revealed 12 molecules involved in cancer, notably inhibition of cAMP. These novel tobacco-related biomarkers provide new insights to the effects of smoking which may be important in carcinogenesis but not previously linked with tobacco-related diseases. © 2016 Wiley Periodicals, Inc.

Keywords: UHPLC-QTOF-MS; menthol; metabolomics; plasma; smokers.


Figures

Fig. 1
Fig. 1
(a) Study design for the cross-sectional study of smokers. (b) Distribution of the estimated measurement error in CV (%) before filtering. Each dot represents a single peak. The dot size and color corresponds to the CV value: the larger the dot, and the brighter the color of the dot, the larger the CV value of the individual peak.
Fig. 2
Fig. 2
Scatter plots representation of significant features regulated by (a) the first cigarette, and (b) the second cigarette. Significant features were selected by paired t-tests with threshold 0.05. The red dots represent features above the threshold. All p values are transformed by -log10 so that the more significant features (with smaller p values) were plotted higher on the graph. (c) Venn diagram representing metabolites significantly increased or decreased after 1st and 2nd cigarette.
Fig. 3
Fig. 3
Significant metabolites and their putative identifications. (a) Venn-diagram represents the significant metabolites influenced by cigarette smoking from the ANCOVA model; (b) Pairwise correlations from pre-1 cigarettes for the significant metabolites. Abbreviations: phosphatidylethanolamine (PE), phosphatidylcholines (PC), lysophosphatidylcholines (LysoPC), lysophosphatidylethanolamine (LysoPE).
Fig. 4
Fig. 4
(a) Levels of menthol-glucuronide across all time points. Blue dots and lines represent menthol smokers and red dots and lines represent non-menthol smokers. Each error bar was constructed using 1 standard error from the mean. Differences in (b) Race, (c) Gender, and among (d) Menthol cigarette smokers and (e) Non-menthol cigarette smokers on the significant metabolites after both cigarette smoking. All differences in fold change were significant at p < 0.05 level.
Fig. 5
Fig. 5
Two networks associated with cigarette smoking. Green nodes represented metabolites decreased in level in our study. Twelve molecules known as biomarkers for cancer were outlined in magenta.

References

    1. Berman ML, et al. Providing a Science Base for the Evaluation of Tobacco Products. Tobacco Regulatory Science. 2015;1(1):76–93. - PMC - PubMed
    1. Patti GJ. Separation strategies for untargeted metabolomics. Journal of separation science. 2011;34(24):3460–3469. - PubMed
    1. Hsu PC, et al. Feasibility of identifying the tobacco-related global metabolome in blood by UPLC-QTOF-MS. J Proteome Res. 2013;12(2):679–691. - PMC - PubMed
    1. Mathe EA, et al. Non-invasive urinary metabolomic profiling identifies diagnostic and prognostic markers in lung cancer. Cancer research 2014 - PMC - PubMed
    1. Benowitz NL, Zevin S, Jacob P., 3rd Suppression of nicotine intake during ad libitum cigarette smoking by high-dose transdermal nicotine. J Pharmacol Exp Ther. 1998;287(3):958–962. - PubMed

Publication types