. 2016 Jun 24;12(6):e1006098.
doi: 10.1371/journal.pgen.1006098. eCollection 2016 Jun.

C-Terminal Tyrosine Residue Modifications Modulate the Protective Phosphorylation of Serine 129 of α-Synuclein in a Yeast Model of Parkinson's Disease

Affiliations

C-Terminal Tyrosine Residue Modifications Modulate the Protective Phosphorylation of Serine 129 of α-Synuclein in a Yeast Model of Parkinson's Disease

Alexandra Kleinknecht et al. PLoS Genet. .

Abstract

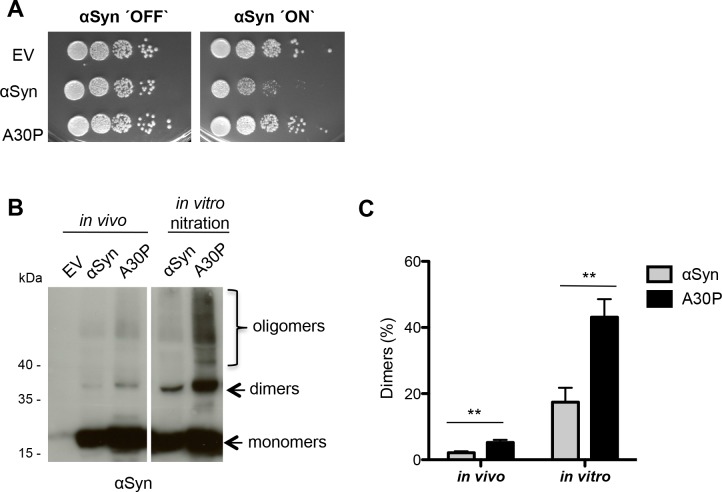
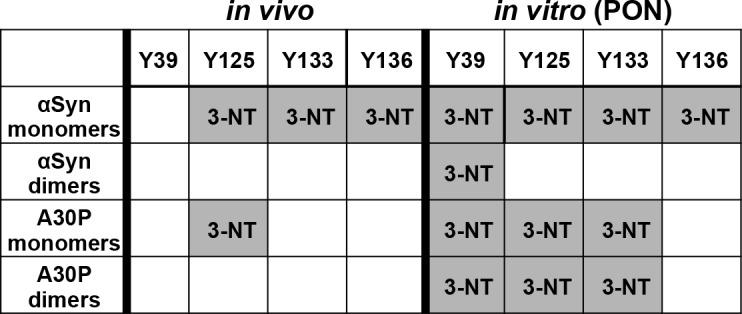
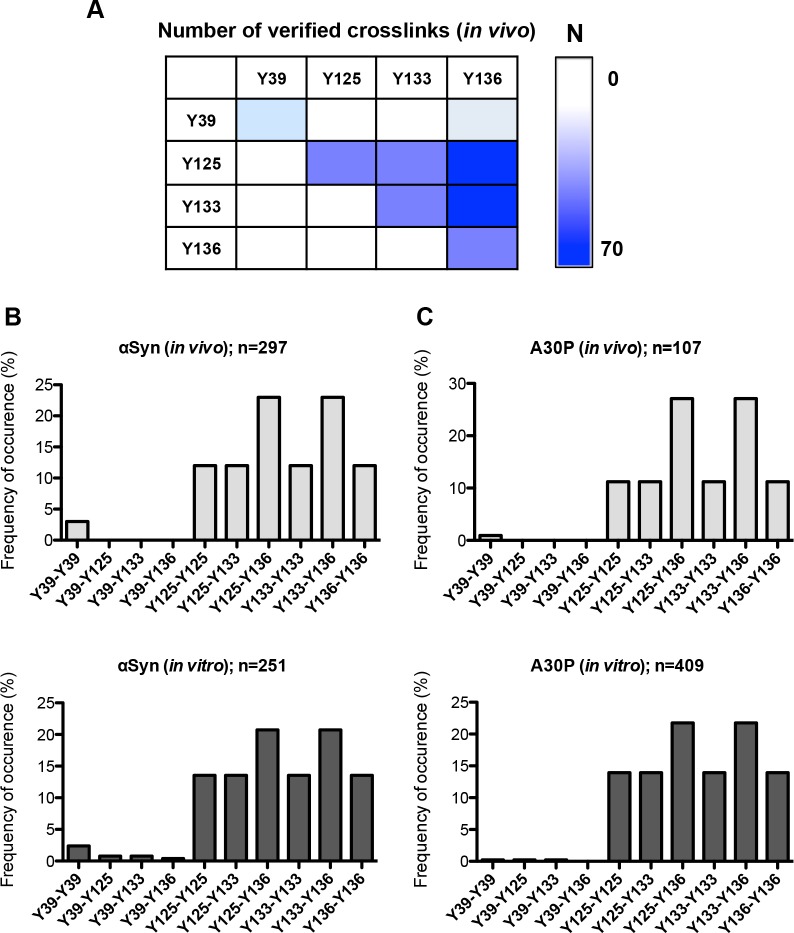
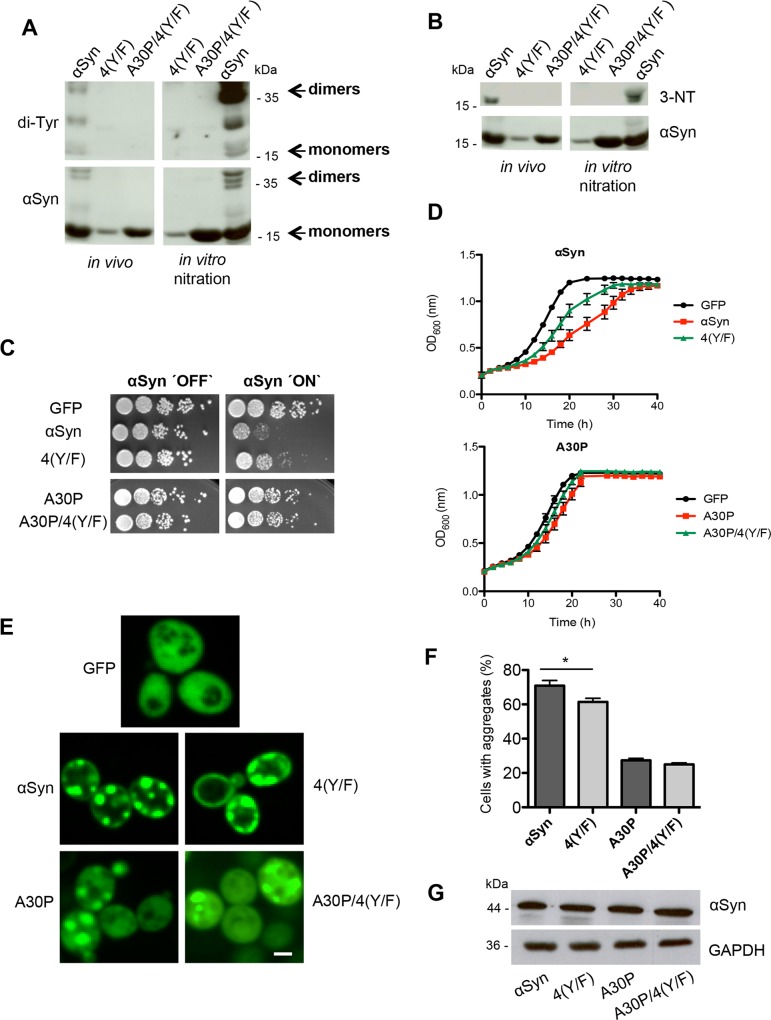
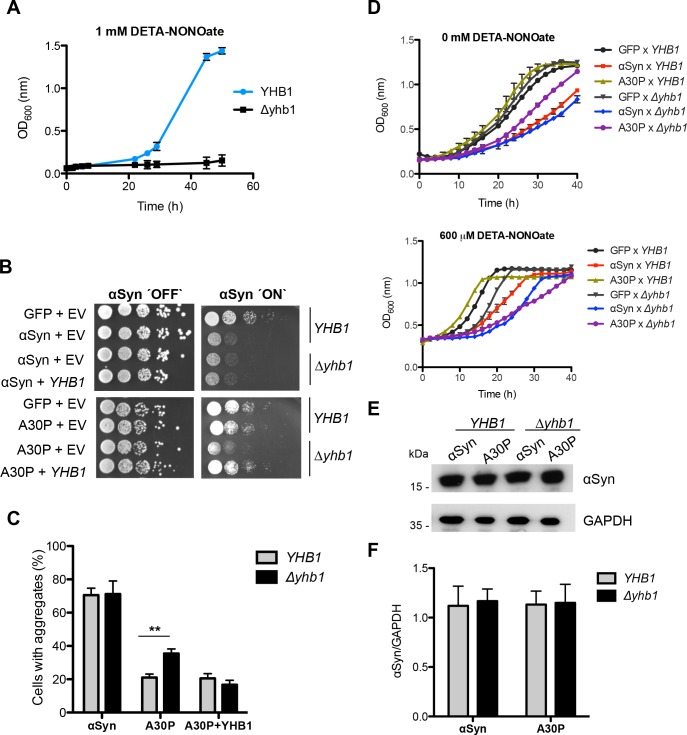
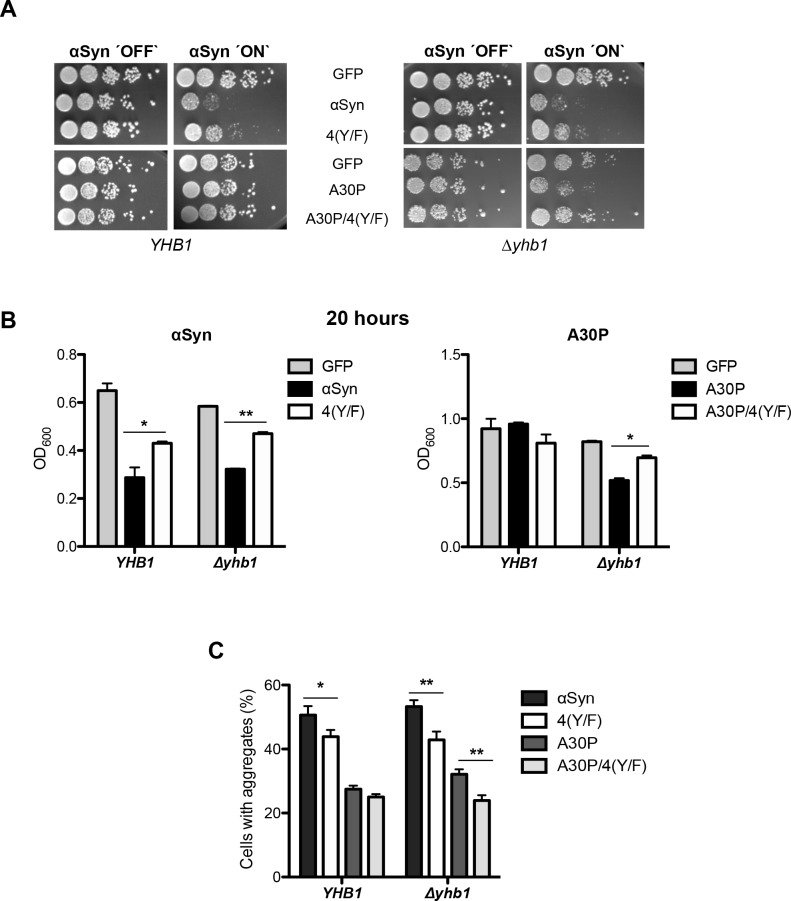
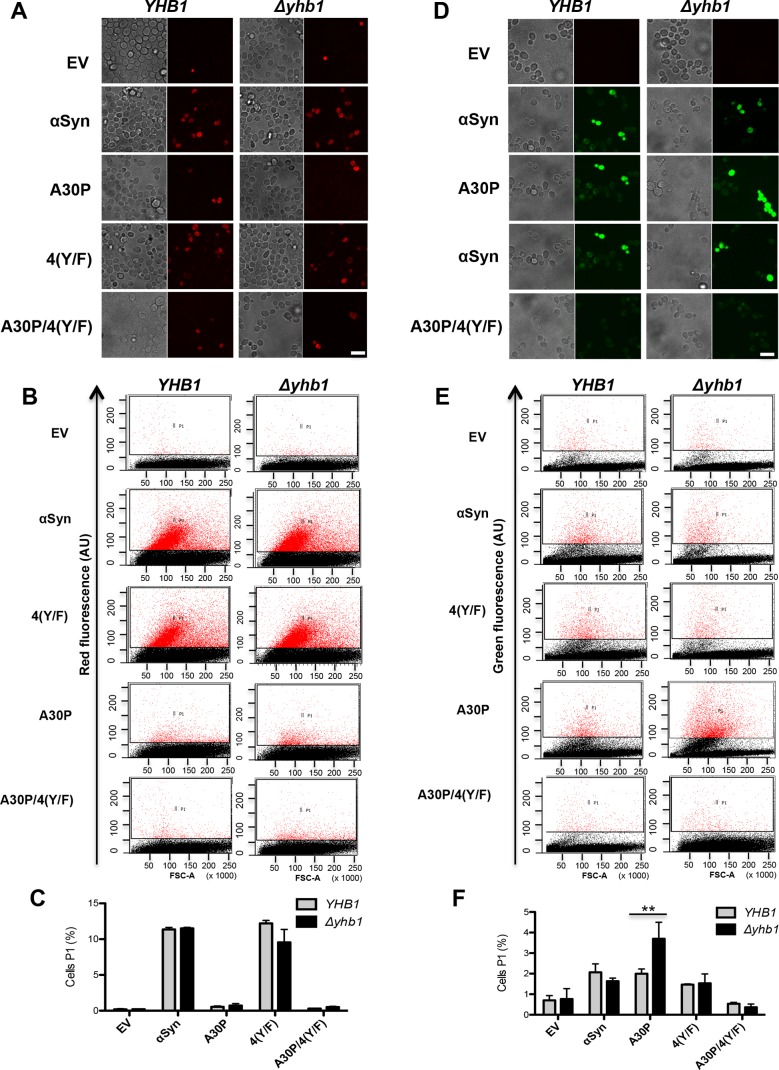
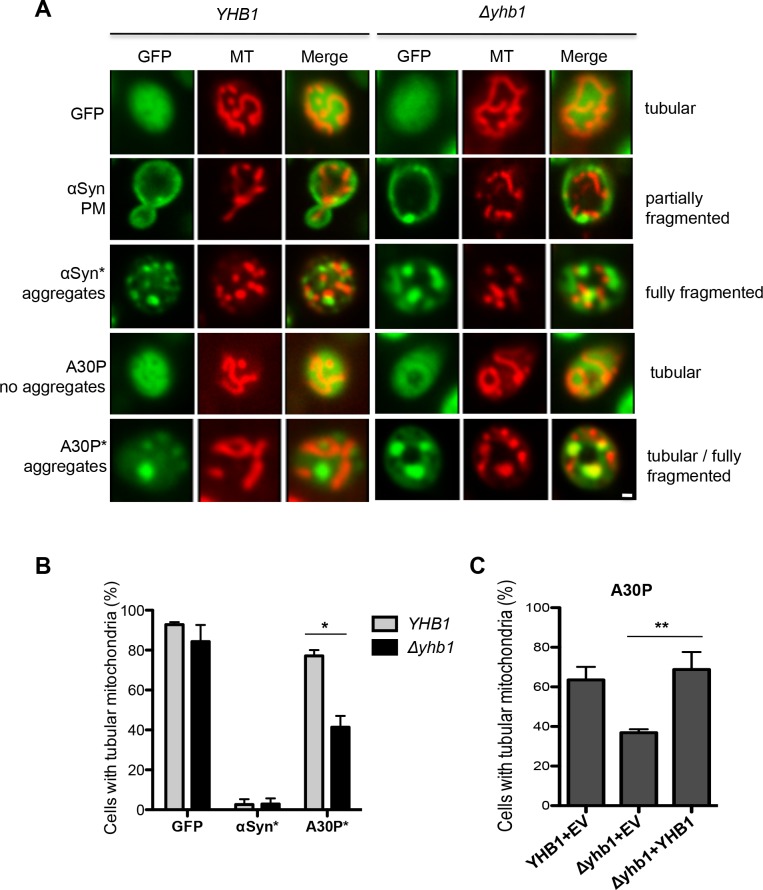
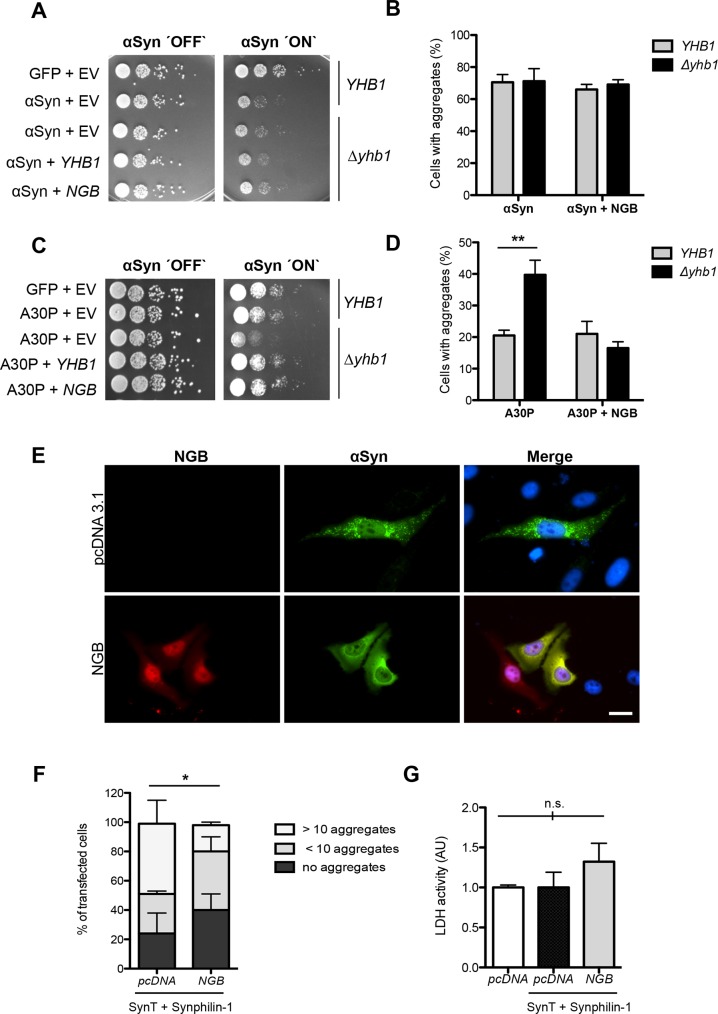
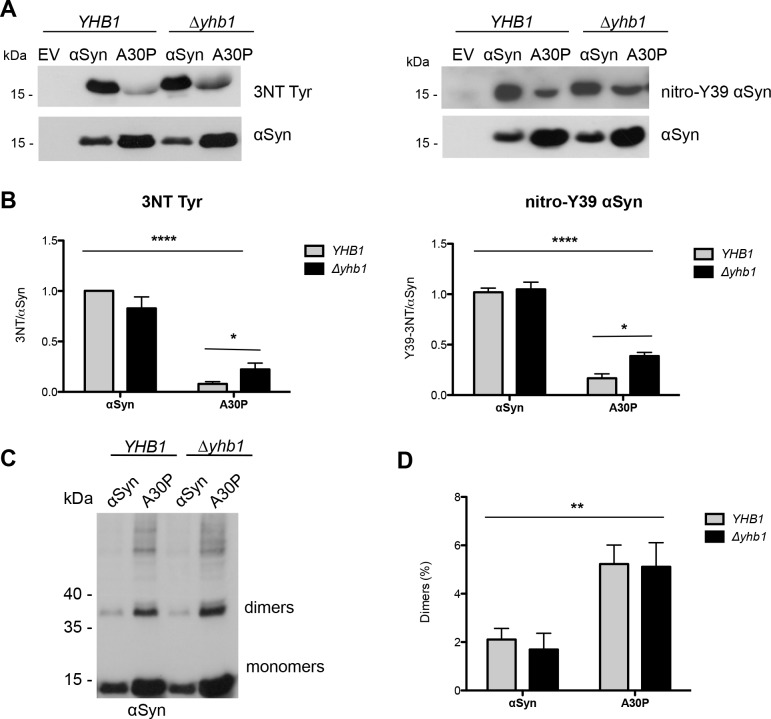
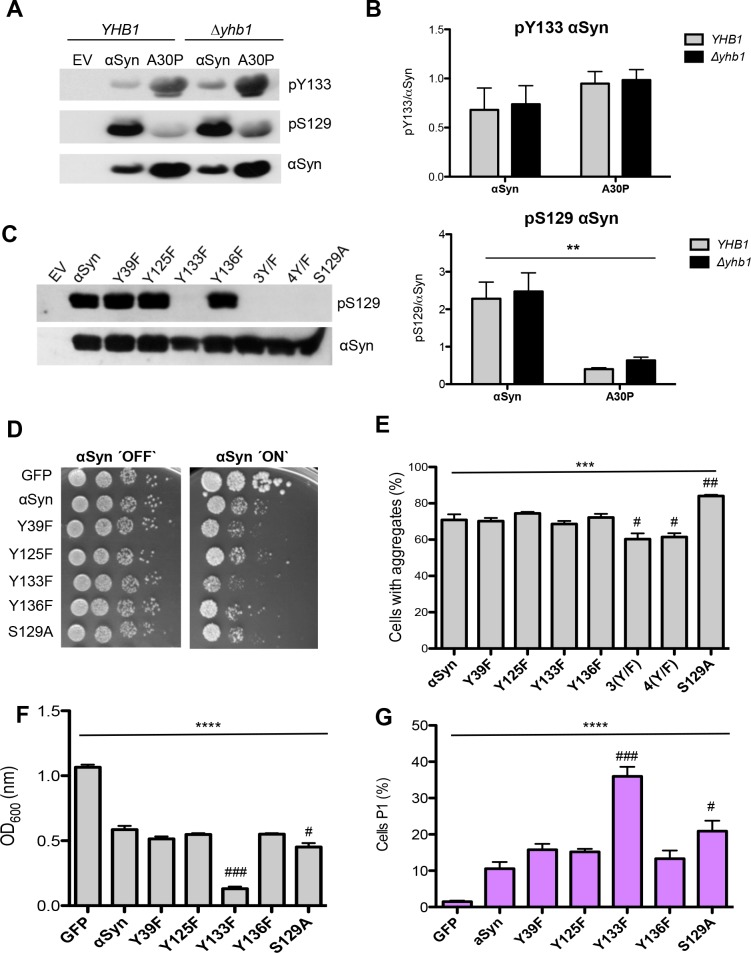
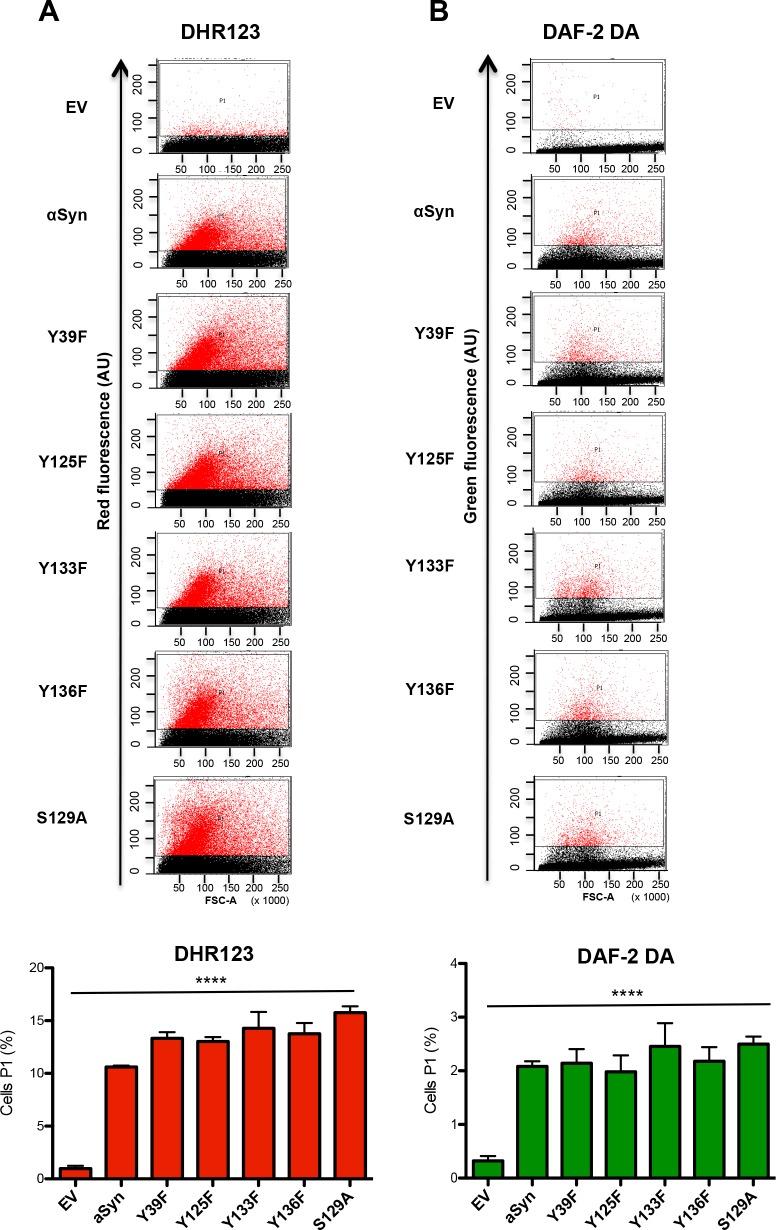
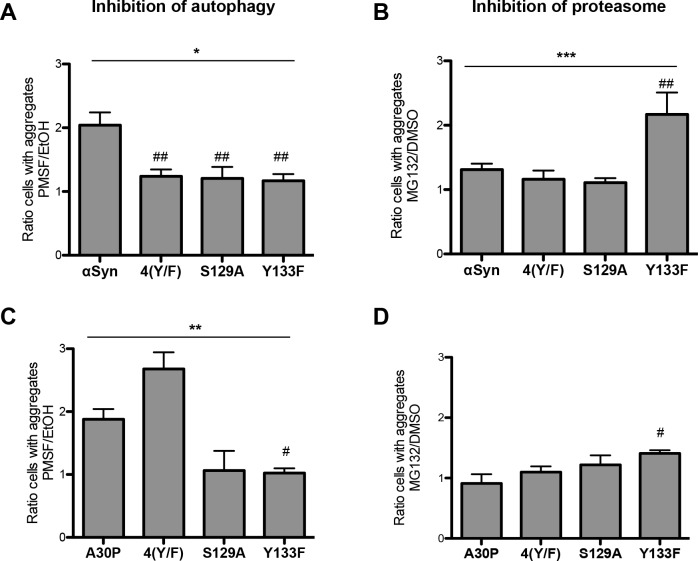
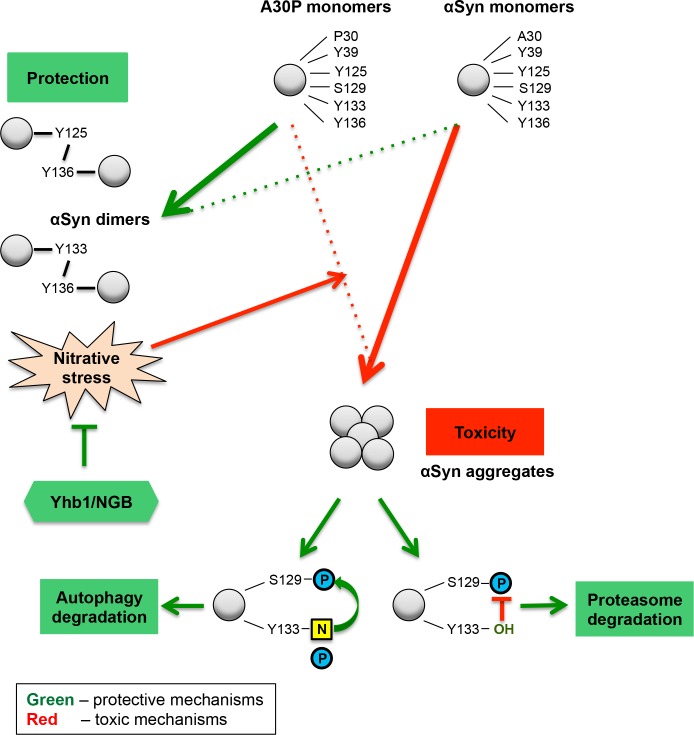
Parkinson´s disease (PD) is characterized by the presence of proteinaceous inclusions called Lewy bodies that are mainly composed of α-synuclein (αSyn). Elevated levels of oxidative or nitrative stresses have been implicated in αSyn related toxicity. Phosphorylation of αSyn on serine 129 (S129) modulates autophagic clearance of inclusions and is prominently found in Lewy bodies. The neighboring tyrosine residues Y125, Y133 and Y136 are phosphorylation and nitration sites. Using a yeast model of PD, we found that Y133 is required for protective S129 phosphorylation and for S129-independent proteasome clearance. αSyn can be nitrated and form stable covalent dimers originating from covalent crosslinking of two tyrosine residues. Nitrated tyrosine residues, but not di-tyrosine-crosslinked dimers, contributed to αSyn cytotoxicity and aggregation. Analysis of tyrosine residues involved in nitration and crosslinking revealed that the C-terminus, rather than the N-terminus of αSyn, is modified by nitration and di-tyrosine formation. The nitration level of wild-type αSyn was higher compared to that of A30P mutant that is non-toxic in yeast. A30P formed more dimers than wild-type αSyn, suggesting that dimer formation represents a cellular detoxification pathway in yeast. Deletion of the yeast flavohemoglobin gene YHB1 resulted in an increase of cellular nitrative stress and cytotoxicity leading to enhanced aggregation of A30P αSyn. Yhb1 protected yeast from A30P-induced mitochondrial fragmentation and peroxynitrite-induced nitrative stress. Strikingly, overexpression of neuroglobin, the human homolog of YHB1, protected against αSyn inclusion formation in mammalian cells. In total, our data suggest that C-terminal Y133 plays a major role in αSyn aggregate clearance by supporting the protective S129 phosphorylation for autophagy and by promoting proteasome clearance. C-terminal tyrosine nitration increases pathogenicity and can only be partially detoxified by αSyn di-tyrosine dimers. Our findings uncover a complex interplay between S129 phosphorylation and C-terminal tyrosine modifications of αSyn that likely participates in PD pathology.


Conflict of interest statement

The authors have declared that no competing interests exist.

Figures

Fig 1
Fig 1. αSyn forms dimers in vivo.
(A) Spotting analysis of yeast cells expressing C-terminally HIS6-tagged αSyn and A30P αSyn on a high copy vector (2μ) driven by the inducible GAL1-promoter on non-inducing (´OFF`: glucose) and inducing (´ON`: galactose) SC-Ura medium after 3 days. Control cells expressed only the empty vector pME2795 (EV). (B) Western blotting of αSyn and A30P enriched from cell extracts by Ni2+ pull-down with anti-αSyn antibody. In vitro nitration was carried out with 15 μg of αSyn extracts using 1 μl peroxynitrite (PON) in the presence of 1 μl 0.3 M HCl. (C) Quantification of dimers. Densitometric analysis of the immunodetection of αSyn and A30P αSyn dimers in vivo and in PON-treated samples. The amount of dimers is presented as percent of the total amount of αSyn detected per lane (monomer + dimer). Significance of differences was calculated with t-test (**, p < 0.01, n = 4).
Fig 2
Fig 2. Determination of nitrated peptides from αSyn and A30P.
αSyn and A30P were enriched by Ni2+ pull-down from yeast crude extracts and separated by SDS-PAGE. Monomeric and dimeric αSyn stained with Coomassie were excised from the gel and digested with trypsin and AspN. Untreated (in vivo) and subsequent peroxynitrite (PON) treated (in vitro) αSyn and A30P protein samples were analyzed with LC-MS for tyrosine nitration. 3-NT (3-nitrotyrosine) indicates identified nitration sites, supported by at least two peptides and two independent experiments.
Fig 3
Fig 3. Determination of crosslinked peptides from αSyn and A30P.
(A) Analysis of di-tyrosine dimers. Exemplary heat map diagram of the number (N) of identified di-tyrosine crosslinked peptides of the non-treated αSyn samples. (B) Distribution of all identified di-tyrosine peptides for αSyn. Identified combinations of crosslinked peptides are presented as percentage of n (n = total number of MS2 spectra verified as crosslinked peptides). (C) Distribution of all identified di-tyrosine peptides for A30P.
Fig 4
Fig 4. Blocking of αSyn tyrosine nitration decreases aggregation and cytotoxicity.
(A) Expression of αSyn, A30P, 4(Y/F) and A30P/4(Y/F) αSyn was induced for 12 h in galactose-containing medium and the proteins were enriched by Ni2+ pull-down from yeast cell extracts. For in vitro nitration, 1 μl peroxynitrite (PON) was mixed with 15 μg of αSyn extracts in the presence of 1 μl 0.3 M HCl. Western blotting with di-tyrosine antibody reveals a major band at about 36 kDa, corresponding to dimers. Additional bands with lower molecular weights are observed, probably due to intramolecular di-tyrosine crosslinking. The same membrane was stripped and re-probed with αSyn antibody. (B) Western blotting using 3-nitro-tyrosine antibody (3-NT). Phenylalanine codon substitutions eliminate immunoreactivity. The same membrane was stripped and re-probed with αSyn antibody. (C) Spotting analysis of yeast cells expressing GAL1-driven αSyn, A30P, 4(Y/F), A30P/4(Y/F) αSyn and GFP (control). Yeast cells were spotted in 10-fold dilutions on SC-Ura plates containing glucose (αSyn ‘OFF’) or galactose (αSyn ‘ON’). (D) Cell growth analysis of yeast cells expressing αSyn, A30P, 4(Y/F), A30P/4(Y/F) αSyn and GFP (control) in galactose-containing SC-Ura medium for 40 h. Error bars represent standard deviations of three independent experiments. (E) Fluorescence microscopy of yeast cells, expressing indicated αSyn-GFP variants after 6 h of induction in galactose-containing medium. Scale bar: 1 μm. (F) Quantification of the percentage of cells displaying aggregates after 6 h induction in galactose-containing medium. Significance of differences was calculated with t-test (*, p < 0.05, n = 6). (G) Western blotting analysis of protein crude extracts of GFP-tagged αSyn, 4(Y/F), A30P and A30P/4(Y/F) after 6 h induction in galactose-containing medium. GAPDH antibody was used as loading control.
Fig 5
Fig 5. The nitric oxide oxidoreductase Yhb1 reduces A30P aggregation and toxicity.
(A) Cell growth comparison of wild-type YHB1 and mutant Δyhb1 yeast cells in the presence of the NO stress-mediating drug DETA-NONOate (1 mM) in liquid galactose-containing SC-Ura medium. Error bars indicate standard deviations of three independent experiments. (B) Spotting analysis of YHB1 and Δyhb1 yeast cells expressing αSyn (upper boxes) or A30P (lower boxes) compared to GFP and empty vector (EV) as control on non-inducing and galactose-inducing SC-Ura medium after 3 days. (C) Quantification of the percentage of cells displaying αSyn aggregates after 6 h induction in galactose-containing medium. Significance of differences was calculated with t-test (**, p < 0.01, n = 6). (D) Cell growth analysis of YHB1 and Δyhb1 yeast cells expressing αSyn, A30P, 4(Y/F), A30P/4(Y/F) and GFP (control) after 40 h induction in galactose-containing SC-Ura medium. (upper panel,—DETA-NONOate; lower panel, + 600 μM DETA-NONOate). Error bars show standard deviations of three independent experiments. (E) Western blotting analysis of protein crude extracts of αSyn and A30P expressed in YHB1 and Δyhb1 yeast after 6 h induction in galactose-containing medium. GAPDH antibody was used as loading control. (F) Quantification of αSyn and A30P levels in YHB1 and Δyhb1 yeast cells. Densitometric analysis of the immunodetection of αSyn and A30P relative to the intensity obtained for GAPDH (n = 3).
Fig 6
Fig 6. Tyrosine mutation of A30P decreases toxicity in Δyhb1.
(A) Spotting analysis of αSyn, A30P, 4(Y/F) αSyn, A30P/4(Y/F) and GFP (control) expressed in YHB1 and Δyhb1 yeast on non-inducing and galactose-inducing SC-Ura plates after 3 days of growth. (B) Cell growth analysis of YHB1 and Δyhb1 yeast expressing αSyn, A30P, 4(Y/F), A30P/4(Y/F) and GFP (control) at time point 20 h. Significance of differences was calculated with t-test (*, p < 0.05; **, p < 0.01, n = 3). (C) Quantification of the percentage of cells displaying αSyn aggregates after 6 h induction in galactose-containing SC-Ura medium. Significance of differences was calculated with t-test (*, p < 0.05, **, p < 0.01, n = 6).
Fig 7
Fig 7. YHB1 deletion increases accumulation of reactive nitrogen species (RNS) in A30P expressing cells.
(A) αSyn, A30P, 4(Y/F) and A30P/4(Y/F) were induced in galactose-containing medium for 6 h in YHB1 wild-type or Δyhb1 deletion yeast strains. Cells were incubated with dihydrorhodamine 123 (DHR123) as an indicator of high intracellular ROS accumulation for 1.5 h and analyzed by live-cell fluorescence microscopy. Scale bar = 5 μm. (B) Fluorescent intensity of cells from (A), assessed with flow cytometry analysis. Forward scatter (FSC) and DHR123 fluorescence of cells after 6 h induction of αSyn expression. (C) Quantification of αSyn, A30P, 4(Y/F) and A30P/4(Y/F) expressing cells displaying ROS stained by DHR123 using flow cytometry. The percentage of the sub-population of yeast cells with higher fluorescent intensities (P1) than the background is presented. (D) Microscopy analysis of RNS stained cells. αSyn, A30P, 4(Y/F) and A30P/4(Y/F) were induced in galactose-containing SC-Ura medium for 6 h in YHB1 and Δyhb1 yeast strains. Cells were incubated with DAF-2 DA for 1 h at 30°C for visualization of RNS and analyzed by live-cell fluorescence microscopy. Scale bar = 5 μm. (E) Fluorescent intensity of cells from (D), assessed with flow cytometry analysis. Forward scatter (FSC) and DAF-2 DA fluorescence of cells after 6 h induction of αSyn expression. (F) Quantification of αSyn, A30P, 4(Y/F) and A30P/4(Y/F) expressing cells displaying RNS stained by DAF-2 DA using flow cytometry. The percentage of the sub-population of yeast cells with higher fluorescent intensities (P1) than the background is presented. Significance of differences was calculated with t-test (**, p < 0.01, n = 3).
Fig 8
Fig 8. Yhb1 protects mitochondria from A30P toxicity.
(A) Live-cell fluorescence microscopy of YHB1 compared to Δyhb1 yeast cells expressing GFP (control), αSyn or A30P after 6 h induction in galactose-containing medium. MitoTracker Red was used to visualize mitochondria in the cells (MT panel). αSyn expressing cells with plasma membrane localization (PM) and with aggregates are visualized. Scale bar = 1 μM. (B) Quantification of yeast cells with tubular mitochondrial network. GFP: percentage of all cells with tubular mitochondria; αSyn* and A30P*: percentage of cells with aggregates, showing tubular mitochondria. At least 50 cells were counted per cell type and experiment. Significance of differences was calculated with t-test (*, p < 0.05, n = 4). (C) Quantification of yeast cells with tubular mitochondrial network for rescue of A30P phenotype. A30P with empty vector (EV) in YHB1 and Δyhb1 strain and A30P co-transformed with YHB1 on low-copy vector in Δyhb1 strain. A30P*: percentage of cells with aggregates, showing tubular mitochondria. Significance of differences was calculated with t-test (**, p < 0.01, n = 3).
Fig 9
Fig 9. The human NGB gene for neuroglobin alters A30P and αSyn aggregation in yeast and mammalian cells.
(A) Spotting analysis of YHB1 and Δyhb1 yeast cells co-expressing αSyn and GFP (control) with either empty vector as control or YHB1 and NGB, respectively, on non-inducing and galactose-inducing SC-Ura medium after 3 days. (B) Quantification of the percentage of cells displaying αSyn aggregates after 6 h induction in galactose-containing medium (n = 3). (C) Spotting analysis of YHB1 and Δyhb1 yeast cells co-expressing A30P and GFP (control) with either empty vector (pME2788) as control or YHB1 and NGB, respectively, on non-inducing and galactose-inducing SC-Ura medium after 3 days. (D) Quantification of the percentage of cells displaying A30P aggregates after 6 h induction in galactose-containing medium. Significance of differences was calculated with t-test (**, p < 0.01, n = 3). (E) Fluorescence microscopy of H4 cells co-expressing SynT, synphilin-1 and pcDNA (control) or NGB-mCherry. Nuclei are stained with Hoechst dye (blue). Scale bar = 30 μm. (F) Quantification of the percentage of H4 cells displaying αSyn inclusions after 48 h after transfection. Cells were classified into three groups according to the number of αSyn-immunoreactive inclusions observed: cells with 10 inclusions, cells with less than 10 inclusions and cells without inclusions. Significance of differences was calculated with t-test (*, p < 0.05, n = 3). (G) Lactate dehydrogenase (LDH) activity measurements support that NGB is non-toxic for H4 cells. H4 cells transfected with empty mammalian expression vector pcDNA3.1, with empty pcDNA3.1 or pcDNA3.1 encoding neuroglobin-mCherry (NGB) together with SynT and synphilin-1 (SynT+Synphilin-1) were analyzed. Media from indicated H4 cells were collected and the secretion of lactate LDH was determined as a measure of cytotoxicity. Significance of differences was calculated with t-test (not significant (n.s.); n = 3).
Fig 10
Fig 10. Yhb1 affects nitration but not dimerization of αSyn and A30P.
(A) Immunoblotting analysis of 3-nitrotyrosine using 3-nitrotyrosine antibody (left) and nitro-Y39 αSyn antibody (right). Protein expression was induced for 12 h in galactose-containing SC-Ura medium. Concentrated protein extracts of Ni2+ pull down-enriched αSyn and A30P αSyn from YHB1 and Δyhb1 yeast cells were applied. Cells expressing empty vector (EV) served as control. The same membranes were stripped and re-probed with αSyn antibody. (B) Quantification of αSyn and A30P nitration levels in YHB1 and Δyhb1 yeast cells. Densitometric analysis of the immunodetection of nitrated αSyn and A30P relative to the intensity obtained for αSyn. Significance of differences was calculated with one-way ANOVA with Bonferroni’s multiple comparison test (*, p < 0.05; ****, p < 0.0001; n = 3). (C) Western blotting of αSyn enriched by Ni2+ pull-down with αSyn antibody. (D) Ratio of dimers relative to the sum of monomers and dimers. Densitometric analysis of the immunodetection of αSyn and A30P αSyn dimers, presented as percent of the total amount of αSyn detected per lane (monomer + dimer). Significance of differences was calculated with one-way ANOVA (**, p < 0.01; n = 4).
Fig 11
Fig 11. Tyrosine 133 is required for phosphorylation of αSyn at serine 129.
(A) Western blotting of αSyn and A30P expressed in YHB1 and Δyhb1 yeast enriched by Ni2+ pull-down, using Y133 phosphorylation-specific αSyn antibody (pY133) and S129 phosphorylation-specific αSyn antibody (pS129). The same membrane was stripped and re-probed with αSyn antibody. (B) Quantification of αSyn and A30P Y133- and S129-phosphorylation levels in YHB1 and Δyhb1 yeast cells. Densitometric analysis of the immunodetection of pY133, pS129 αSyn and A30P relative to the intensity obtained for αSyn. Significance of differences was calculated with one-way ANOVA test (**, p < 0.01; n = 4). (C) Western blotting of crude extracts from yeast cells, expressing different αSyn variants after 6 h induction of protein expression using S129 phosphorylation-specific αSyn antibody (pS129) and αSyn antibody. Cells expressing S129A mutant served as control. (D) Spotting analysis of αSyn and indicated mutant strains, driven by the inducible GAL1-promoter on non-inducing (´OFF`: glucose) and inducing (´ON`: galactose) SC-Ura medium after 3 days. Cells expressing GFP served as control. (E) Quantification of the percentage of cells displaying αSyn aggregates after 6 h induction in galactose-containing SC-Ura medium. Significance of differences was calculated with one-way ANOVA (***, p < 0.001) or Dunnett’s multiple comparison test (#, p < 0.05, ##, p < 0.01 versus αSyn; n = 6). (F) Cell growth analysis of cells expressing different αSyn variants and GFP (control) after 20 h induction of expression. Significance of differences was calculated with one-way ANOVA (****, p < 0.0001) or Dunnett’s multiple comparison test (#, p < 0.05; ###, p < 0.001, n = 4). (G) Quantification of cells expressing different αSyn variants and GFP (control) displaying Propidium Iodide (PI) fluorescence after 20 h induction of αSyn expression, assessed by flow cytometry. The percentage of PI-positive yeast cells with higher fluorescent intensities (P1) than the background is presented. Significance of differences was calculated with one-way ANOVA (****, p < 0.0001) or Dunnett’s multiple comparison test (#, p < 0.05; ###, p < 0.001 versus αSyn; n = 4).
Fig 12
Fig 12. Tyrosine 133 mutation does not alter the accumulation of reactive oxygen and nitrogen species.
(A, B) Quantification of cells expressing different αSyn variants displaying ROS and RNS assessed with flow cytometry analysis. αSyn expression was induced for 6 h and the cells were stained for 1.5 h with DHR123 to visualize ROS (A) or with DAF-2 DA to visualize RNS (B). Forward scatter (FSC) and DHR123 (A) or DAF-2 DA (B) fluorescence of the cells, showing one representative result from at least four independent experiments. The percentage of the sub-populations of yeast cells with higher fluorescent intensities (P1) than the background are presented in the lower panels. Significance of differences was calculated with one-way ANOVA (****, p < 0.0001).
Fig 13
Fig 13. αSyn aggregate clearance after promoter shut-off.
(A, C) Quantification of cells displaying aggregates of αSyn (A) and A30P (C) upon inhibition of autophagy by PMSF. Cells expressing αSyn (A) or A30P (C) and its 4(Y/F), S129A and Y133F variants were incubated in 2% galactose-containing media for 4 h and shifted to 2% glucose-containing media supplemented with 1 mM PMSF dissolved in EtOH and only EtOH as a control. Cells with aggregates were counted after 4 h GAL1-promoter shut-off and presented as a ratio to the control (EtOH). Significance of differences was calculated with one-way ANOVA (*, p < 0.05; **, p < 0.01) or Dunnett’s multiple comparison test (#, p < 0.05; ##, p < 0.01 versus αSyn; n = 4). (B, D) Quantification of cells displaying aggregates of αSyn (B) and A30P (D) upon inhibition of the proteasome by MG132. Cells expressing αSyn (B) or A30P (D) and the indicated 4(Y/F), S129A and Y133F variants were incubated in 2% galactose-containing media for 4 h and shifted to glucose medium, supplemented with 75 μM MG132, dissolved in DMSO or only DMSO as a control. Cells with aggregates were counted after 4 h GAL1-promoter shut off and presented as a ratio to the control (DMSO). Significance of differences was calculated with one-way ANOVA (***, p < 0.001) or Dunnett’s multiple comparison test (#, p < 0.05; ##, p < 0.01 versus αSyn; n = 4).
Fig 14
Fig 14. αSyn posttranslational modifications and nitrative stress in yeast.
Enhanced intracellular nitrative stress increases the protein nitration level and influences yeast growth and aggregation. The nitration of tyrosine residues acts as trigger for αSyn and A30P toxicity. Wild-type αSyn, which is highly nitrated, inhibits growth and shows a high aggregation rate. A30P is weakly nitrated and therefore, does not inhibit yeast growth and has a low aggregation propensity. Yhb1 and its human homolog NGB protect the cells against accumulation of nitrative species and diminish the aggregate formation. Di-tyrosine crosslinked dimers are formed in reverse correlation to cytotoxicity and do not depend on Yhb1. A30P forms twice as many dimers as the toxic αSyn variant, suggesting that the di-tyrosine crosslinked dimers are not toxic species and are presumably part of a cellular detoxification pathway, sequestering the protein off-pathway of αSyn nucleation. The C-terminal tyrosine modifications have dual effect on the toxicity of the protein. Y133, which is nitrated and phosphorylated, is required for the protective phosphorylation at S129 and for the autophagy degradation of αSyn aggregates. Non-modified Y133 promotes the proteasomal degradation of αSyn aggregates. N: nitration; P: phosphorylation.

Similar articles

Cited by

References

    1. de Rijk MC, Launer LJ, Berger K, Breteler MM, Dartigues JF, Baldereschi M, et al. Prevalence of Parkinson's disease in Europe: A collaborative study of population-based cohorts. Neurologic Diseases in the Elderly Research Group. Neurology. 2000;54(11 Suppl 5):S21–3. - PubMed
    1. German DC, Manaye K, Smith WK, Woodward DJ, Saper CB. Midbrain dopaminergic cell loss in Parkinson's disease: computer visualization. Ann Neurol. 1989;26(4):507–14. - PubMed
    1. German DC, Manaye KF, Sonsalla PK, Brooks BA. Midbrain dopaminergic cell loss in Parkinson's disease and MPTP-induced parkinsonism: sparing of calbindin-D28k-containing cells. Ann N Y Acad Sci. 1992;648:42–62. - PubMed
    1. Gibb WR, Lees AJ. Anatomy, pigmentation, ventral and dorsal subpopulations of the substantia nigra, and differential cell death in Parkinson's disease. Journal of neurology, neurosurgery, and psychiatry. 1991;54(5):388–96. Epub 1991/05/01. - PMC - PubMed
    1. Fedorow H, Tribl F, Halliday G, Gerlach M, Riederer P, Double KL. Neuromelanin in human dopamine neurons: comparison with peripheral melanins and relevance to Parkinson's disease. Progress in neurobiology. 2005;75(2):109–24. Epub 2005/03/24. - PubMed

Publication types