. 2016 Oct;151(4):733-746.e12.
doi: 10.1053/j.gastro.2016.06.022. Epub 2016 Jun 21.

Loss of Junctional Adhesion Molecule A Promotes Severe Steatohepatitis in Mice on a Diet High in Saturated Fat, Fructose, and Cholesterol

Affiliations

Loss of Junctional Adhesion Molecule A Promotes Severe Steatohepatitis in Mice on a Diet High in Saturated Fat, Fructose, and Cholesterol

Khalidur Rahman et al. Gastroenterology. 2016 Oct.

Abstract

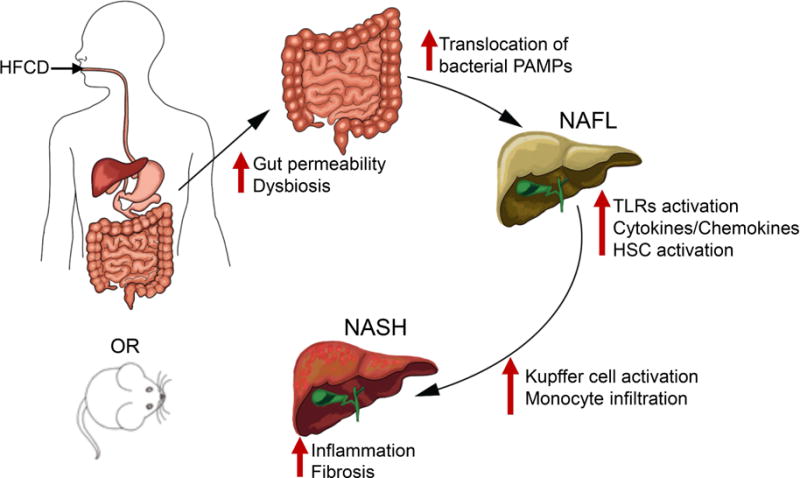
Background & aims: There is evidence from clinical studies that compromised intestinal epithelial permeability contributes to the development of nonalcoholic steatohepatitis (NASH), but the exact mechanisms are not clear. Mice with disruption of the gene (F11r) encoding junctional adhesion molecule A (JAM-A) have defects in intestinal epithelial permeability. We used these mice to study how disruption of the intestinal epithelial barrier contributes to NASH.

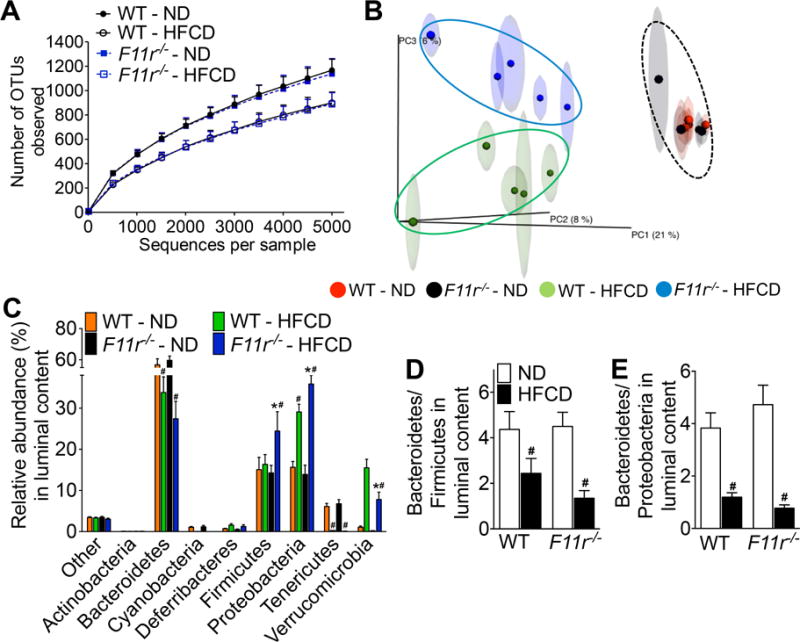
Methods: Male C57BL/6 (control) or F11r(-/-) mice were fed a normal diet or a diet high in saturated fat, fructose, and cholesterol (HFCD) for 8 weeks. Liver and intestinal tissues were collected and analyzed by histology, quantitative reverse-transcription polymerase chain reaction, and flow cytometry. Intestinal epithelial permeability was assessed in mice by measuring permeability to fluorescently labeled dextran. The intestinal microbiota were analyzed using 16S ribosomal RNA sequencing. We also analyzed biopsy specimens from proximal colons of 30 patients with nonalcoholic fatty liver disease (NAFLD) and 19 subjects without NAFLD (controls) undergoing surveillance colonoscopy.

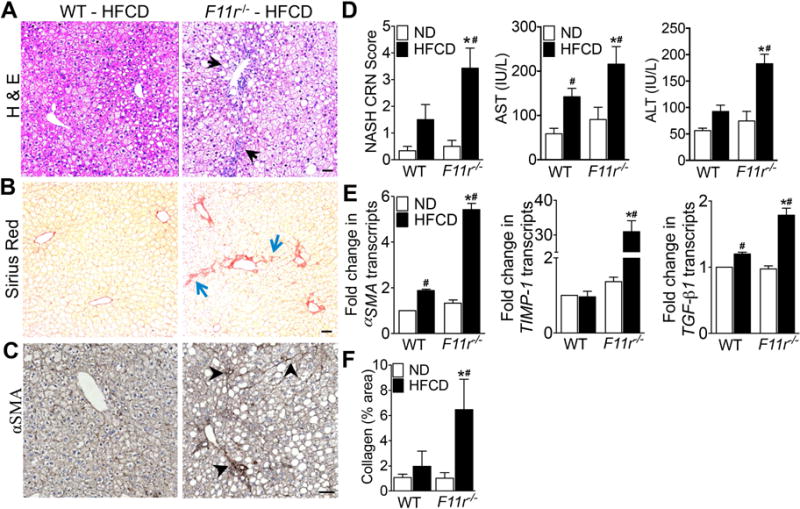
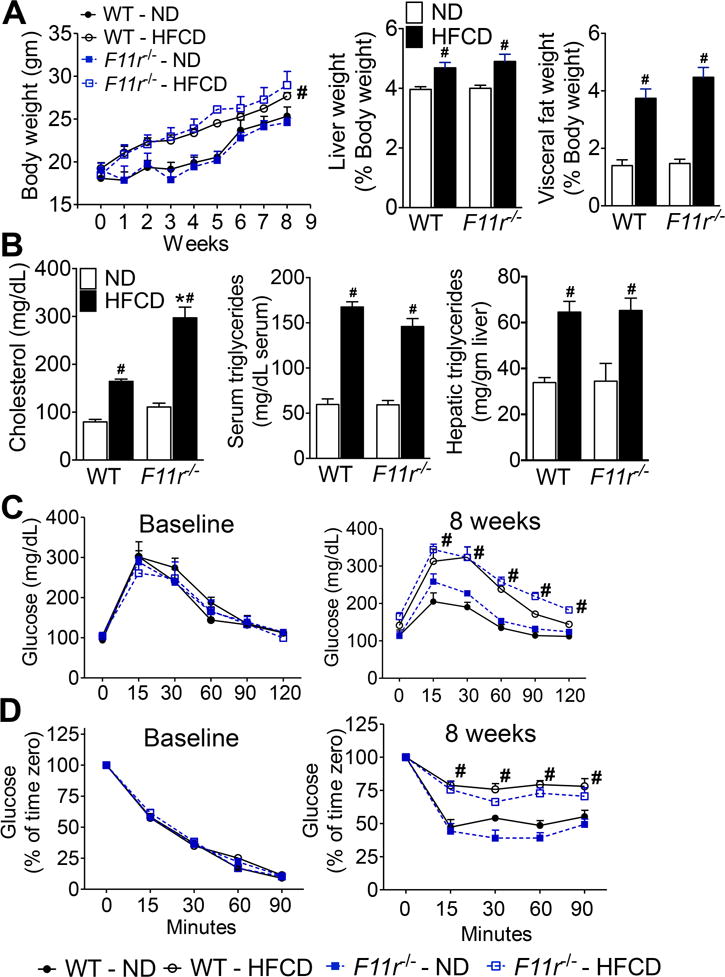
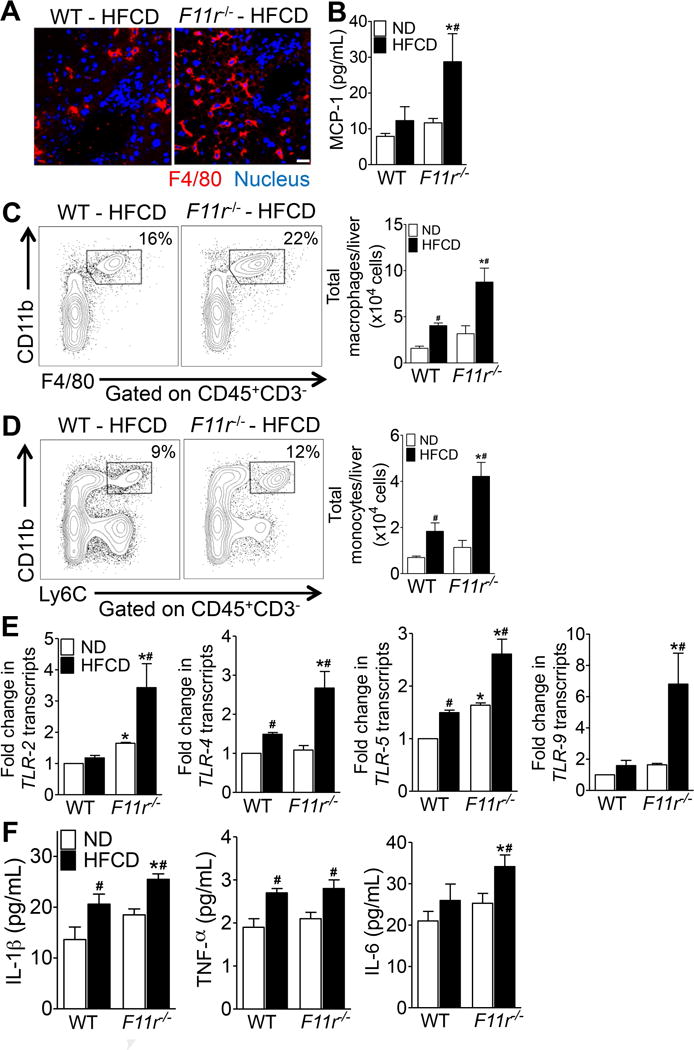
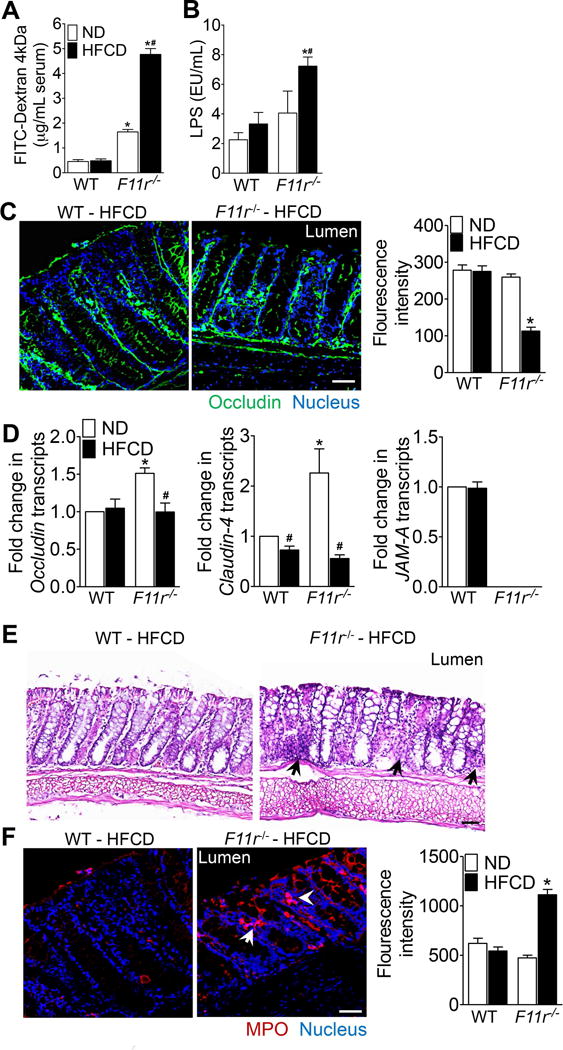
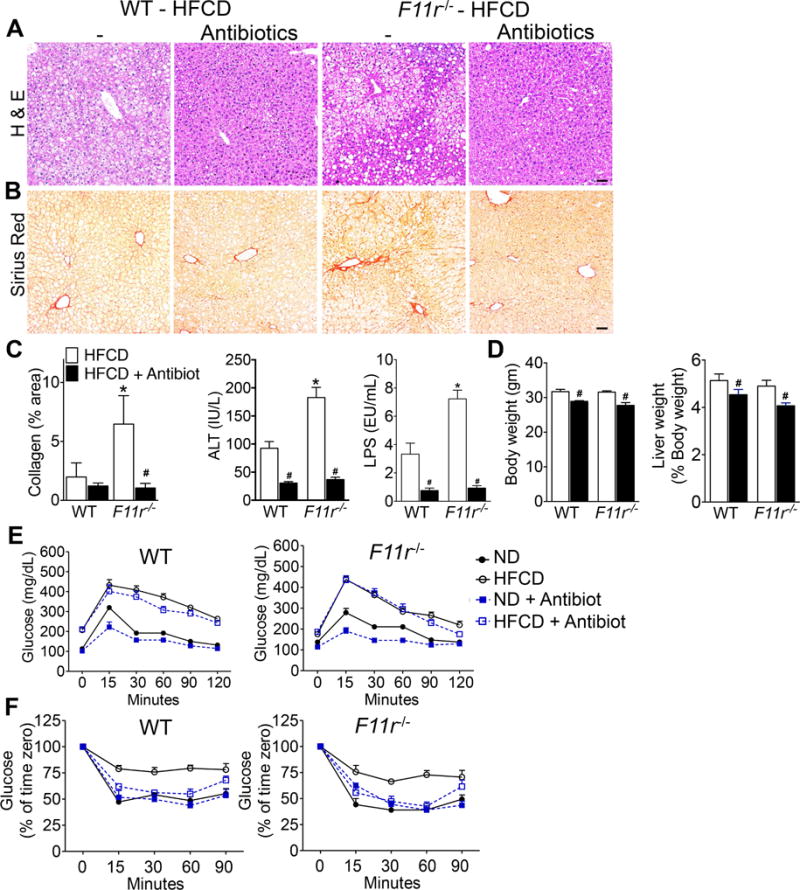
Results: F11r(-/-) mice fed a HFCD, but not a normal diet, developed histologic and pathologic features of severe NASH including steatosis, lobular inflammation, hepatocellular ballooning, and fibrosis, whereas control mice fed a HFCD developed only modest steatosis. Interestingly, there were no differences in body weight, ratio of liver weight:body weight, or glucose homeostasis between control and F11r(-/-) mice fed a HFCD. In these mice, liver injury was associated with significant increases in mucosal inflammation, tight junction disruption, and intestinal epithelial permeability to bacterial endotoxins, compared with control mice or F11r(-/-) mice fed a normal diet. The HFCD led to a significant increase in inflammatory microbial taxa in F11r(-/-) mice, compared with control mice. Administration of oral antibiotics or sequestration of bacterial endotoxins with sevelamer hydrochloride reduced mucosal inflammation and restored normal liver histology in F11r(-/-) mice fed a HFCD. Protein and transcript levels of JAM-A were significantly lower in the intestinal mucosa of patients with NAFLD than without NAFLD; decreased expression of JAM-A correlated with increased mucosal inflammation.

Conclusions: Mice with defects in intestinal epithelial permeability develop more severe steatohepatitis after a HFCD than control mice, and colon tissues from patients with NAFLD have lower levels of JAM-A and higher levels of inflammation than subjects without NAFLD. These findings indicate that intestinal epithelial barrier function and microbial dysbiosis contribute to the development of NASH. Restoration of intestinal barrier integrity and manipulation of gut microbiota might be developed as therapeutic strategies for patients with NASH.

Keywords: Bacterial Translocation; Claudin-4; Occludin.


Conflict of interest statement

All authors declare no conflicting interests.

Figures

Figure 1
Figure 1. F11r−/− mice fed a high fat, high fructose and high cholesterol diet develop severe histologic features of NASH
Photomicrographs of (A) Hematoxylin and Eosin (H&E) and (B) Sirius Red-stained liver tissue sections of control (WT) and F11r−/− mice fed a high fat, high fructose and high cholesterol diet (HFCD) for 8 weeks (n = 15). (C) Immunohistochemical staining of α-smooth muscle actin after 8 weeks of feeding (αSMA; n = 10). Black arrows, ballooning degeneration and macrosteatosis; blue arrows, collagen deposition; black arrowheads, αSMA expression. (D) NASH-CRN score, and serum AST and ALT levels (n = 10). (E) Expression of key hepatic stellate cell activation markers and markers of fibrosis in the liver (n = 5). (F) Quantitative analysis of Sirius Red stained liver tissue sections (n = 10). Data shown are representative of three independent experiments. Data are presented as mean ± SEM. Asterisks indicate significant differences (p < 0.05) between control and F11r−/− mice fed an identical diet. Hashtags indicate significant differences (p < 0.05) between normal diet or HFCD-fed control and F11r−/− mice. Scale bar 20 μm.
Figure 2
Figure 2. F11r−/− and control mice fed a high fat, high fructose and high cholesterol diet develop metabolic parameters associated with NAFLD
(A) Changes in body, liver and visceral fat weight in control (WT) and F11r−/− mice fed a normal diet (ND) or a high fat, high fructose and high cholesterol diet (HFCD) for 8 weeks (n = 15). Changes in the liver and visceral fat weights are reported as percent of body weight. (B) Changes in serum cholesterol and triglycerides, and hepatic triglyceride levels (n = 10). (C) Glucose and (D) insulin tolerance at baseline and after 8 weeks of feeding (n = 10). Data shown are representative of three independent experiments. Data are presented as mean ± SEM. Asterisks indicate significant differences (p < 0.05) between control and F11r−/− mice fed an identical diet. Hashtags indicate significant differences (p < 0.05) between normal diet- or HFCD-fed control and F11r−/− mice.
Figure 3
Figure 3. High fat, high fructose and high cholesterol diet induces severe hepatic inflammation in F11r−/− mice
(A) Confocal microscopic images of F4/80+ Kupffer cells (red) in the liver of control (WT) and F11r−/− mice fed a high fat, high fructose and high cholesterol diet (HFCD) for 8 weeks (n = 5). Nuclei are stained blue. Scale 20 μm. (B) Quantification of hepatic MCP-1 expression in control and F11r−/− mice fed a normal diet (ND) or a HFCD for 8 weeks (n = 5). (C, D) Flow cytometric analysis of percent and absolute number of (C) CD11b+F4/80+ macrophages and (D) CD11b+Ly6C+ monocytes in the liver of control and F11r−/− mice fed a normal diet (n = 5) or a HFCD (n = 8) for 8 weeks. (E) Expression of key bacterial toll-like receptors (TLRs) in the liver and (F) quantification of hepatic pro-inflammatory cytokines after 8 weeks of feeding (n = 5). Data shown are representative of two independent experiments. Data are presented as mean ± SEM. Asterisks indicate significant differences (p < 0.05) between control and F11r−/− mice fed an identical diet. Hashtags indicate significant differences (p < 0.05) between normal diet- or HFCD-fed control and F11r−/− mice.
Figure 4
Figure 4. High fat, high fructose and high cholesterol diet induces intestinal epithelial barrier disruption, mucosal inflammation and translocation of gut microbial products in F11r−/− mice
(A) Intestinal permeability to FITC-dextran in control (WT) and F11r−/− mice fed a normal diet (ND) or a high fat, high fructose and high cholesterol diet (HFCD) for 8 weeks (n = 8). (B) Serum LPS levels after 8 weeks of normal diet (n = 5) and HFCD (n = 7) feeding. (C) Confocal images and quantification of occludin (green) immunofluorescence in the colonic mucosa (n = 5). Nuclei are stained blue. Scale bar 100 μm. (D) Photomicrographs of H&E-stained colonic tissue (n = 5). Black arrows, immune cells. Scale 20 μm. (E) Confocal images with quantification of myeloperoxidase (MPO, red) immunofluorescence in the colonic mucosa (n = 5). Nuclei are stained blue. White arrows, cells expressing MPO. Scale bar 100 μm. Data shown are representative of two independent experiments. Data are presented as mean ± SEM. Asterisks indicate significant differences (p < 0.05) between control and F11r−/− mice fed an identical diet. Hashtags indicate significant differences (p < 0.05) between the normal diet- or HFCD-fed control and F11r−/− mice.
Figure 5
Figure 5. Diet mediated alteration in gut microbiota promotes NAFLD progression in F11r−/− mice
Luminal microbiota from control (WT) and F11r−/− mice fed a normal diet (ND) or a high fat, high fructose and high cholesterol diet (HFCD) for 8 weeks were analyzed using 16S rRNA sequencing followed by phylogenetic analysis and a comparison of the microbial community structure using the unweighted UniFrac algorithm (n = 5). (A) Microbiota richness and diversity in the luminal content (n = 5). (B) Jackknifed principal coordinate analysis (PCoA) of the un-weighted UniFrac distance matrix of the luminal microbiota. The ovals represent clustering by treatment groups (n = 5). (C) Relative abundance of luminal bacterial phyla in control and F11r−/− mice after 8 weeks of feeding (n = 5). The ratios of (D) Bacteroidetes to Firmicutes and (E) Bacteroidetes to Proteobacteria in the luminal content (n = 5). Data are presented as mean ± SEM. Asterisks indicate significant differences (p < 0.05) between control and F11r−/− mice fed an identical diet. Hashtags indicate significant differences (p < 0.05) between the normal diet- or HFCD-fed control and F11r−/− mice.
Figure 6
Figure 6. Depletion of gut microbiota improves NASH histopathology and metabolic parameters in a high fat, high fructose and high cholesterol diet-fed control and F11r−/− mice
Photomicrographs of (A) H&E and (B) Sirius Red-stained liver tissue sections of control (WT) and F11r−/− mice fed a high fat, high fructose, and high cholesterol diet (HFCD) or a HFCD plus antibiotics for 8 weeks (n = 10). Scale 20 μm. (C) Quantitative analysis of Sirius Red stained liver tissue sections (n = 10), and serum ALT and LPS levels after 8 weeks of treatment (n = 5). Changes in (C) body, liver and visceral fat weights after 8 weeks of treatment (n = 10). Changes in the liver and visceral fat weights are reported as the percentages of the body weight. (D) Glucose and (E) insulin tolerance after 8 weeks of treatment (n = 10). Data shown are representative of two independent experiments. Data are presented as mean ± SEM. Asterisks indicate significant differences (p < 0.05) between control and F11r−/− mice fed an identical diet. Hashtags indicate significant differences (p < 0.05) between HFCD or HFCD plus antibiotic-treated mice.
Figure 7
Figure 7. Dietary modulation of intestinal epithelial permeability and microbiota promote NAFLD progression
Proposed model highlights how diet mediated changes in the intestinal epithelial permeability and microbial dysbiosis result in the translocation of gut microbial products that drive hepatic inflammation and fibrosis in NASH. HFCD, high fat, high fructose and high cholesterol diet; PAMP, pathogen associated molecular patterns; NAFL, non-alcoholic fatty liver; HSC, hepatic stellate cells; NASH, non-alcoholic steatohepatitis.

Similar articles

Cited by

References

    1. Mahady SE, George J. Management of nonalcoholic steatohepatitis: an evidence-based approach. Clin Liver Dis. 2012;16:631–45. - PubMed
    1. Williams CD, Stengel J, Asike MI, et al. Prevalence of nonalcoholic fatty liver disease and nonalcoholic steatohepatitis among a largely middle-aged population utilizing ultrasound and liver biopsy: a prospective study. Gastroenterology. 2011;140:124–31. - PubMed
    1. Miele L, Valenza V, La Torre G, et al. Increased intestinal permeability and tight junction alterations in nonalcoholic fatty liver disease. Hepatology. 2009;49:1877–87. - PubMed
    1. Wigg AJ, Roberts-Thomson IC, Dymock RB, et al. The role of small intestinal bacterial overgrowth, intestinal permeability, endotoxaemia, and tumour necrosis factor alpha in the pathogenesis of non-alcoholic steatohepatitis. Gut. 2001;48:206–11. - PMC - PubMed
    1. Lorenzo-Zuniga V, Bartoli R, Planas R, et al. Oral bile acids reduce bacterial overgrowth, bacterial translocation, and endotoxemia in cirrhotic rats. Hepatology. 2003;37:551–7. - PubMed

Publication types

MeSH terms