

Genome-wide association mapping of quantitative traits in a breeding population of sugarcane
- PMID: 27342657
- PMCID: PMC4921039
- DOI: 10.1186/s12870-016-0829-x
Genome-wide association mapping of quantitative traits in a breeding population of sugarcane
Abstract
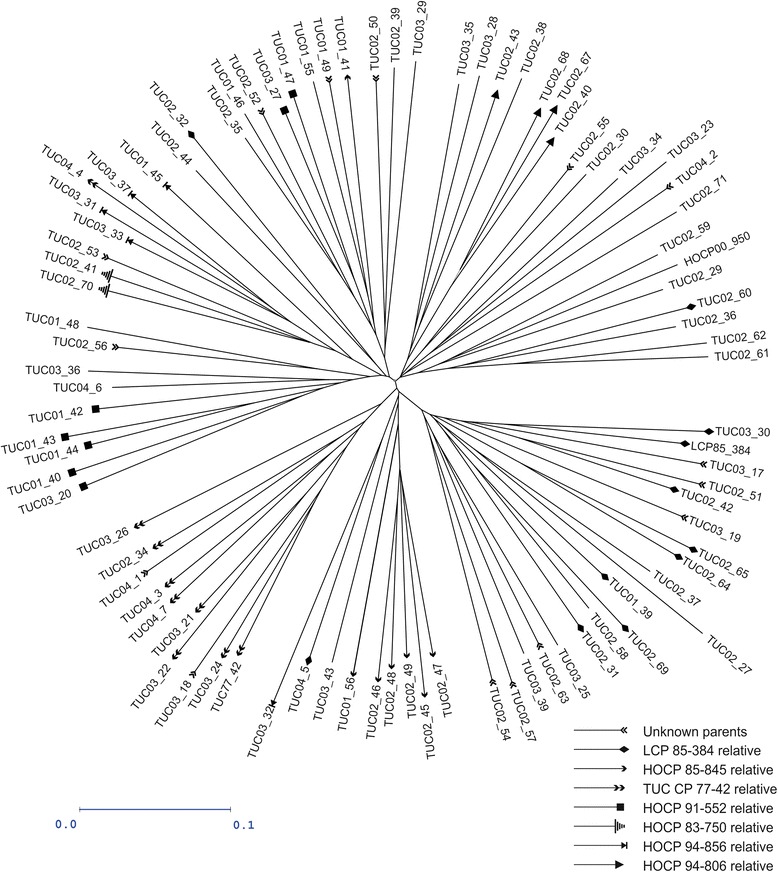
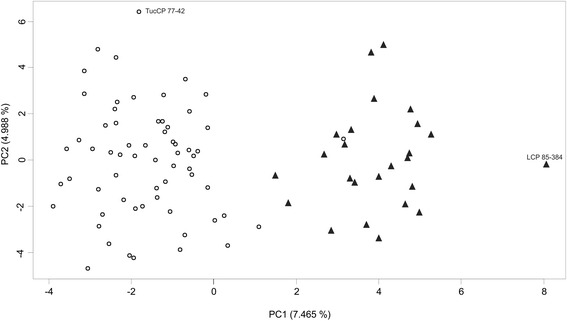
Background: Molecular markers associated with relevant agronomic traits could significantly reduce the time and cost involved in developing new sugarcane varieties. Previous sugarcane genome-wide association analyses (GWAS) have found few molecular markers associated with relevant traits at plant-cane stage. The aim of this study was to establish an appropriate GWAS to find molecular markers associated with yield related traits consistent across harvesting seasons in a breeding population. Sugarcane clones were genotyped with DArT (Diversity Array Technology) and TRAP (Target Region Amplified Polymorphism) markers, and evaluated for cane yield (CY) and sugar content (SC) at two locations during three successive crop cycles. GWAS mapping was applied within a novel mixed-model framework accounting for population structure with Principal Component Analysis scores as random component.
Results: A total of 43 markers significantly associated with CY in plant-cane, 42 in first ratoon, and 41 in second ratoon were detected. Out of these markers, 20 were associated with CY in 2 years. Additionally, 38 significant associations for SC were detected in plant-cane, 34 in first ratoon, and 47 in second ratoon. For SC, one marker-trait association was found significant for the 3 years of the study, while twelve markers presented association for 2 years. In the multi-QTL model several markers with large allelic substitution effect were found. Sequences of four DArT markers showed high similitude and e-value with coding sequences of Sorghum bicolor, confirming the high gene microlinearity between sorghum and sugarcane.
Conclusions: In contrast with other sugarcane GWAS studies reported earlier, the novel methodology to analyze multi-QTLs through successive crop cycles used in the present study allowed us to find several markers associated with relevant traits. Combining existing phenotypic trial data and genotypic DArT and TRAP marker characterizations within a GWAS approach including population structure as random covariates may prove to be highly successful. Moreover, sequences of DArT marker associated with the traits of interest were aligned in chromosomal regions where sorghum QTLs has previously been reported. This approach could be a valuable tool to assist the improvement of sugarcane and better supply sugarcane demand that has been projected for the upcoming decades.
Keywords: Biomass; Linkage disequilibrium; Population structure; Quantitative trait loci (QTL); Saccharum sp; Sugar.
Figures
References
-
- Heller-Uszynska K, Uszynski G, Huttner E, Evers M, Carlig J, Caig V, Aitken K, Jackson P, Piperidis G, Cox M, Gilmour R, D’Hont A, Butterfield M, Glaszmann JC, Kilian A. Diversity Arrays Technology effectively reveals DNA polymorphism in a large and complex genome of sugarcane. Mol Breed. 2011;28:37–55. doi: 10.1007/s11032-010-9460-y. - DOI
-
- Daniels J, Roach BT. Taxonomy and evolution. In: Heinz DJ, editor. Sugarcane improvement through breeding. Amsterdam: Elsevier Press; 1987. pp. 7–84.
-
- Silva JA, Bressiani JA. Sucrose synthase molecular marker associated with sugar content in elite sugarcane progeny. Genet Mol Biol. 2005;28:294–8. doi: 10.1590/S1415-47572005000200020. - DOI
Publication types
MeSH terms
LinkOut - more resources
Full Text Sources
Other Literature Sources
