. 2016 Jul 12;113(28):E4098-106.
doi: 10.1073/pnas.1600690113. Epub 2016 Jun 24.

ATP: The crucial component of secretory vesicles

Affiliations

ATP: The crucial component of secretory vesicles

Judith Estévez-Herrera et al. Proc Natl Acad Sci U S A. .

Abstract

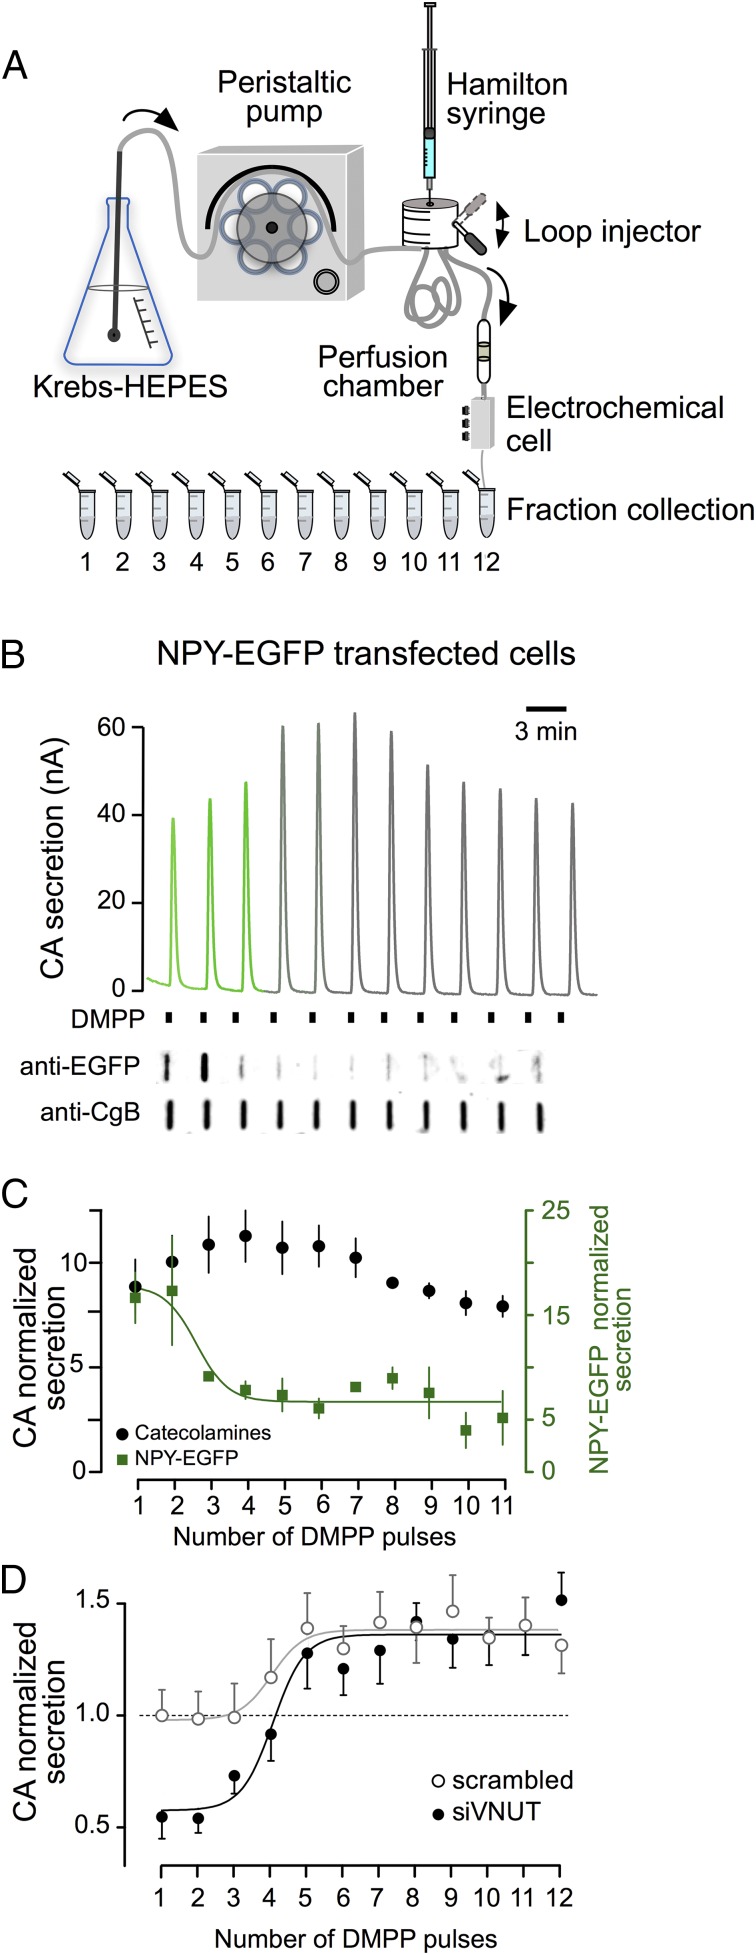
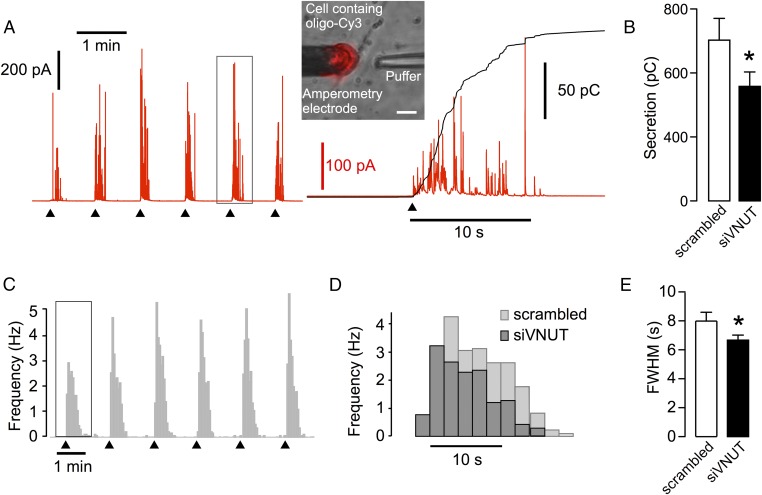
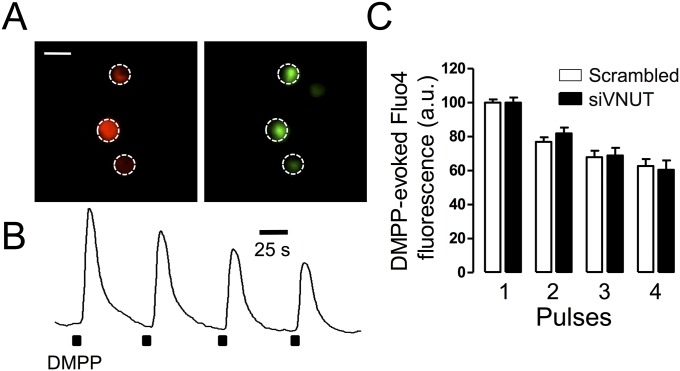
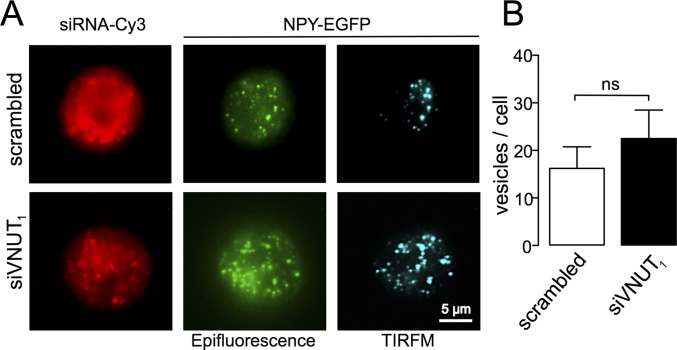
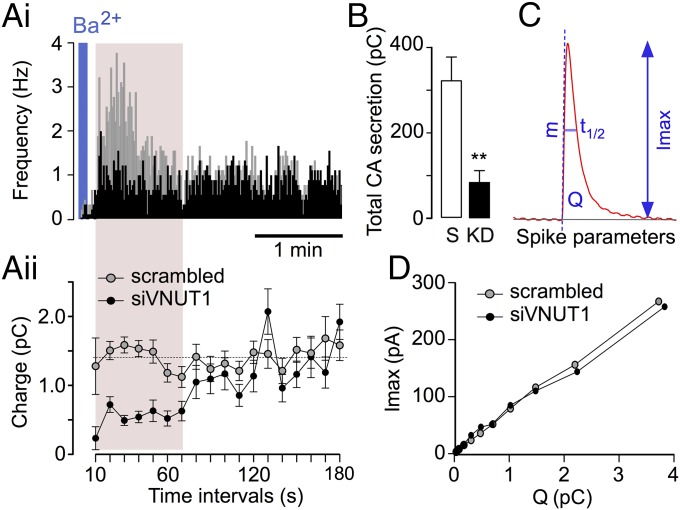
The colligative properties of ATP and catecholamines demonstrated in vitro are thought to be responsible for the extraordinary accumulation of solutes inside chromaffin cell secretory vesicles, although this has yet to be demonstrated in living cells. Because functional cells cannot be deprived of ATP, we have knocked down the expression of the vesicular nucleotide carrier, the VNUT, to show that a reduction in vesicular ATP is accompanied by a drastic fall in the quantal release of catecholamines. This phenomenon is particularly evident in newly synthesized vesicles, which we show are the first to be released. Surprisingly, we find that inhibiting VNUT expression also reduces the frequency of exocytosis, whereas the overexpression of VNUT drastically increases the quantal size of exocytotic events. To our knowledge, our data provide the first demonstration that ATP, in addition to serving as an energy source and purinergic transmitter, is an essential element in the concentration of catecholamines in secretory vesicles. In this way, cells can use ATP to accumulate neurotransmitters and other secreted substances at high concentrations, supporting quantal transmission.

Keywords: VNUT; exocytosis; purines; quantum size; secretory vesicles.


Conflict of interest statement

The authors declare no conflict of interest.

Figures

Fig. 1.
Fig. 1.
(A) Endogenous VNUT codistributes with secretory chromaffin vesicles. Typical confocal microscopy images showing the cellular distribution of endogenous VNUT and CgB. The merged image also shows the DAPI staining. The 3× zoomed images show the colocalization of VNUT and CgB in specific structures. Quantification was performed as described in Materials and Methods. (B) Normalized distribution of several components in chromaffin secretory vesicles. Twelve fractions of 450 µL (#1 lighter, #12 heavier) were obtained by density gradient sedimentation. (Upper) Quantification of noradrenaline (NA), adrenaline (A), and ATP. The bars show pooled data from three independent gradients, and a typical chromaffin SG proteins distribution, data from one representative experiment (Lower). The Inset shows the iodixanol density profile of each fraction taken from a parallel ultracentrifuge tube. CgA, chromogranin A; CgB, chromogranin B; SgII, secretogranin II.
Fig. S1.
Fig. S1.
VNUT-EGFP sorts into chromaffin granules. (A) Western blot of VNUT-EGFP overexpressed in chromaffin cells. NN, nonnucleofected. (B) Confocal images show the codistribution of VNUT-EGFP with NPY-DsRED, indicating the sorting of the VNUT into chromaffin granules. White circles (0.9-µm diameter) were drawn around the ROI in the green channel and then transferred to the red channel. Only ROIs that were located at the periphery of the cells were analyzed and the results indicate an ∼85% colocalization of the two proteins (300 granules from 6 cells).
Fig. 2.
Fig. 2.
Knockdown of the vesicular nucleotide transporter decreases ATP exocytosis. (A) VNUT mRNA assayed by qRT-PCR. The bars represent the mean expression ± SD (n = 3) and the values were compared using a one-way ANOVA followed by Bonferroni's multiple-comparison test: *P < 0.05. (B) Representative Western blots of VNUT expression carried out 24 h after siRNA transfection. The effects of nucleofection with the siVNUT1 and siVNUT2 oligonucleotides were compared with those of a nontargeted siRNA (scrambled). Equal amounts of protein (20 µg) were loaded per lane. (C) Quantitative analysis of the changes in VNUT expression at different times after transfection of siVNUT1, expressed as the VNUT/α-tubulin ratio in three different Western blots. Bonferroni's multiple-comparison test: *P < 0.05. (D) ATP release from chromaffin cells under resting conditions and after stimulation with the nicotinic agonist DMPP, in the presence or absence of the nucleotidase inhibitor ARL67156 or the exocytotic blocker NEM. (E) Decreased ATP release after VNUT knockdown. The experiments in D and E were performed at 37 °C and, unless specified, in the presence of 100 µM of ARL67156. **P < 0.01, Mann–Whitney U test.
Fig. 3.
Fig. 3.
Knockdown of VNUT preferentially impaired the vesicular exocytosis of adrenaline in chromaffin cells. (A) Typical HPLC chromatograms showing the detection of amines. (Left) External standard of noradrenaline (NA), adrenaline (A), and DHBA (internal standard). Cells were stimulated for 5 min with DMPP and the amines secreted into the media were analyzed. (Right) These traces show the catecholamines secreted from control cells (scrambled, dashed line) and VNUT-KD cells (solid line). (B) Average total catecholamine content in lysates from cells transfected with the scrambled (S) and siVNUT1 (KD) siRNAs. ns, not significant. (C and D) Basal and DMPP-evoked noradrenaline and adrenaline secretion from cells stimulated by DMPP, showing greater release of noradrenaline. The data are the means ± SEM of at least three independent cell cultures: *P < 0.05, **P < 0.01 (Dunnett’s paired t test). (E) Linear fit from the relation catecholamines/ATP obtained from purified SGs. The R2 values were 0.9 and 0.7 for ATP/adrenaline and ATP/noradrenaline, respectively. The slopes of the linear equations were 2.5 vs. 9.1, with values from an experiment from two independent gradients of isolated vesicles shown.
Fig. 4.
Fig. 4.
VNUT knockdown predominantly affects catecholamine secretion from newly synthesized vesicles. The capacity of cells to recruit vesicles from the early- and late-releasable pools was studied using 12 successive DMPP stimulations. (A) The scheme shows the perfusion system used for the on-line electrochemical analysis of catecholamine release and the fraction collection for protein quantification. (B) Representative traces of the electrochemical recording from perfused chromaffin cells expressing NPY-EGFP. Each current peak indicates catecholamine secretion. A representative dot blot probed for NPY-EGFP and CgB obtained from the same experiment. (C) Time course of catecholamine and newly synthesized NPY (pooled results from four experiments). (D) Time course of catecholamine release from control (scrambled) and knockdown-VNUT (siVNUT) nucleofected chromaffin cells. To correct the bias of different cell batches, the data were normalized to the mean of the first secretory peak from the control cells (scrambled), considering the initial response as 1.
Fig. 5.
Fig. 5.
The number of exocytotic events is reduced by VNUT interference. (A) Representative amperometric recording from a control cell. Secretion was stimulated every minute by a 10-s pressure ejection of 10 µM DMPP from a micropipette placed 30 µm from the cell (triangles). After each stimulus the micropipette was moved 500-µm up using a motor-driven micromanipulator to avoid receptor desensitization caused by DMPP leakage. An amplified view of the fifth pulse is shown revealing the typical firing pattern of exocytosis (red trace) and the cumulative secretion obtained by integrating the amperometric signals (superimposed black trace). (Inset) A cell labeled with the fluorophore (Cy3-oligonucleotide) indicates successful nucleofection. The image shows the position of the carbon fiber electrode and the glass pipette used for DMPP injection (puffer, on the right). (Scale bar: 10 µm.) (B) Total secretion responses from control (scrambled) and siVNUT cells. The data represent the mean ± SE secretion pooled from six secretory responses elicited by 10-µM DMPP pulses. (C) Spike-frequency analysis (1-s bins). The image shows the frequency of exocytosis. Each bar represents the average spike frequencies from control cells (n = 10). The maximum number of spikes was reached 5 s after stimulation. (D) The first histogram is amplified and the spike frequency (recorded in 2-s bins) from the control (scrambled) and VNUT silenced cells superimposed. Note that spikes from VNUT-KD cells stopped firing before the control cells. (E) Pooled data from 10 cells showing the full width at half maximum (FWHM) from the sigmoidal fits of frequency histograms. *P < 0.05, Mann–Whitney U test.
Fig. S2.
Fig. S2.
(A) siVNUT does not affect calcium dynamics. Cells nucleofected with siVNUT or scramble oligonucleotides tagged with Cy3 were loaded with the Fluo-4 calcium indicator. We only used red-tagged cells for the analysis. (Scale bar: 20 μm.) (B) The cells were stimulated with four successive DMPP pulses (see above) and the fluorescence was recorded continuously. Note the progressive reduction in intracellular calcium. (C) Pooled data represented as the mean ± SE from control (n = 14) and siVNUT1 (n = 11) nucleofected cells.
Fig. S3.
Fig. S3.
The NPY-EGFP expression remains unchanged in VNUT-KD cells. (A) Representative images of chromaffin cells obtained with conventional fluorescence showing siRNA oligonucleotides labeled with Cy3 and newly synthesized vesicles expressing NPY-EGFP (green). Newly formed vesicles closest to the membrane can be observed by total internal reflection fluorescence microscopy (TIRFM) (blue spots). (B) Pooled data from TIRFM images showing no differences in the number of vesicles expressing NPY-EGFP in control (scrambled) and siVNUT1-treated cells. The bars represent the means ± SD (n = 5). Values were compared using Mann–Whitney U test P = 0.458.
Fig. 6.
Fig. 6.
Quantum catecholamine size from VNUT-KD SGs. (A, i) Spike-frequency analysis of isolated cells nucleofected with the scrambled (gray traces) or siVNUT oligonucleotides (black traces) and stimulated for 5 s with 5 mM BaCl2. Each spike represents the catecholamine released from a single vesicle. Frequency bins are the average number of spikes in 1 s. (A, ii) Quantum size of the exocytotic events recorded in 10-s bins over 3-min intervals. Each open circle (scrambled) and solid circle (siVNUT1) represents the average charge (in picocoulombs, nine cells each). (B) Total secretion (mean ± SEM) comparing the control (scrambled, S) and siVNUT1 (KD). The cumulative charges were measured for 3 min after stimulation and they are expressed as picocoulombs. **P < 0.01, Student’s t test. (C) Parameters obtained from each secretory spike: Imax, maximum oxidation current; t1/2, spike width at the half-height; Q, net catecholamine charge; m, ascending slope of the spike. (D) Spike amplitude (Imax) versus quantum size (Q) of secretory spikes from siVNUT and control nucleofected cells: Mann–Whitney U test with the Bonferroni correction (the data are averaged from the experiment shown in Table 1).

Comment in

References

    1. Burnstock G. Historical review: ATP as a neurotransmitter. Trends Pharmacol Sci. 2006;27(3):166–176. - PubMed
    1. Borges R. The ATP or the natural history of neurotransmission. Purinergic Signal. 2013;9(1):5–6. - PMC - PubMed
    1. Johnson RG, Carlson NJ, Scarpa A. deltapH and catecholamine distribution in isolated chromaffin granules. J Biol Chem. 1978;253(5):1512–1521. - PubMed
    1. Morris SJ, Schultens HA, Schober R. An osmometer model for changes in the buoyant density of chromaffin granules. Biophys J. 1977;20(1):33–48. - PMC - PubMed
    1. Albillos A, et al. The exocytotic event in chromaffin cells revealed by patch amperometry. Nature. 1997;389(6650):509–512. - PubMed

Publication types