. 2016 Aug 1;311(2):L400-11.
doi: 10.1152/ajplung.00428.2015. Epub 2016 Jun 24.

MiR-196a regulates heme oxygenase-1 by silencing Bach1 in the neonatal mouse lung

Affiliations

MiR-196a regulates heme oxygenase-1 by silencing Bach1 in the neonatal mouse lung

Hayato Go et al. Am J Physiol Lung Cell Mol Physiol. .

Abstract

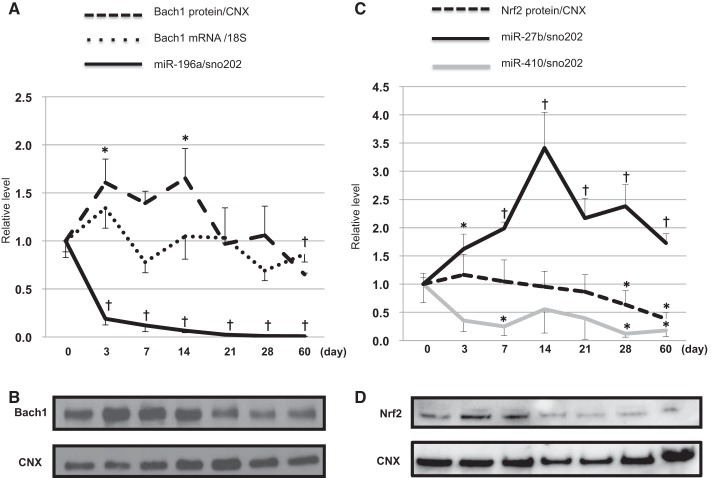
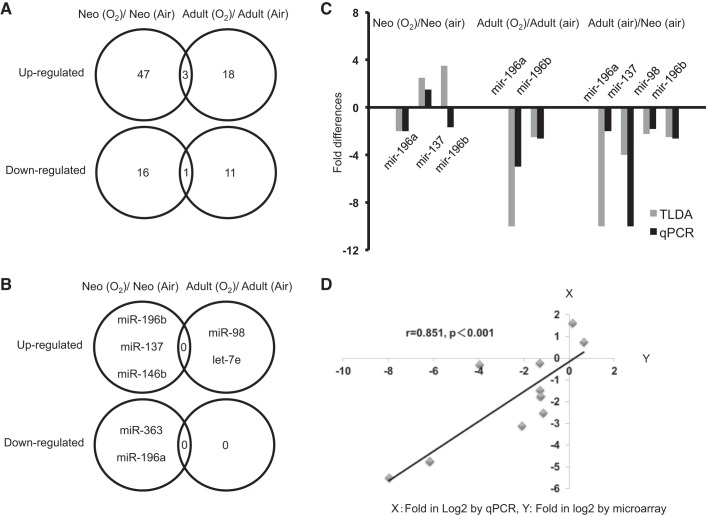
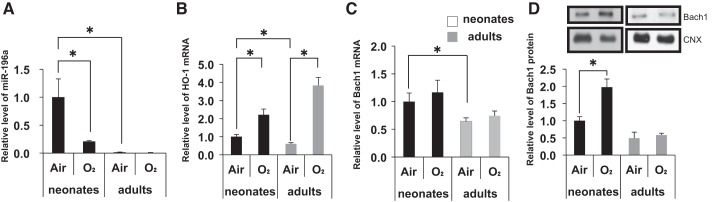
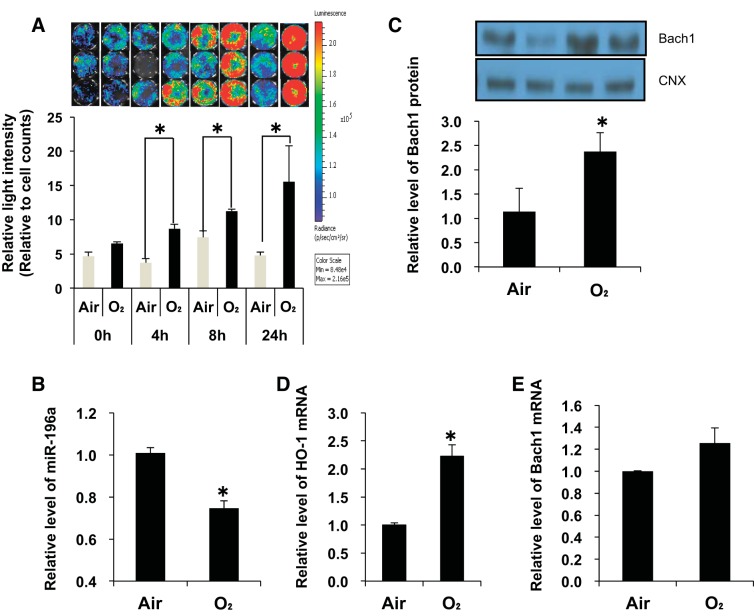
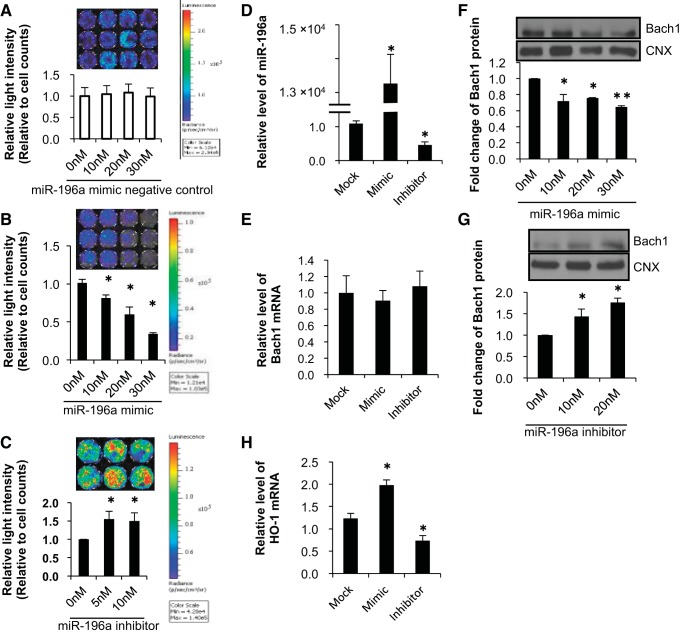
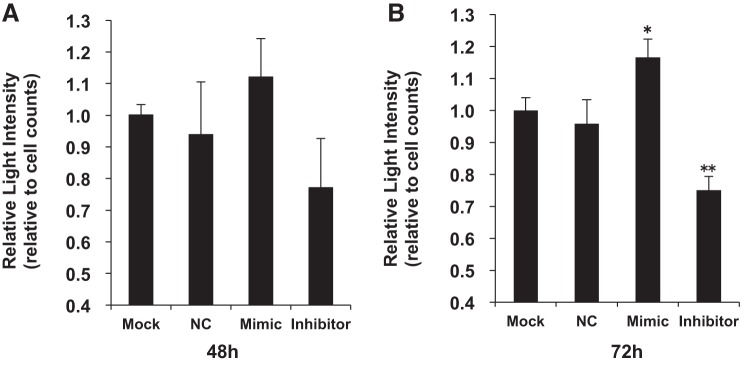
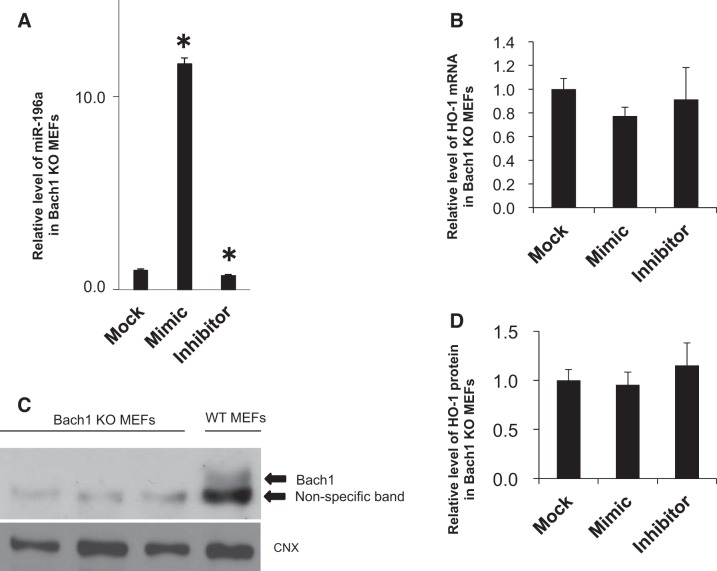
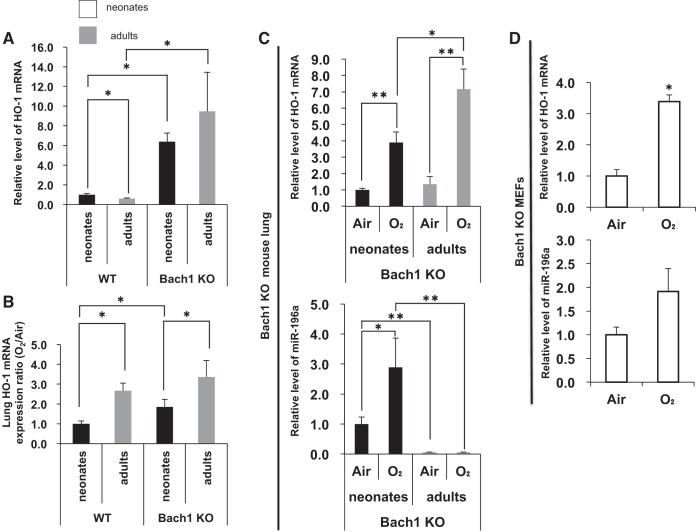
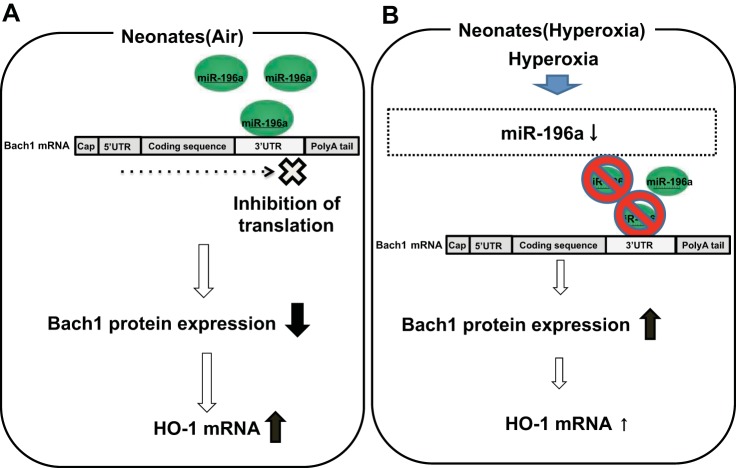
In the lung, heme oxygenase-1 (HO-1) is developmentally regulated, with its highest expression in the first days of life. In addition, neonatal mice have limited HO-1 induction in hyperoxia compared with adults. However, few reports have addressed the functional effect of microRNAs (miRNAs) in the regulation of HO-1 in vivo. The aims of the present study were to characterize changes in lung miRNA expression during postnatal development and in response to hyperoxic exposure, and to identify miRNAs that target lung HO-1 gene expression. Neonatal (<12 h old) and adult (2 mo old) mice were exposed to room air or hyperoxia (95% oxygen) for 72 h. TaqMan low-density array rodent miRNA assays were used to calculate miRNA expression changes between control and hyperoxia groups in neonatal and adult lungs. In neonates, we identified miR-196a, which binds to the 3'-untranslated region of the transcriptional repressor BTB and CNC homology 1 (Bach1) and regulates its expression, and subsequently leads to higher levels of lung HO-1 mRNA compared with levels in adults. Despite the increase at baseline, miR-196a was degraded in hyperoxia resulting in limited HO-1 induction in neonatal mice lungs. Furthermore, the developmental differences in lung HO-1 gene expression can be explained in part by the variation in miRNA-196a and its effect on Bach1. This report is the first to show developmental differences in lung miR-196a and its effect on Bach1 and HO-1 expression at baseline and in hyperoxia.

Keywords: Bach1; HO-1; hyperoxic lung injury; lung development; microRNA-196a.


Figures

Fig. 1.
Fig. 1.
Developmental expression of microRNA (miR)-196a, miR-27b, miR-410, mRNA of the transcriptional repressor BTB and CNC homology 1 (Bach1), and proteins of Bach1 and the activator nuclear factor-E2-related factor-2 (Nrf2) in the mouse lung. A: expression levels of miR-196a, Bach1 mRNA, and Bach1 protein during postnatal lung development were measured by real-time PCR (n = 6/time point) and Western blot (n = 5/time point). Levels of miR-196a are normalized to those of small nucleolar RNA 202 (sno202). Bach1 mRNA levels are normalized to those of 18S ribosomal RNA (18S). Values are presented as means ± SE. B: lungs from wild-type (WT) C57BL6 mice during lung development were harvested and homogenized with a cocktail of phosphatase and kinase inhibitors. The protein concentration was quantified using the bincinchoninic acid (BCA) method. Equal concentrations were then loaded onto a gel and blotted for Bach1 and calnexin as a loading control. The Western blots shown are the best representatives of five experiments using five different animals in each condition. C: expression levels of miR-27b, miR-410, and Nrf2 protein during postnatal lung development were measured by real-time PCR (n = 5/time point) and Western blot. Values of miR-27b and miR-410 levels are presented as means ± SE from five mice. Levels of miR-27b and miR-410 are normalized to those of sno202. D: lungs from WT C57BL6 mice during lung development were harvested and homogenized with a cocktail of phosphatase and kinase inhibitors. The protein concentration was quantified using the BCA method. Equal concentrations were then loaded onto a gel and blotted for Nrf2 and calnexin as a loading control (n = 5/time point). Data are shown as a relative level normalized to day 0 neonates. †P < 0.01; *P < 0.05 vs. day 0 for miR-196a, day 0 for Bach1 protein, day 0 for Nrf2 protein, and day 0 for miR-27b and miR-410.
Fig. 2.
Fig. 2.
Altered miRNAs in neonatal vs. adult mouse lung. A: Venn diagram of altered miRNAs in neonatal vs. adult lungs. Fifty miRNAs increased more than twofold, and 17 miRNAs decreased by more than half in neonates exposed to hyperoxia. In adults exposed to hyperoxia, 21 miRNAs increased more than twofold, and 12 miRNAs decreased by more than half. B: this Venn diagram of miRNA related to Bach1 shows no altered miRNAs common to either neonatal or adult lungs exposed to hyperoxia on the basis of array data. C: selected miRNAs from the miRNA expression profile were validated by RT-quantitative PCR (qPCR). D: correlation between data from microarray and RT-PCR for selected miRNAs was performed using lineal regression. The x-axis represents fold in log2 by qPCR; the y-axis represents fold in log2 by TaqMan low-density array data.
Fig. 3.
Fig. 3.
Differential regulation of lung miR-196a, Bach-1, and heme oxygenase-1 (HO-1) in neonate and adult mice exposed to hyperoxia. AC: miR-196a, HO-1 mRNA, and Bach1 mRNA levels, respectively, in neonatal and adult lungs exposed to hyperoxia. Values are presented as means ± SE of six separate determinations. D: Bach1 protein level in neonatal and adult lungs exposed to hyperoxia. Calnexin (CNX) is shown as a loading control. Densitometric evaluation of protein expression normalized to calnexin is provided. Values are presented as means ± SE of four separate determinations; *P < 0.05 vs. air.
Fig. 4.
Fig. 4.
Hyperoxia alters miR-196a and Bach-1 in mouse embryonic fibroblast cells (MEFs). A: luciferase activity after hyperoxia in MEFs. Twenty-four hours after transfection of the Bach1 3′-untranslated region (UTR) plasmid, MEFs were exposed to hyperoxia. Relative light intensity was measured 4, 8, and 24 h after hyperoxia. The color scale bar represents photon emission intensity. Values are presented as means ± SE of six separate determinations; *P < 0.05. B: miR-196a levels were measured by qPCR. Levels of miR-196a are normalized to those of sno202. C: Bach1 protein levels were measured by Western blot [calnexin (CNX) is shown as a loading control], and densitometric evaluation of protein expression normalized to loading control (CNX). D and E: HO-1 mRNA and Bach1 mRNA levels were measured by qPCR. Levels of miR-196a are normalized to those of sno202; HO-1 and Bach1 mRNA levels are normalized to those of 18S. Values are presented as means ± SE of four separate determinations; *P < 0.05.
Fig. 5.
Fig. 5.
MicroRNA-196a regulates Bach1 and HO-1 expression. AC: luciferase activity was determined by measuring photon emission after incubation with the substrate luciferin for 24 h after transfection of Bach1 3′-UTR plasmid and miR-196a control, mimics, and inhibitor. Values for cells with control transfection are set equal to 1. Data are presented as means ± SE of six to eight separate determinations. D and E: effect of miR-196a mimic (30 nM) or miR-196a inhibitor (10 nM) on miR-196a and Bach1 levels. MEFs were transfected with miRNA-196a mimics and inhibitor with Lipofectamine 2000 for 72 h. miR-196a levels and Bach1 mRNA levels were measured by qPCR and compared with mock transfection (mock transfection represents mice treated with Lipofectamine alone). Levels of miR-196a are normalized to those of sno202. Bach1 mRNA levels are normalized to those of 18S. Values are presented as means ± SE of three separate determinations; *P < 0.05 vs. mock transfection. F and G: Bach1 protein levels after transfection with miR-196a mimic and inhibitor were measured by Western blot. Calnexin is shown as a loading control. Densitometric evaluation of protein expression normalized to loading control (calnexin; CNX) is provided. Values are presented as means ± SE of three separate determinations; *P < 0.05 vs. 0 nM, **P < 0.001 vs. 0 nM. H: effect of miR-196a mimic (30 nM) or miR-196a inhibitor (10 nM) on HO-1 mRNA levels. MEFs were transfected with miRNA-196a mimics and inhibitor with Lipofectamine 2000 for 72 h. HO-1 mRNA levels were measured by qPCR and compared with mock transfection. HO-1 mRNA levels are normalized to those of 18S. Values are presented as means ± SE of three separate determinations; *P < 0.05 vs. mock transfection.
Fig. 6.
Fig. 6.
Relative light intensity in HO-1/Luc cells after transfection of miR-196a mimic and inhibitor. Relative light intensity in HO-1/Luc cells 48 (n = 3) (A) and 72 h (n = 5) (B) after transfection with negative control (NC), miR-196a mimic, and miR-196a inhibitor. Values were compared with those for mock transfection. This experiment was carried out in normoxia. Values are presented as means ± SE of three or five separate determinations; *P < 0.05 vs. mock transfection, **P < 0.001 vs. mock transfection.
Fig. 7.
Fig. 7.
miR-196a and HO-1 expression after transfection of miR-196a mimic and inhibitor in Bach1 KO MEFs. A: miR-196a levels after transfection of miR-196a mimic and inhibitor. Values are presented as means ± SE (n = 3); *P < 0.05 vs. mock transfection. B: HO-1 mRNA levels after transfection of miR-196a mimic and inhibitor. Levels of miR-196a are normalized to those of sno202, HO-1 mRNA levels are normalized to those of 18S. Values are presented as means ± SE (n = 3); *P < 0.05 vs. mock transfection. C and D: Western blots and analysis of Bach1 in Bach1 KO and WT MEFs and HO-1 protein after transfection of miR-196a mimic and inhibitor. HO-1 protein levels are normalized to those of calnexin. Values are presented as means ± SE (n = 3); *P < 0.05 vs. mock transfection.
Fig. 8.
Fig. 8.
Hyperoxia alters miR-196a and HO-1 mRNA levels in Bach1 KO MEFs and Bach1 KO mouse lung. A: HO-1 mRNA levels in WT and Bach1 KO mouse lung of neonate and adult mice exposed to air. B: HO-1 inducibility in WT and Bach1 KO mouse lung of neonates and adults exposed to hyperoxia. C: HO-1 mRNA and miR-196a levels in Bach1 KO mouse lung of neonates and adults exposed to hyperoxia. D: HO-1 and miR-196a levels in Bach1 KO MEFs exposed to hyperoxia. The levels of miR-196a are normalized to those of sno202, HO-1 mRNA levels are normalized to those of 18S. Values are presented as means ± SE of six (AC) or three (D) separate determinations; *P < 0.05 vs. air, **P < 0.01 vs. air.
Fig. 9.
Fig. 9.
Schematic representation of the regulation of miR-196a on HO-1 expression via Bach1 in neonatal lungs. A: at birth, miR-196a basal levels in neonatal mouse lung are higher than those of adults. Overexpression of miR-196a increases HO-1 expression via suppressing Bach1. B: in hyperoxia, miR-196a is decreased and Bach1 protein expression is increased, which lessens HO-1 inducibility.

Similar articles

Cited by

References

    1. Abate A, Yang G, Wong RJ, Schroder H, Stevenson DK, Dennery PA. Apigenin decreases hemin-mediated heme oxygenase-1 induction. Free Radic Biol Med 15, 711–718, 2005. - PubMed
    1. Alevizos I, Alexander S, Turner RJ, Illei GG. MicroRNA expression profiles as biomarkers of minor salivary gland inflammation and dysfunction in Sjögren's syndrome. Arthritis Rheum 63: 535–544, 2011. - PMC - PubMed
    1. Baraldi E, Filippone M. Chronic lung disease after premature birth. N Engl J Med 357: 1946–1955, 2007. - PubMed
    1. Bartel DP. MicroRNAs: genomics, biogenesis, mechanism, function. Cell 116: 281–297, 2004. - PubMed
    1. Bassler D, Stoll BJ, Schmidt B, Asztalos EV, Roberts RS, Robertson CM, Sauve RS. Using a count of neonatal morbidities to predict poor outcome in extremely low birth weight infants: added role of neonatal infection. Pediatrics 123: 313–318, 2009. - PMC - PubMed

Publication types

MeSH terms