

Novel phenotypes of prediabetes?
- PMID: 27344314
- PMCID: PMC4969355
- DOI: 10.1007/s00125-016-4015-3
Novel phenotypes of prediabetes?
Abstract
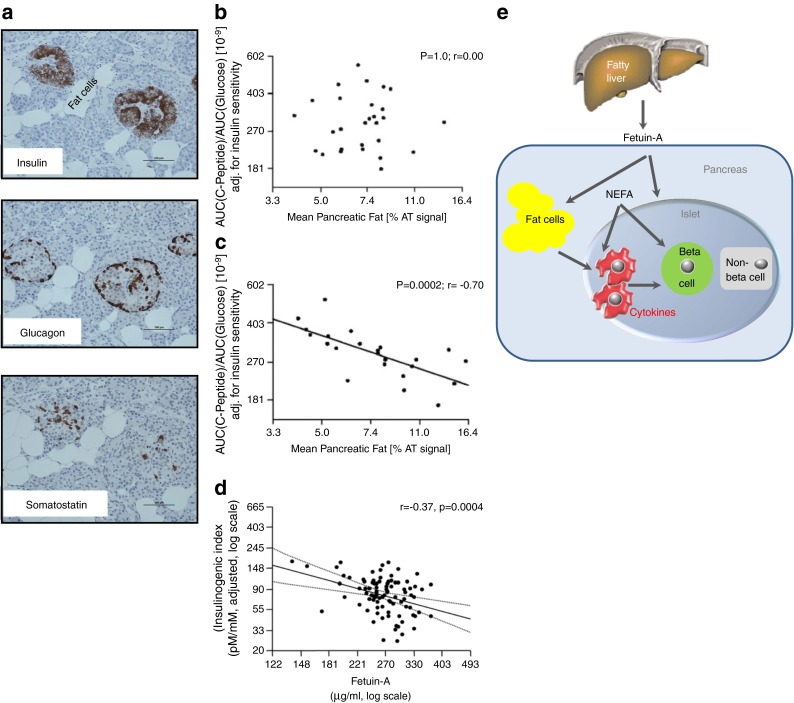
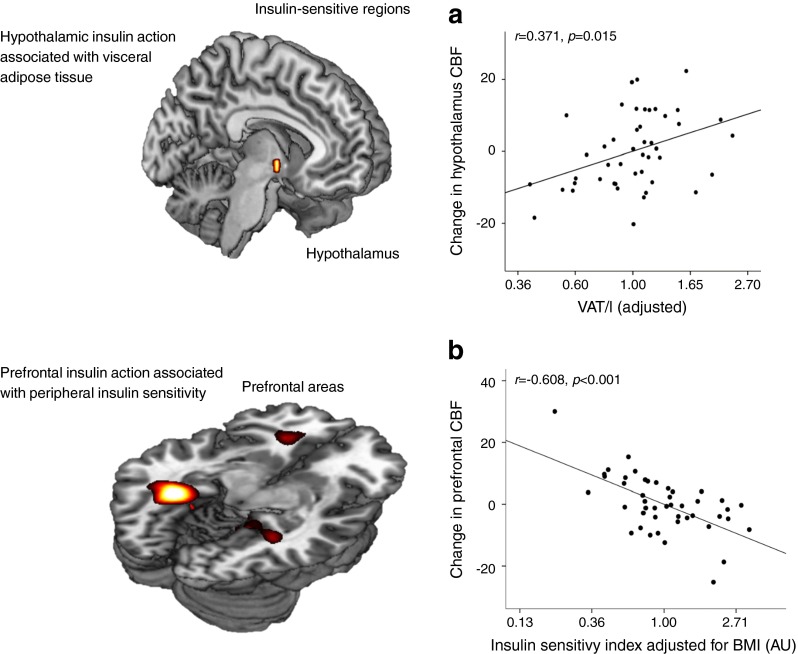
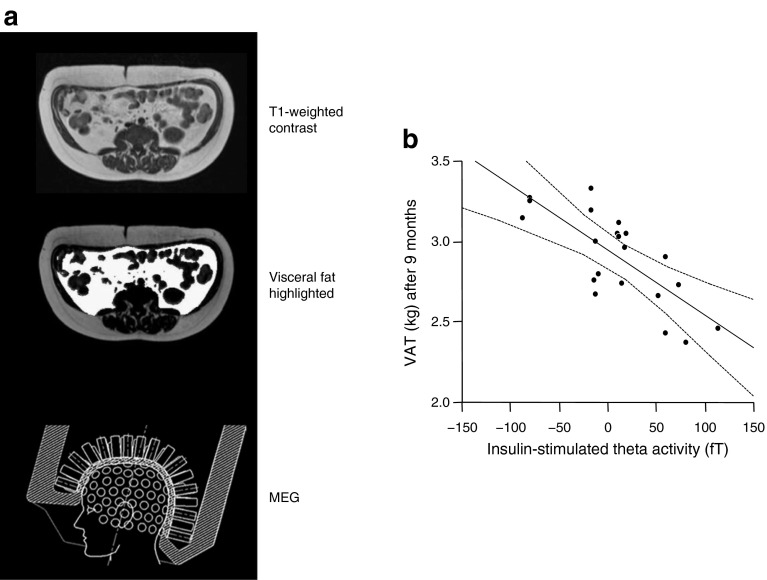
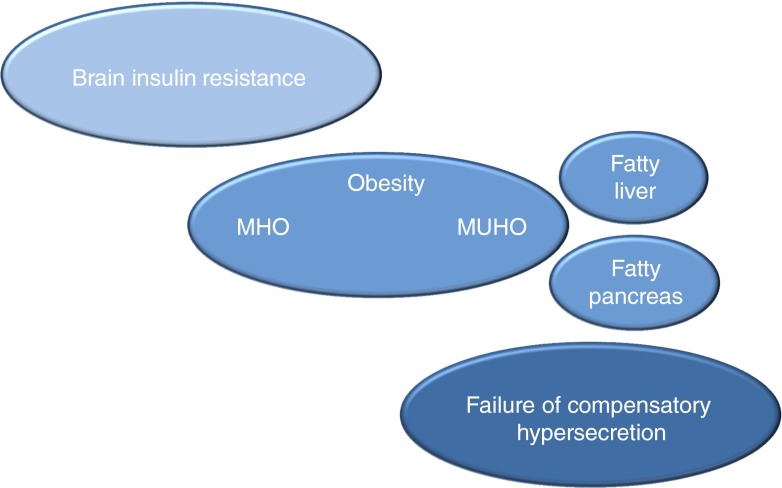
This article describes phenotypes observed in a prediabetic population (i.e. a population with increased risk for type 2 diabetes) from data collected at the University hospital of Tübingen. We discuss the impact of genetic variation on insulin secretion, in particular the effect on compensatory hypersecretion, and the incretin-resistant phenotype of carriers of the gene variant TCF7L2 is described. Imaging studies used to characterise subphenotypes of fat distribution, metabolically healthy obesity and metabolically unhealthy obesity are described. Also discussed are ectopic fat stores in liver and pancreas that determine the phenotype of metabolically healthy and unhealthy fatty liver and the recently recognised phenotype of fatty pancreas. The metabolic impact of perivascular adipose tissue and pancreatic fat is discussed. The role of hepatokines, particularly that of fetuin-A, in the crosstalk between these organs is described. Finally, the role of brain insulin resistance in the development of the different prediabetes phenotypes is discussed.
Keywords: Brain insulin resistance; Insulin; Liver fat; Phenotype; Prediabetes; Review; Secretion; Sensitivity.
Figures
Similar articles
-
Phenotypes of prediabetes and stratification of cardiometabolic risk.Lancet Diabetes Endocrinol. 2016 Sep;4(9):789-798. doi: 10.1016/S2213-8587(16)00082-6. Epub 2016 May 13. Lancet Diabetes Endocrinol. 2016. PMID: 27185609 Review.
-
Ectopic fat deposition in prediabetic overweight and obese minority adolescents.J Clin Endocrinol Metab. 2013 Mar;98(3):1115-21. doi: 10.1210/jc.2012-3806. Epub 2013 Feb 5. J Clin Endocrinol Metab. 2013. PMID: 23386647 Free PMC article.
-
The Relationship Between Brown Adipose Tissue Content in Supraclavicular Fat Depots and Insulin Sensitivity in Patients with Type 2 Diabetes Mellitus and Prediabetes.Diabetes Technol Ther. 2017 Feb;19(2):96-102. doi: 10.1089/dia.2016.0360. Diabetes Technol Ther. 2017. PMID: 28118051 Free PMC article.
-
Metabolomic Characteristics of Fatty Pancreas.Exp Clin Endocrinol Diabetes. 2020 Dec;128(12):804-810. doi: 10.1055/a-0896-8671. Epub 2019 May 16. Exp Clin Endocrinol Diabetes. 2020. PMID: 31096268
-
Metabolic implications of pancreatic fat accumulation.Nat Rev Endocrinol. 2022 Jan;18(1):43-54. doi: 10.1038/s41574-021-00573-3. Epub 2021 Oct 20. Nat Rev Endocrinol. 2022. PMID: 34671102 Review.
Cited by
-
Elevated Cholinesterase Activity and the Metabolic Syndrome-Dissecting Fatty Liver, Insulin Resistance and Dysglycaemia.Liver Int. 2025 May;45(5):e70046. doi: 10.1111/liv.70046. Liver Int. 2025. PMID: 40243328 Free PMC article.
-
Fatty Pancreas-Centered Metabolic Basis of Pancreatic Adenocarcinoma: From Obesity, Diabetes and Pancreatitis to Oncogenesis.Biomedicines. 2022 Mar 17;10(3):692. doi: 10.3390/biomedicines10030692. Biomedicines. 2022. PMID: 35327494 Free PMC article. Review.
-
Defying the Odds: Conquering Prediabetes for a Diabetes-Free Tomorrow.Indian J Endocrinol Metab. 2023 Jul-Aug;27(4):273-276. doi: 10.4103/2230-8210.388224. Epub 2023 Aug 29. Indian J Endocrinol Metab. 2023. PMID: 37867977 Free PMC article. No abstract available.
-
Increased hepatic fatty acid polyunsaturation precedes ectopic lipid deposition in the liver in adaptation to high-fat diets in mice.MAGMA. 2018 Apr;31(2):341-354. doi: 10.1007/s10334-017-0654-8. Epub 2017 Oct 12. MAGMA. 2018. PMID: 29027041
-
Duodenal adipose tissue is associated with obesity in baboons (Papio sp): a novel site of ectopic fat deposition in non-human primates.Acta Diabetol. 2019 Feb;56(2):227-236. doi: 10.1007/s00592-019-01286-w. Epub 2019 Jan 23. Acta Diabetol. 2019. PMID: 30673859 Free PMC article.
References
Publication types
MeSH terms
Substances
LinkOut - more resources
Full Text Sources
Other Literature Sources
Medical
