. 2016 Jun 27:6:28637.
doi: 10.1038/srep28637.

DDX3 Represses Stemness by Epigenetically Modulating Tumor-suppressive miRNAs in Hepatocellular Carcinoma

Affiliations

DDX3 Represses Stemness by Epigenetically Modulating Tumor-suppressive miRNAs in Hepatocellular Carcinoma

Hao-Kang Li et al. Sci Rep. .

Abstract

Studies indicate that the presence of cancer stem cells (CSCs) is responsible for poor prognosis of hepatocellular carcinoma (HCC) patients. In this study, the functional role of DDX3 in regulation of hepatic CSCs was investigated. Our results demonstrated that reduced DDX3 expression was not only inversely associated with tumor grade, but also predicted poor prognosis of HCC patients. Knockdown of DDX3 in HCC cell line HepG2 induced stemness gene signature followed by occurrence of self-renewal, chemoreisistance, EMT, migration as well as CSC expansion, and most importantly, DDX3 knockdown promotes tumorigenesis. Moreover, we found positive correlations between DDX3 level and expressions of tumor-suppressive miR-200b, miR-200c, miR-122 and miR-145, but not miR-10b and miR-519a, implying their involvement in DDX3 knockdown-induced CSC phenotypes. In addition, DDX3 reduction promoted up-regulation of DNA methyltransferase 3A (DNMT3A), while neither DNMT3B nor DNMT1 expression was affected. Enriched DNMT3A binding along with hypermethylation on promoters of these tumor-suppressive miRNAs reflected their transcriptional repressions in DDX3-knockdown cells. Furthermore, individual restoration of these tumor-suppressive miRNAs represses DDX3 knockdown-induced CSC phenotypes. In conclusion, our study suggested that DDX3 prevents generation of CSCs through epigenetically regulating a subset of tumor-suppressive miRNAs expressions, which strengthens tumor suppressor role of DDX3 in HCC.


Figures
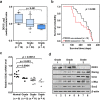
Figure 1
Figure 1. Decreased expression of DDX3 is associated with poor differentiation of tissue in HCC patients.
(a) High HCC grade showed significant reduction of DDX3. Expression level of DDX3 in HCC tissues of total 44 samples extracted from the Ye dataset in the cancer clinical microarray database Oncomine were grouped according to histological grade (Grade 2, 3 and 4), and number of samples in each grade is shown. DDX3 expression is presented as Log2 median-centered ratio. The statistical result of DDX3 level with different HCC grade was analyzed by outlier analysis. (b) Poor survival probability was observed in HCC patients with reduced DDX3 expression. The patients in the Ye dataset were grouped by non-reduced and reduced expression of DDX3, and their survival probability was assessed by Kaplan-Meier estimator. p < 0.05 represents statistical significance. (c) DDX3 expression decreases with the progression of HCC. DDX3 mRNA level in normal as well as HCC tissues of Grade 1, 2 and 3 acquired from OriGene TissueScan Liver Cancer cDNA Array was evaluated by qRT-PCR. Level of DDX3 mRNA in HCC samples was transformed into fold change relative to that of normal samples. Statistical analyses were carried out by t test. p < 0.05 represents statistical significance. (d) High HCC grade was associated with down-regulation of DDX3 and up-regulation of pluripotency factors. Lysates (100 μg each) of representative HCC tissues acquired from TLCN were analyzed by immunoblotting using anti-DDX3, Nanog, Oct4, c-Myc, Sox2 and β-actin antibodies.
Figure 2
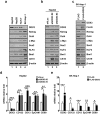
Figure 2. DDX3 suppresses stemness gene signature.
(a) Lower expression of DDX3 along with overexpression of stemness markers was observed in the poorly differentiated cell line. Cell lysates (50 μg) of HepG2, Hep3B, HuH-7 and SK-Hep-1 cells were analyzed by western blotting with antibodies against DDX3, Nanog, Oct4, c-Myc, Sox2, KLF4, Bmi1, CK19 and β-actin. (b) Knockdown of DDX3 led to up-regulation of stemness markers. Cell lysates (50 μg) of stable shLuc, shDDX3 #2 and shDDX3 #3 HepG2 cells were analyzed by western blotting with antibodies described in (a). (c) DDX3 overexpression suppressed stemness markers. Plasmid pcDNA3-SRα/FLAG or pcDNA3-SRα/FLAG-DDX3 was transfected into SK-Hep-1 cells. At 48 h post transfection, cell lysates were prepared and subjected to immunoblotting with antibodies described in (a) and anti-FLAG antibody. β-actin was used as internal control in (ac). (d) DDX3 knockdown was correlated with up-regulation of hepatic CSC surface markers. mRNA expressions of DDX3, CD133, CD13, EpCAM, CD90 and GAPDH in shLuc, shDDX3 #2 and shDDX3 #3 cells were detected by qRT-PCR. GAPDH was used as internal control. Fold change of each mRNA transcript in shDDX3 #2 and shDDX3 #3 cells was relative to that of shLuc cells. (e) DDX3 overexpression resulted in suppression of hepatic CSC surface markers. SK-Hep-1 cells were transfected with plasmid pcDNA3-SRα/FLAG or pcDNA3-SRα/FLAG-DDX3 as described in (c). At 48 h post transfection, total RNA was extracted and subjected to qRT-PCR analysis. GAPDH was used as internal control. Fold change of each mRNA transcript in FLAG-DDX3-expressing cells was relative to that of vector control cells. All experiments were performed at least three times, and the error bar indicates ± 1 s.d. of the mean. Statistical analyses were carried out using t test (*p < 0.05; **p < 0.01; ***p < 0.001).
Figure 3
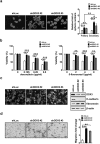
Figure 3. Down-regulation of DDX3 enhances cell capabilities of self-renewal, chemoresistance, EMT and migration.
(a) DDX3 knockdown promoted self-renewal capability. Sphere formation assays of shLuc, shDDX3 #2 and shDDX3 #3 cells were performed and images of formed sphere were captured as described in the Materials and methods. Scale bar represents 100 μm. The primary spheres of these cells were further dissociated into single cells by trypsinization and subjected to another round of sphere formation assay. The numbers of primary and secondary spheres in shDDX3 #2 and shDDX3 #3 cells were transformed into fold change relative to that of shLuc cells. (b) Cells with decreasing DDX3 expression were more viable upon conventional anti-cancer drugs treatment. shLuc, shDDX3 #2 and shDDX3 #3 cells were treated with different concentrations of doxorubicin (0, 0.125, 0.25 and 0.5 μg/ml; left panel) or 5-fluorouracil (0, 2, 4 and 8 μg/ml; right panel), and cell viability was determined by MTT assay. Formazan absorbance at 550 nm of untreated cells was arbitrarily set as 100% viable. Viability of shLuc, shDDX3 #2 and shDDX3 #3 cells at each drug concentration was relative to that of corresponding untreated cells. (c) DDX3 knockdown promoted EMT. Microscopy of shLuc, shDDX3 #2 and shDDX3 #3 cells are shown. Scale bar is equal to 100 μm. Cell lysates (50 μg) of shLuc, shDDX3 #2 and shDDX3 #3 cells were analyzed by western blotting with antibodies against DDX3, E-cadherin, fibronectin and β-actin. (d) Down-regulation of DDX3 promoted cell mobility. Migration assays of shLuc, shDDX3 #2 and shDDX3 #3 cells were carried out and images of Giemsa-stained migrated cells were captured. Scale bar represents 100 μm. The number of migrated cells in shDDX3 #2 and shDDX3 #3 cells were relative to that in shLuc cells. All experiments were repeated at least three times, and the error bar indicated ± 1 s.d. of the mean. Statistical analyses were carried out using t test (*p < 0.05; **p < 0.01; ***p < 0.001).
Figure 4
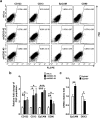
Figure 4. Knockdown of DDX3 enhances generation of hepatic CSC surface marker-positive populations.
(a) DDX3 knockdown increased CD133+, CD13+, EpCAM+ and CD90+ CSC populations. PE-conjugated anti-CD133, anti-CD13, anti-EpCAM, anti-CD90 or isotype control antibodies were used to stain shLuc, shDDX3 #2 and shDDX3 #3 cells. Percentage of hepatic CSC surface marker-positive cells was determined by flow cytometry. (b) The percentage of CSC populations in shDDX3 #2 and shDDX3 #3 cells shown in (a) was transformed into fold change relative to that in shLuc cells. (c) DDX3 expression was reduced in EpCAM+ cells. Expressions of EpCAM, DDX3 and GAPDH mRNAs in EpCAM+ and EpCAM cells were analyzed by qRT-PCR. GAPDH was used as internal control. The amount of EpCAM or DDX3 transcript in EpCAM+ cells was transformed into fold change relative to that of EpCAM cells. All results were derived from at least three independent experiments, and the error bar indicated ± 1 s.d. of the mean. Statistical analyses were carried out using t test (*p < 0.05; **p < 0.01; ***p < 0.001).
Figure 5
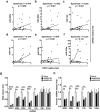
Figure 5. DDX3 level correlates with expression of several tumor-suppressive miRNAs.
Expressions of miRNAs and U6 snRNA as well as mRNA transcripts of DDX3 and GAPDH in 39 paired tumor and non-tumor tissues of HCC patients from TLCN were analyzed by qRT-PCR. U6 snRNA and GAPDH transcripts were used as internal control for miRNA and DDX3 expression, respectively. Fold change of each transcript in tumor tissues was relative to that of corresponding non-tumor tissues. Correlation of (a) miR-200b, (b) miR-200c, (c) miR-122, (d) miR-145, (e) miR-10b and (f) miR-519a expression with DDX3 level was performed by Spearman correlation criteria. p < 0.05 represents statistical significance. (g) Knockdown of DDX3 reduced expressions of tumor-suppressive miRNAs. Total RNA extracted from shLuc, shDDX3 #2 and shDDX3 #3 cells was subjected to qRT-PCR for detection of miR-200b, miR-200c, miR-122, miR-145, miR-10b, miR-519a and U6 snRNA as well as DDX3 and GAPDH transcripts. U6 snRNA and GAPDH transcripts were served as internal control for miRNA and DDX3 expression, respectively. Fold change of each transcript in shDDX3 #2 and shDDX3 #3 cells was relative to that of shLuc cells. Experiments were performed at least three times, and the error bar indicates ± 1 s.d. of the mean. Statistical analyses were carried out using t test (*p < 0.05; **p < 0.01; ***p < 0.001). (h) DDX3 knockdown repressed primary transcript expressions of tumor-suppressive miRNAs. Primary transcript expressions of miR-200b, miR-200c, miR-122, miR-145, miR-10b, miR-519a and GAPDH in shLuc, shDDX3 #2 and shDDX3 #3 cells were analyzed by qRT-PCR. GAPDH was used as internal control. Fold change of each transcript in shDDX3 #2 and shDDX3 #3 cells was relative to that of shLuc cells. Results were derived from at least three independent experiments, and the error bar indicated ± 1 s.d. of the mean. Statistical analyses were carried out using t test (*p < 0.05; **p < 0.01; ***p < 0.001).
Figure 6
Figure 6. Knockdown of DDX3 enriches DNMT3A binding on promoters of tumor-suppressive miRNAs.
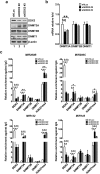
(a) DDX3 knockdown promoted overexpression of DNMT3A. Cell lysates (50 μg) of shLuc, shDDX3 #2 and shDDX3 #3 cells were analyzed by western blotting with antibodies against DDX3, DNMT3A, DNMT3B, DNMT1 and β-actin. β-actin was used as internal control. (b) Suppression of DDX3 is associated with down-regulation of DNMT3A mRNA expression. DNMT3A, DNMT3B, DNMT1 and GAPDH mRNA expressions in shLuc, shDDX3 #2 and shDDX3 #3 cells were analyzed by qRT-PCR. GAPDH was used as internal control. The amount of each transcript in shDDX3 #2 and shDDX3 #3 cells was transformed into fold change relative to that of shLuc cells. (c) Knockdown of DDX3 led to reduction of DDX3 binding, enhancement of DNMT3A recruitment and elevation of gene-silencing histone mark H3K27me3 on promoter regions of MIR200B, MIR200C, MIR122 and MIR145. shLuc, shDDX3 #2 and shDDX3 #3 cells were subjected to ChIP assay. Binding of DDX3, DNMT3A, DNMT3B, DNMT1 and status of H3K27me3 were expressed as the relative fold change to rabbit IgG binding on the corresponding genomic region, which were normalized with input in individual cell line. All experiments were repeated at least three times, and the error bar indicated ± 1 s.d. of the mean. Statistical analyses were carried out using t test (*p < 0.05; **p < 0.01; ***p < 0.001).
Figure 7
Figure 7. Knockdown of DDX3 results in promoter hypermethylation of tumor-suppressive miRNAs.
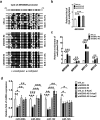
(a) DDX3 knockdown promotes CpG methylation on promoter region of MIR200B. DNA fragments for bisulfite sequencing were prepared from shLuc, shDDX3 #2 and shDDX3 #3 cells and analyzed as described in Materials and methods. (b) The percentage of MIR200B promoter CpG methylation in shDDX3 #2 and shDDX3 #3 cells shown in (a) was transformed into fold change relative to that in shLuc cells. (c) Cytosine methylation on promoter regions of MIR200B, MIR200C, MIR122 and MIR145 was enhanced in DDX3-knockdown cells. Genomic DNA extracted from shDDX3 #2 and shDDX3 #3 HepG2 cells was subjected to methylated DNA enrichment assay. The methylation status was expressed as the relative fold change to protein A-magnetic beads binding on the corresponding genomic region, which were normalized with input in individual cell line. (d) Treatment with DNMT inhibitor 5-azacytidine (5-AzaC) restored expressions of tumor-suppressive miRNAs in DDX3-knockdown cells. shLuc, shDDX3 #2 and shDDX3 #3 cells were treated with 2 μM 5-azacytidine for 48 h. Expressions of miR-200b, miR-200c, miR-122 and miR-145 and U6 snRNA were analyzed by qRT-PCR. U6 snRNA was used as internal control. Fold change of each transcript in untreated and treated shDDX3 #2 and shDDX3 #3 cells as well as that in treated shLuc cells were relative to that of untreated shLuc cells. All experiments were repeated at least three times, and the error bar indicated ± 1 s.d. of the mean. Statistical analyses were carried out using t test (*p < 0.05; **p < 0.01; ***p < 0.001).
Figure 8
Figure 8. Introduction of tumor-suppressive miRNAs reduces DDX3 knockdown-promoted sphere formation.
(a) Sphere-forming capability of DDX3-knockdown cells was repressed by tumor-suppressive miRNAs. shLuc, shDDX3 #2 and shDDX3 #3 cells were transfected with negative control (NC) miRNA and specific miRNA mimics of miR-200b, miR-200c, miR-122, miR-145, miR-10b and miR-519a. At 48 h post transfection, cells were subjected to sphere formation assay. Scale bar is equal to 100 μm. (b) The number of formed spheres in miRNA-transfected cells described in (a) was transformed into fold change relative to that of NC-transfected shLuc cells. Experiments were performed at least three times, and the error bar indicates ± 1 s.d. of the mean. Statistical analyses were carried out using t test (*p < 0.05; **p < 0.01).
Figure 9
Figure 9. A proposed model illustrates that DDX3 represses stemness by epigenetically modulating tumor-suppressive miRNAs in HCC.
(a) In physiological condition, DDX3 may interact with transcription factors on promoter regions of a subset of tumor-suppressive miRNA genes, such as MIR200B, MIR200C, MIR122 and MIR145, and participate in these miRNA expressions, thereby suppressing CSC phenotypes as well as tumorigenesis in liver. (b) Loss of DDX3 may increase the accessibility of DNMT3A to promoter regions of MIR200B, MIR200C, MIR122 and MIR145. Enhanced DNMT3A binding on promoter not only stabilizes itself, but also results in hypermethylation of DNA and dissociation of transcription factors. Therefore, expressions of these tumor-suppressive miRNAs are silenced, which induces CSC phenotypes in liver cells.

Similar articles

Cited by

References

    1. Meacham C. E. & Morrison S. J. Tumour heterogeneity and cancer cell plasticity. Nature 501, 328–337 (2013). - PMC - PubMed
    1. Visvader J. E. & Lindeman G. J. Cancer stem cells in solid tumours: accumulating evidence and unresolved questions. Nat. Rev. Cancer 8, 755–768 (2008). - PubMed
    1. Pattabiraman D. R. & Weinberg R. A. Tackling the cancer stem cells - what challenges do they pose? Nat. Rev. Drug Discov. 13, 497–512 (2014). - PMC - PubMed
    1. Kasinski A. L. & Slack F. J. Epigenetics and genetics. MicroRNAs en route to the clinic: progress in validating and targeting microRNAs for cancer therapy. Nat. Rev. Cancer 11, 849–864 (2011). - PMC - PubMed
    1. Lin S. & Gregory R. I. MicroRNA biogenesis pathways in cancer. Nat. Rev. Cancer 15, 321–333 (2015). - PMC - PubMed

Publication types

MeSH terms

LinkOut - more resources