. 2016 Jun 27:6:28445.
doi: 10.1038/srep28445.

A previously unrecognized role of C3a in proteinuric progressive nephropathy

Affiliations

A previously unrecognized role of C3a in proteinuric progressive nephropathy

Marina Morigi et al. Sci Rep. .

Abstract

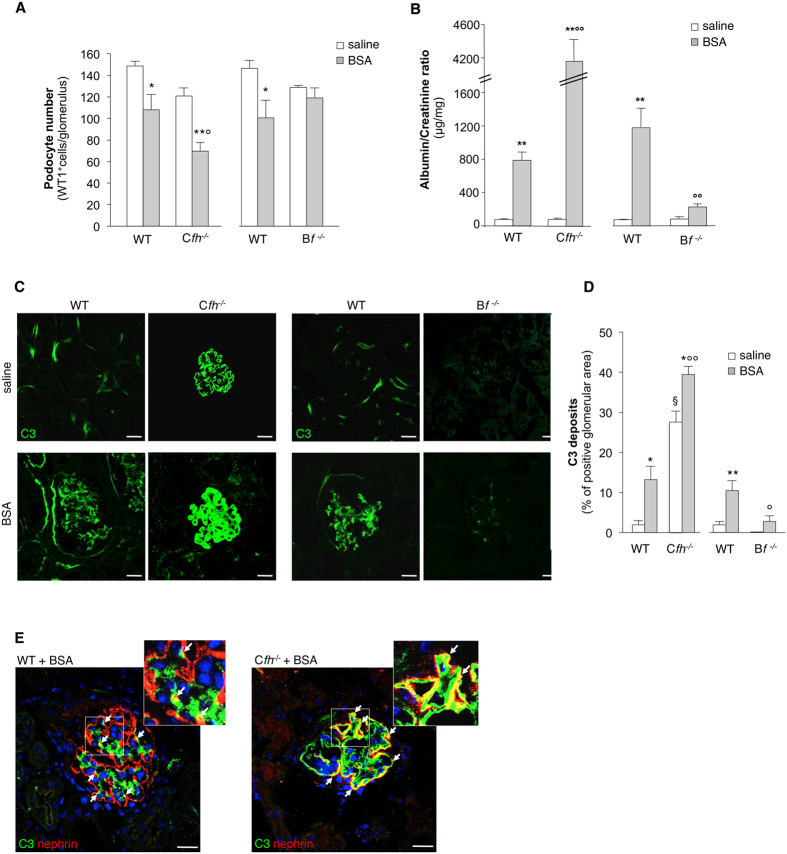
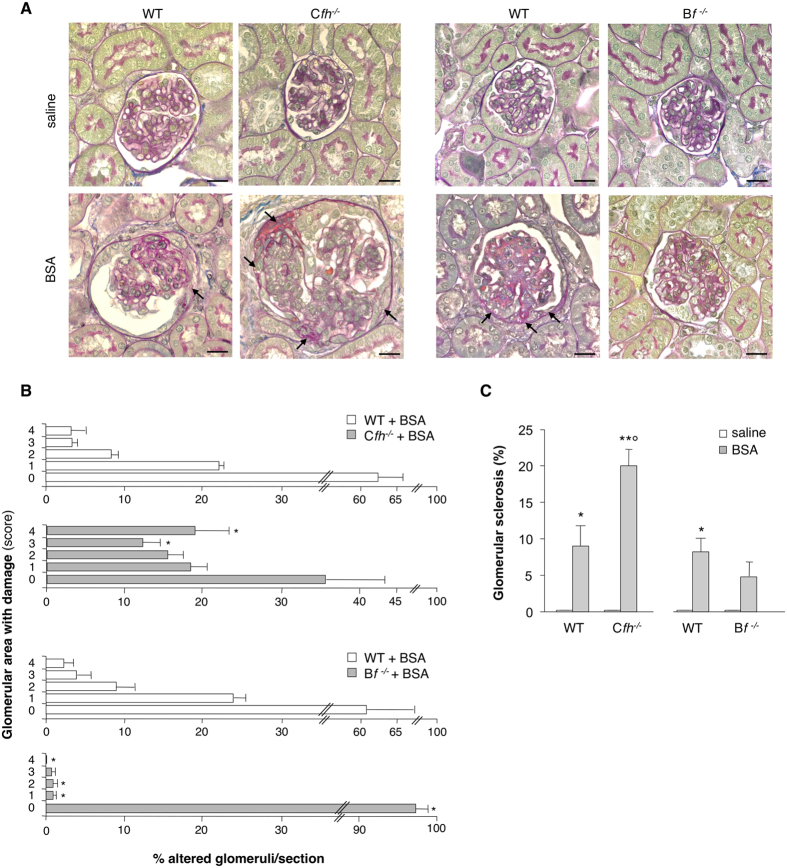
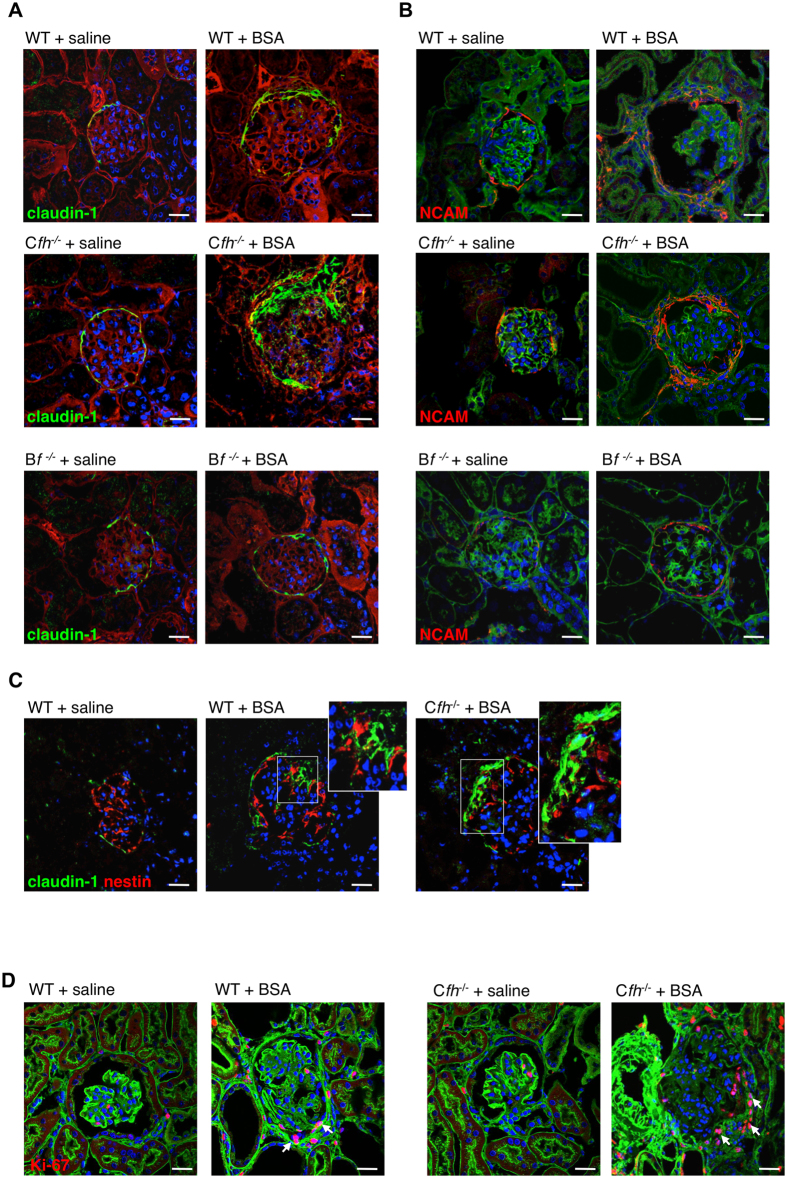
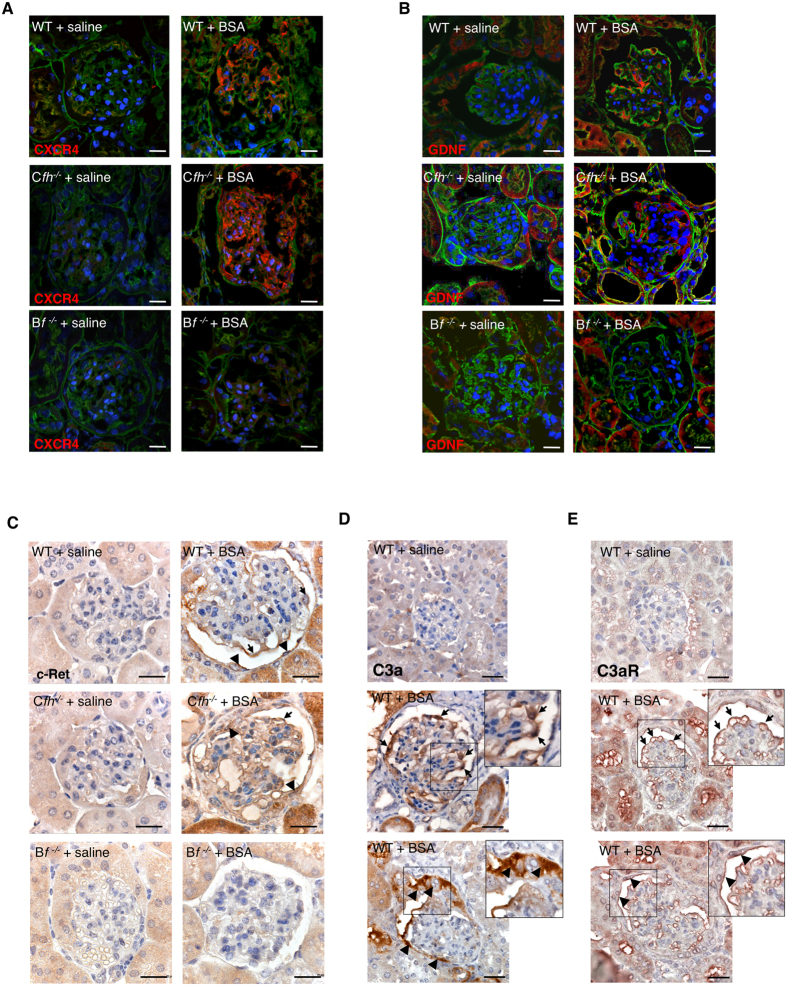
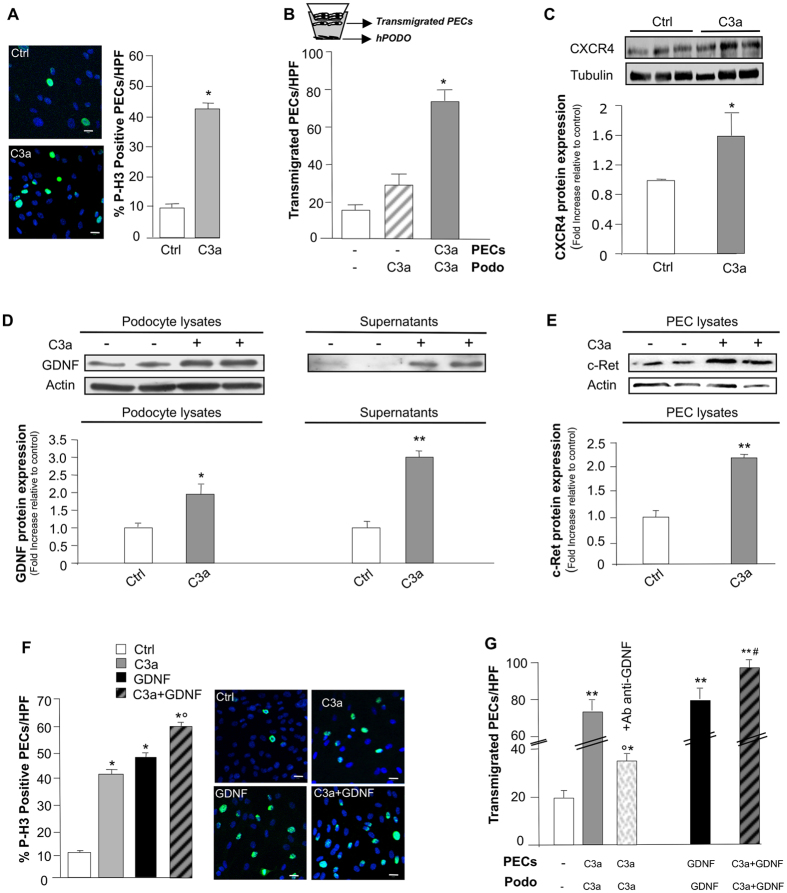
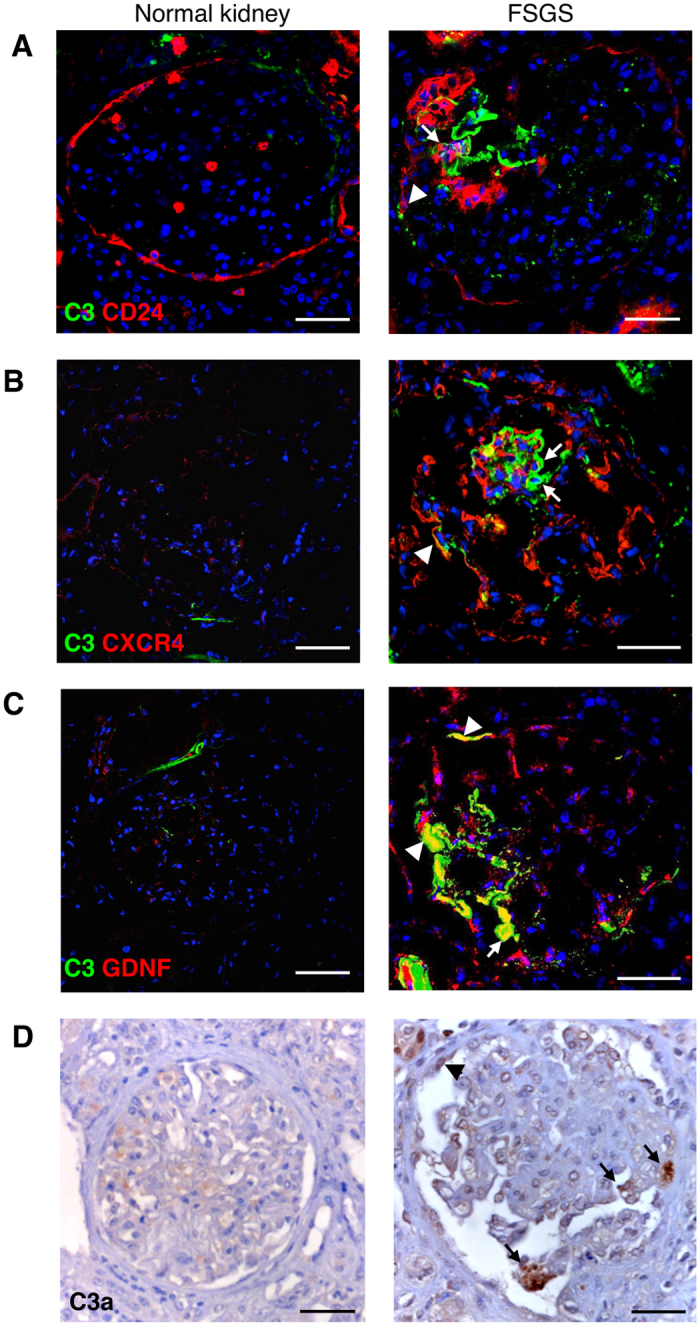
Podocyte loss is the initial event in the development of glomerulosclerosis, the structural hallmark of progressive proteinuric nephropathies. Understanding mechanisms underlying glomerular injury is the key challenge for identifying novel therapeutic targets. In mice with protein-overload induced by bovine serum albumin (BSA), we evaluated whether the alternative pathway (AP) of complement mediated podocyte depletion and podocyte-dependent parietal epithelial cell (PEC) activation causing glomerulosclerosis. Factor H (Cfh(-/-)) or factor B-deficient mice were studied in comparison with wild-type (WT) littermates. WT+BSA mice showed podocyte depletion accompanied by glomerular complement C3 and C3a deposits, PEC migration to capillary tuft, proliferation, and glomerulosclerosis. These changes were more prominent in Cfh(-/-) +BSA mice. The pathogenic role of AP was documented by data that factor B deficiency preserved glomerular integrity. In protein-overload mice, PEC dysregulation was associated with upregulation of CXCR4 and GDNF/c-Ret axis. In vitro studies provided additional evidence of a direct action of C3a on proliferation and CXCR4-related migration of PECs. These effects were enhanced by podocyte-derived GDNF. In patients with proteinuric nephropathy, glomerular C3/C3a paralleled PEC activation, CXCR4 and GDNF upregulation. These results indicate that mechanistically uncontrolled AP complement activation is not dispensable for podocyte-dependent PEC activation resulting in glomerulosclerosis.


Figures

Figure 1
Figure 1. Complement activation via AP causes podocyte depletion in mice with protein-overload proteinuria.
(A) Quantification of WT1-positive podocytes expressed as number per glomerulus in Cfh−/−, Bf−/− mice and the corresponding WT littermates receiving saline or BSA (n = 5 mice/group), evaluated on day 23 after starting BSA. *P < 0.05, **P < 0.01 versus corresponding saline; °P < 0.05 vs corresponding WT+BSA. (B) Urinary albumin/creatinine ratio measured on day 23 after starting BSA in WT, Cfh−/− and Bf−/− mice receiving saline or BSA. **P < 0.01 versus corresponding saline; °°P < 0.01 vs corresponding WT+BSA (n = 4 WT mice treated with saline or BSA, n = 5 Cfh−/− +saline mice, n = 6 Cfh−/− +BSA mice and n = 5 Bf−/− mice treated with saline or BSA). (C) Representative images showing glomerular C3 deposits (green) in WT, Cfh−/− or Bf−/− mice injected with saline or BSA. Scale bars: 20 μm. (D) Quantification of C3 staining expressed as percentage of positive glomerular area. *P < 0.05, **P < 0.01 versus corresponding saline; §P < 0.0001 versus corresponding WT+saline, °P < 0.01, °°P < 0.0001 versus corresponding WT+BSA (n = 4 WT mice treated with saline or BSA, n = 5 Cfh−/− mice treated with saline or BSA and n = 5 Bf−/− mice treated with saline or BSA). (E) Representative images of renal tissue from WT and Cfh−/− +BSA mice showing merged area (yellow) of costaining of glomerular C3 deposits (green) and nephrin (red) in podocytes. Insets display enlarged images. Nuclei are counterstained with DAPI. Scale bars: 20 μm. Data information: Values are presented as mean ± SEM. ANOVA corrected with Tukey (B) or Bonferroni (A,C,D,E) coefficient.
Figure 2
Figure 2. Uncontrolled complement deposition fosters glomerular hyperplastic-like lesions in protein-overload proteinuria.
(A) PAS-stained images of representative glomeruli from Cfh−/−, Bf−/− mice and the corresponding WT littermates receiving saline or BSA. Arrows indicate area of adhesion between the glomerular tuft and Bowman’s capsule. Scale bars: 20 μm. (B) Quantification of percentage of glomeruli with different degrees of glomerular lesions/adhesions, scored from 0 to 4, where 0 is without lesions, 1 ≤ 25%, 2 = 26–50%, 3 = 51–75%, 4 ≥ 76% of area of adhesion between the glomerular tuft and Bowman’s capsule. *P < 0.05 versus corresponding WT+BSA by non-parametric Mann-Whitney test (n = 4 corresponding WT littermates, n = 6 Cfh−/− and n = 5 Bf−/− mice/group treated with BSA). (C) Percentage of glomeruli affected by sclerotic lesions assessed in PAS-stained kidney sections of WT, Cfh−/− and Bf−/− mice treated with saline or BSA. *P < 0.05, **P < 0.01 versus corresponding saline, °P < 0.01 versus corresponding WT+BSA by ANOVA corrected with Bonferroni coefficient (n = 4 WT+saline mice, n = 5 WT+BSA mice, n = 5 Cfh−/− +saline mice, n = 6 Cfh−/− +BSA mice and n = 5 Bf−/− mice treated with saline or BSA). Data information: Values are presented as mean ± SEM.
Figure 3
Figure 3. Complement activation induces PEC dysregulation and proliferation in response to protein-overload.
(A,B) Representative images showing claudin-1 (A, green) and NCAM (B, red) expression in WT (littermates of Cfh−/− mice), Cfh−/− and Bf−/− mice injected with saline or BSA. Renal structure is stained with rhodamine (A, red) or FITC-WGA lectin (B, green). (C) Double immunofluorescence staining for claudin-1 (green) and nestin (red) in WT mice given saline and BSA and in Cfh−/− mice treated with BSA. Insets display enlarged images of claudin-1+ PECs and nestin+ podocytes in the context of glomerular lesions. (D) Representative immunofluorescence images showing Ki-67-positive cells (red, arrows) in WT and Cfh−/− mice injected with saline or BSA. Renal structure is counterstained with FITC-WGA lectin (green). Data information: Nuclei are counterstained with DAPI (blue). Scale bars: 20 μm.
Figure 4
Figure 4. Complement activation, paralleled by glomerular C3a/C3a receptor expression, induces the expression of CXCR4 and GDNF in protein-overloaded mice.
(A,B) Expression of CXCR4 (A, red) and GDNF (B, red) in kidney samples of WT (littermates of Cfh−/− mice), Cfh−/− and Bf−/− mice injected with saline or BSA. Renal structure is counterstained with FITC-WGA lectin (green). (C) Glomerular expression of c-Ret in podocytes (arrows) and PECs (arrowheads) by immunohistochemistry in WT (littermates of Cfh−/− mice), Cfh−/− and Bf−/− mice injected with saline or BSA. (D,E) Representative images of C3a (D) and C3a receptor (E) by immunohistochemistry in WT mice injected with saline or BSA. Podocytes and PECs are indicated with arrows and arrowheads, respectively. Insets display enlarged images. Data information: Nuclei are counterstained with DAPI (blue). Scale bars: 20 μm.
Figure 5
Figure 5. C3a-dependent PEC activation is enhanced by podocyte-derived GDNF in vitro.
(A) Representative images of P-H3 (green) and DAPI (blue) in untreated (Ctrl) or C3a-treated PECs (24 hours). Quantification of proliferating PECs (P-H3+) exposed to medium or C3a (1 μM). Data expressed as percentage of P-H3+PECs per total DAPI-positive cells/HPF (5–8 random fields, n = 5 experiments). *P < 0.001 versus Ctrl. (B) Quantification of cell migration in co-culture transwell system of podocytes and PECs (see scheme) exposed to medium or C3a. Data expressed as number of PECs migrated from the upper chamber across the filter towards podocytes/HPF (5–8 random fields, n = 4 experiments). *P < 0.001 versus Ctrl and C3a-Podo. (C) Representative Western blotting and densitometric analysis of CXCR4 protein in untreated or C3a-stimulated PECs (15 hours). Tubulin used as sample loading control (n = 3 experiments). *P < 0.05 versus Ctrl. (D) Western blotting and densitometric analysis of GDNF in untreated or C3a-activated podocyte lysates (left panel) and supernatants (right panel) 15 hours. Actin used as sample loading control (n = 4 experiments). *P < 0.05, **P < 0.01 versus Ctrl. (E) Western blotting and densitometric analysis of c-Ret in untreated or C3a-stimulated PEC lysates (15 hours). (n = 3 experiments). **P < 0.01 versus Ctrl. (F) Representative images of P-H3 (green) and DAPI (blue) in untreated, C3a-, GDNF- or C3a + GDNF-treated PECs (24 hours). Scale bar: 20 μm. Quantification of proliferating P-H3+PECs exposed to medium, C3a, GDNF (100 ng/ml) and C3a + GDNF. Data expressed as percentage of P-H3+PECs per total DAPI-positive cells/HPF (5–8 random fields, n = 5 experiments). *P < 0.001 versus Ctrl; °P < 0.01 versus C3a- and GDNF-treated PECs. (G) Quantification of PEC migration in co-culture transwells from the upper chamber towards unstimulated or C3a-activated podocytes (24 hours) in the presence or absence of the anti-GDNF antibody. In additional samples, PECs and podocytes were exposed to GDNF or C3a + GDNF (24 hours). Data expressed as transmigrated PECs/HPF (5–8 random fields, n = 4 experiments). *P < 0.05, **P < 0.001 versus unstimulated cells; °P < 0.001 versus C3a, GDNF and C3a + GDNF-treated PECs; #P < 0.01 versus C3a- and GDNF-treated PECs. Data information: Values are presented as mean ± SEM. Scale bars: 20 μm. (A,B,F,G) ANOVA corrected with Bonferroni coefficient or (C,D,E) unpaired Student’s t-test.
Figure 6
Figure 6. C3 and C3a, CD24, CXCR4 and GDNF expression in renal biopsies of patients with focal segmental glomerulosclerosis (FSGS).
(A) Representative double immunofluorescence staining for C3 (green) and PECs labelled for CD24 (red) in normal control kidney (n = 4) and in the renal biopsy of patients with FSGS (n = 10). (B,C) Co-staining for CXCR4 (red) and C3 (green) (B), and GDNF (red) and C3 (green) (C) in normal subjects and FSGS patients. (D) Representative images of C3a immunostaining of renal tissue in normal and diseased kidneys. Data information: Podocytes and PECs are indicated with arrows and arrowheads, respectively. DAPI (blue) stains nuclei. Scale bars: 50 μm.

Similar articles

Cited by

References

    1. D’Agati V. D., Kaskel F. J. & Falk R. J. Focal segmental glomerulosclerosis. N Engl J Med 365, 2398–2411 (2011). - PubMed
    1. Satirapoj B., Nast C. C. & Adler S. G. Novel insights into the relationship between glomerular pathology and progressive kidney disease. Adv Chronic Kidney Dis 19, 93–100 (2012). - PubMed
    1. Zoja C., Abbate M. & Remuzzi G. Progression of renal injury toward interstitial inflammation and glomerular sclerosis is dependent on abnormal protein filtration. Nephrol Dial Transplant 30, 706–712 (2015). - PubMed
    1. Kim Y. H. et al.. Podocyte depletion and glomerulosclerosis have a direct relationship in the PAN-treated rat. Kidney Int 60, 957–968 (2001). - PubMed
    1. Kriz W. Podocyte is the major culprit accounting for the progression of chronic renal disease. Microsc Res Tech 57, 189–195 (2002). - PubMed

Publication types

MeSH terms

LinkOut - more resources