. 2017 Jan 19;36(3):332-349.
doi: 10.1038/onc.2016.221. Epub 2016 Jun 27.

KRT19 directly interacts with β-catenin/RAC1 complex to regulate NUMB-dependent NOTCH signaling pathway and breast cancer properties

Affiliations

KRT19 directly interacts with β-catenin/RAC1 complex to regulate NUMB-dependent NOTCH signaling pathway and breast cancer properties

S K Saha et al. Oncogene. .

Abstract

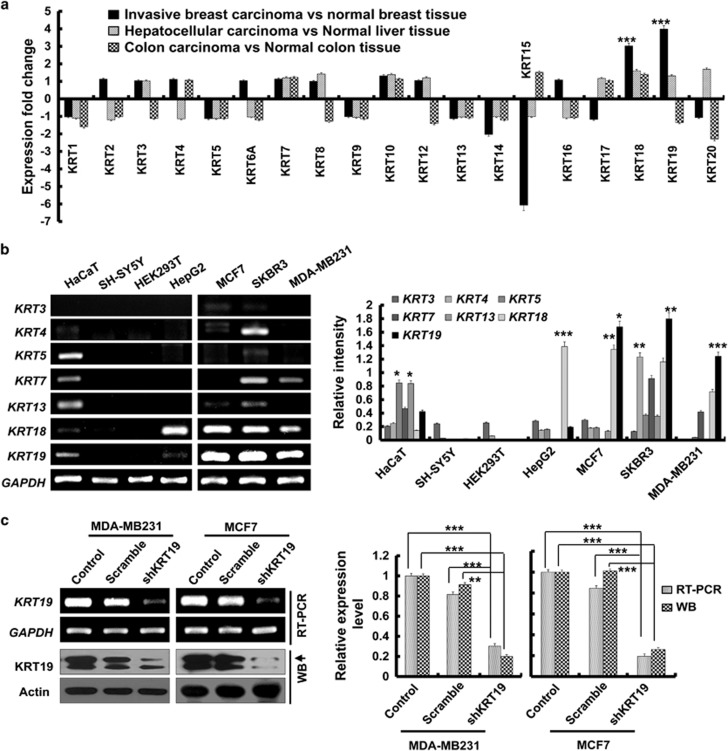
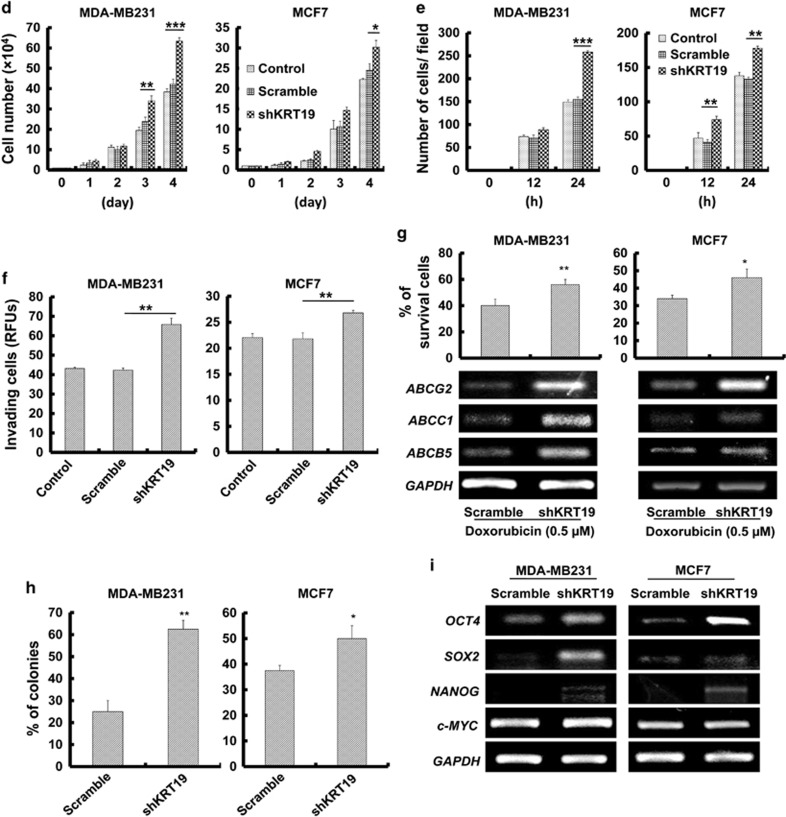
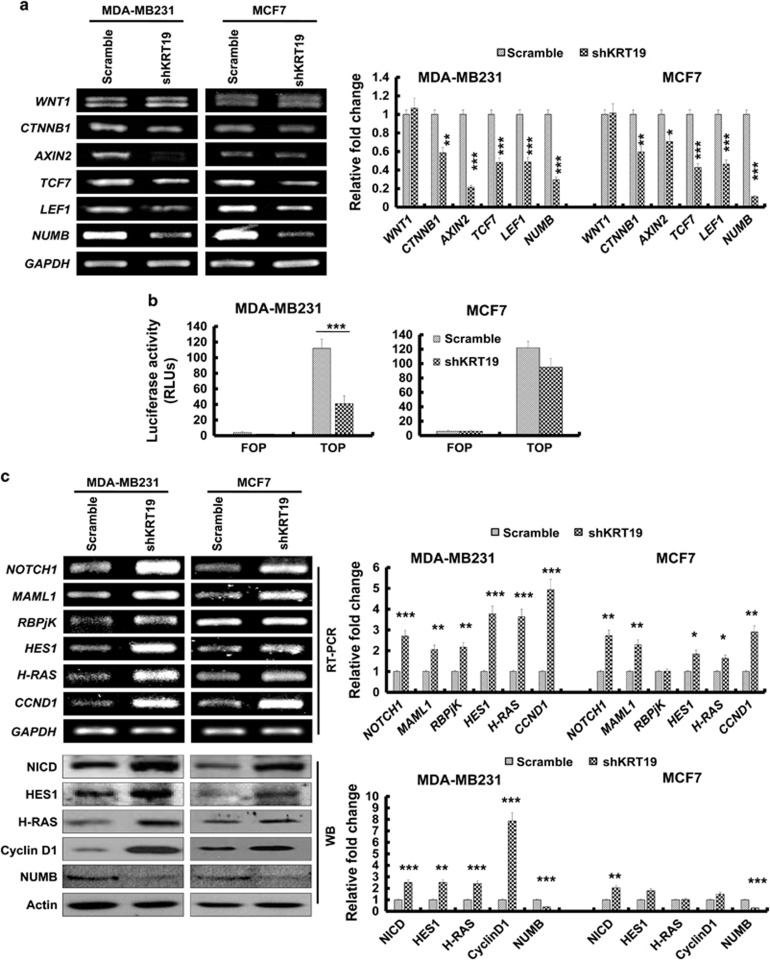
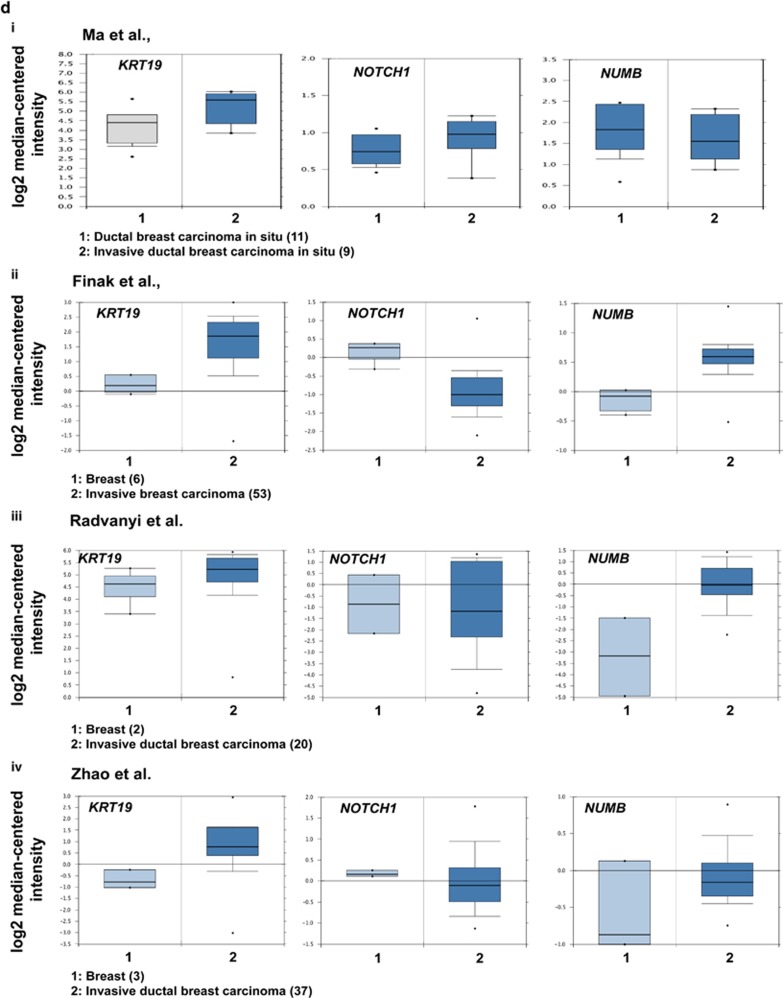
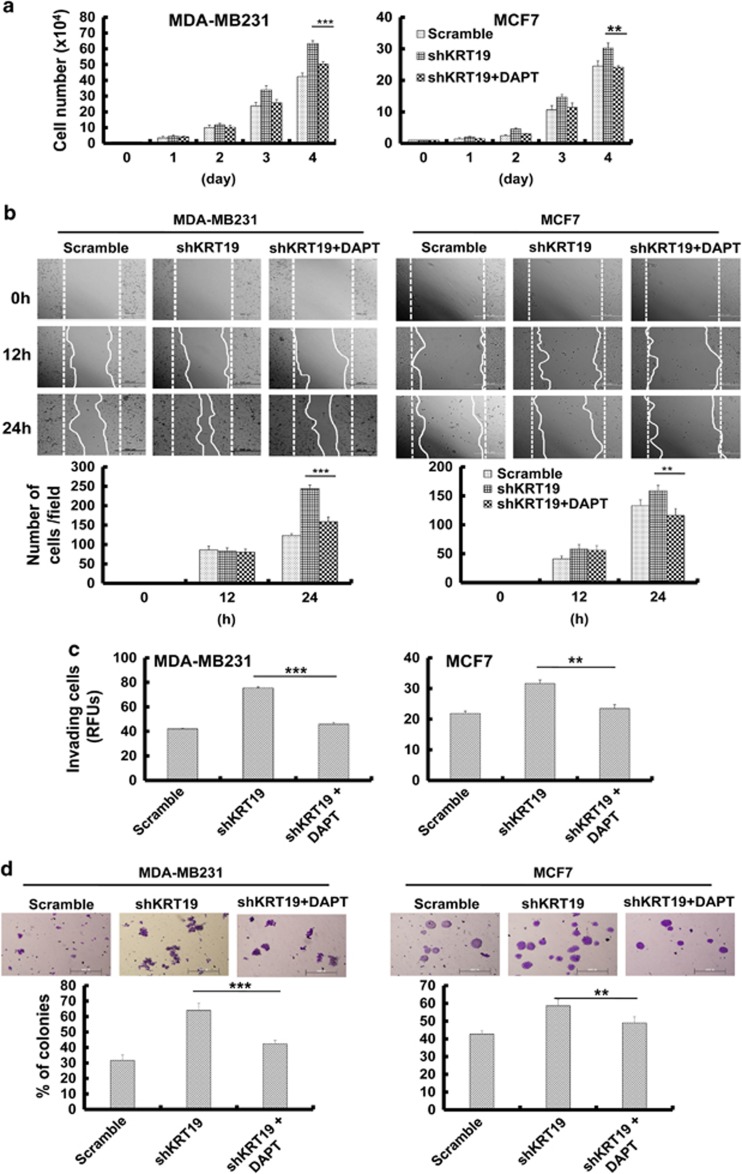
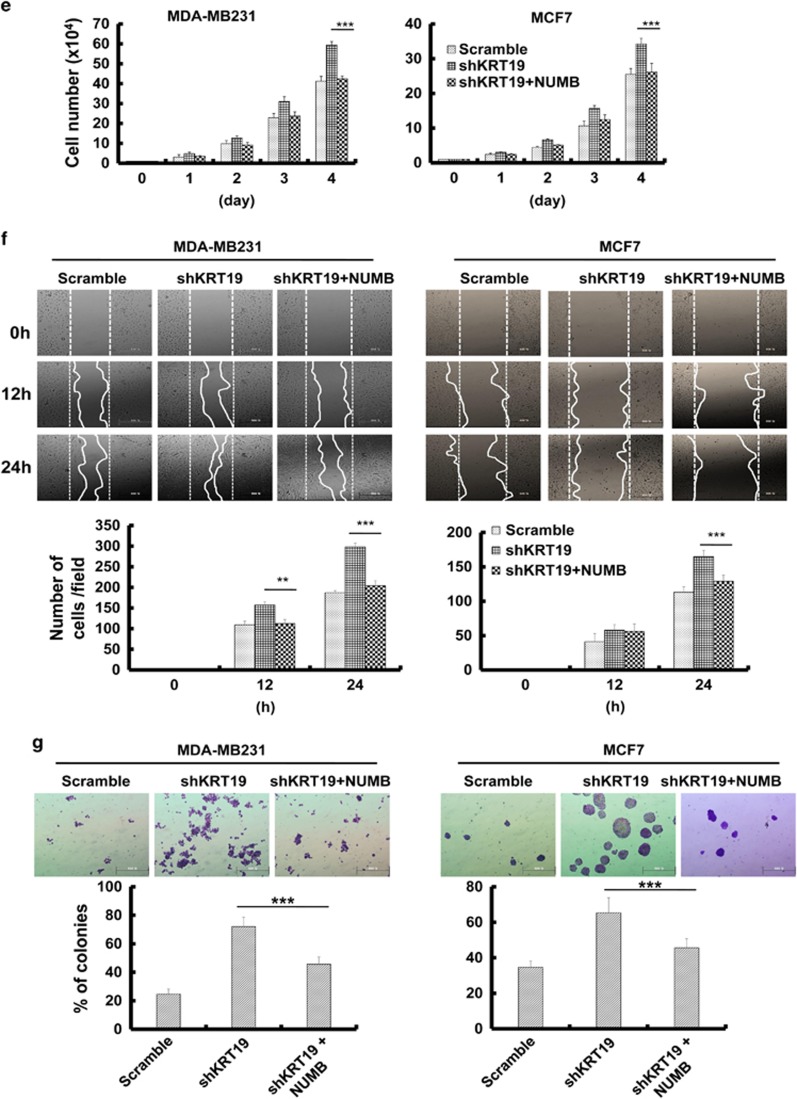
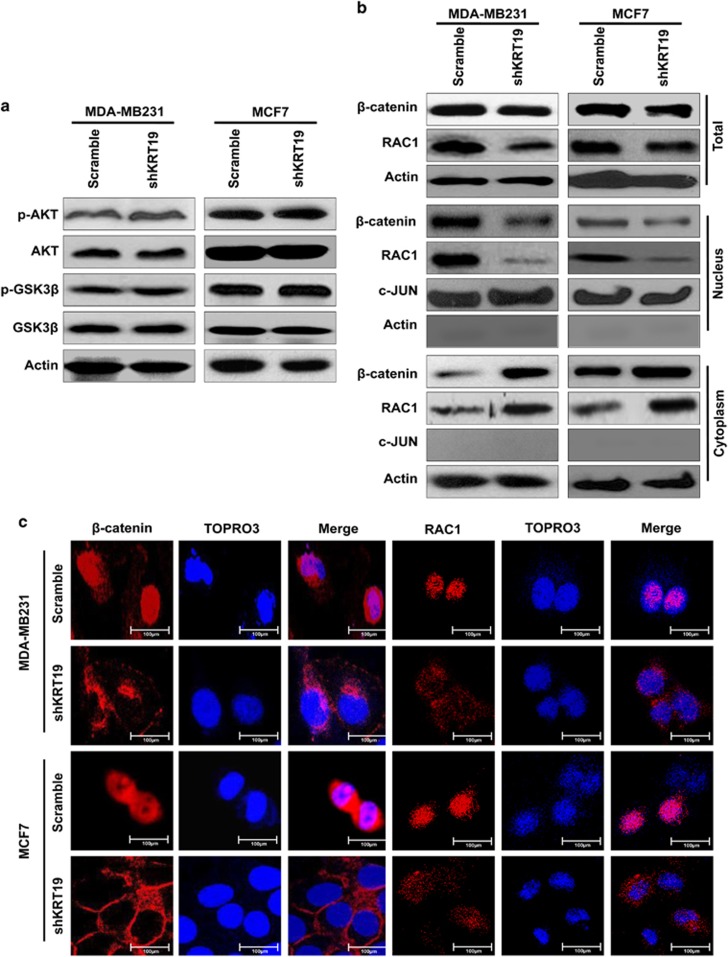
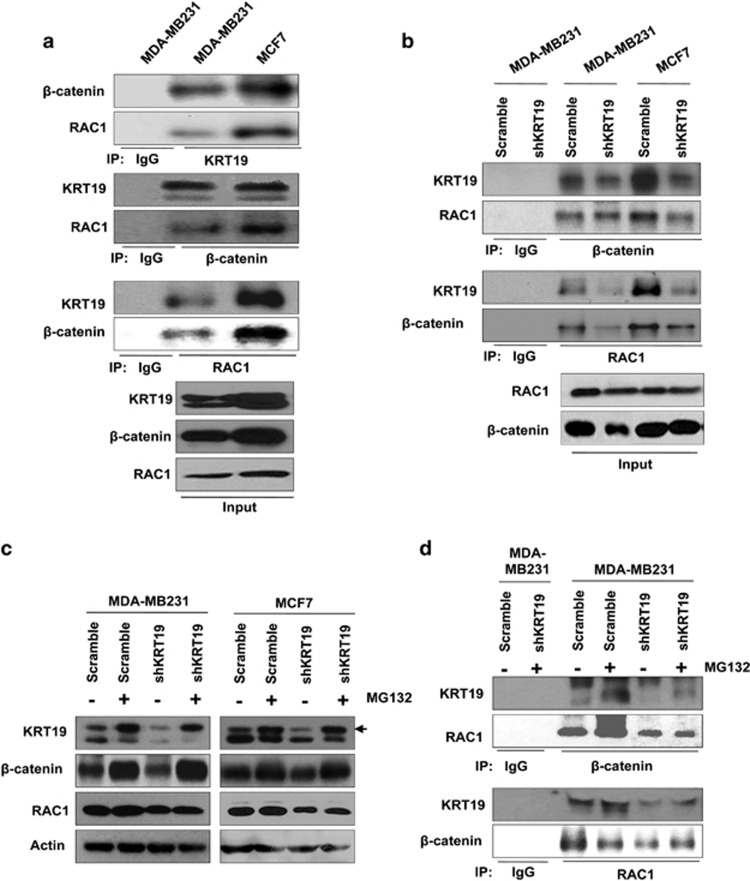
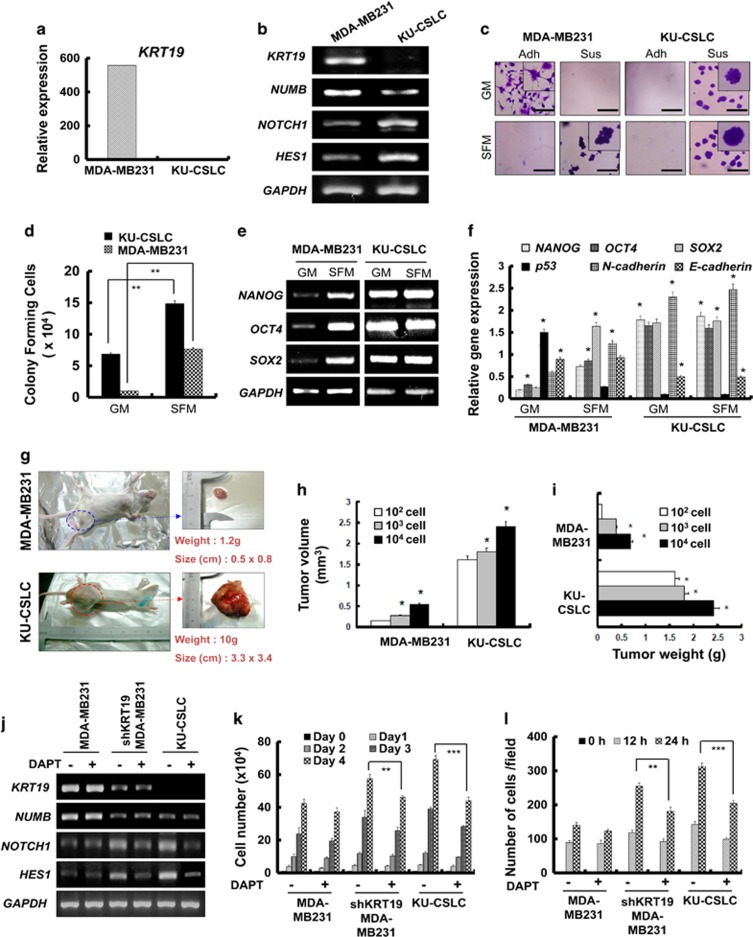
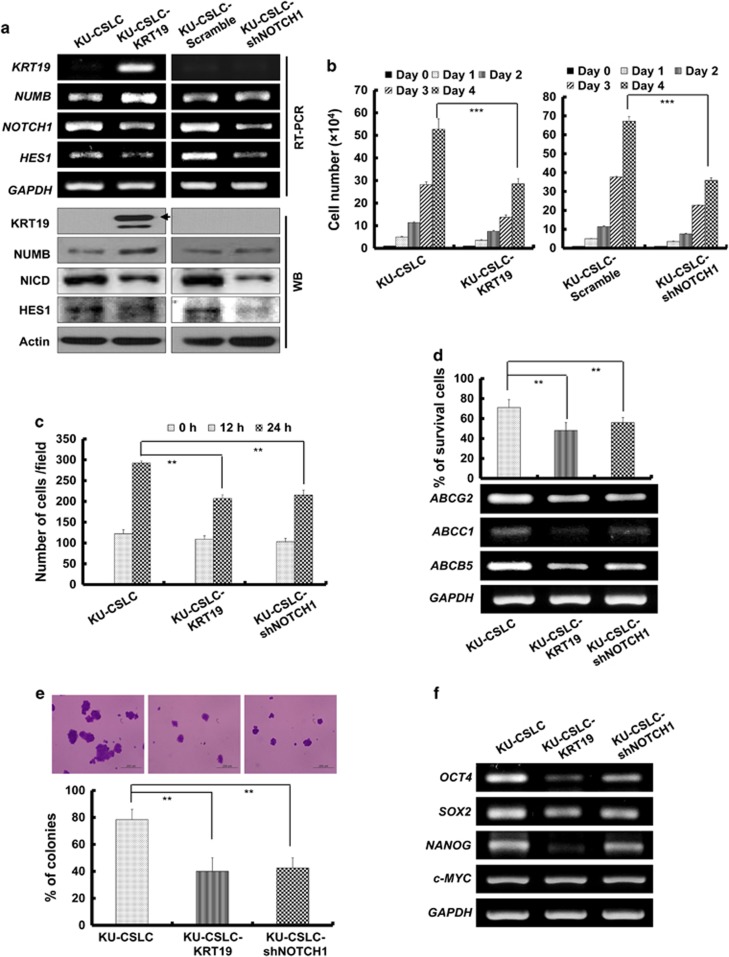
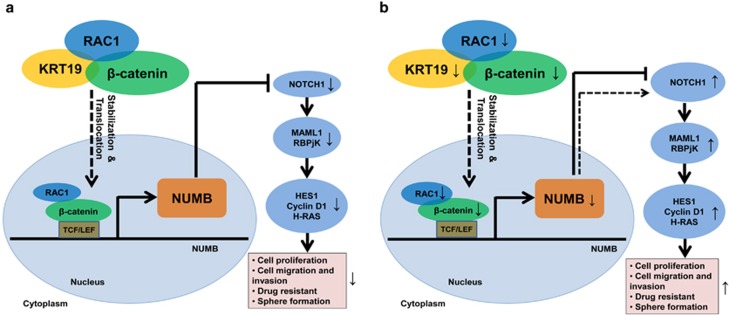
Studies have reported that interactions between keratins (KRTs) and other proteins initiate signaling cascades that regulate cell migration, invasion, and metastasis. In the current study, we found that expression of KRT19 was specifically high in breast cancers and significantly correlated with their invasiveness. Moreover, knockdown of KRT19 led to increased proliferation, migration, invasion, drug resistance, and sphere formation in breast cancer cells via an upregulated NOTCH signaling pathway. This was owing to reduced expression of NUMB, an inhibitory protein of the NOTCH signaling pathway. In addition, we found that KRT19 interacts with β-catenin/RAC1 complex and enhances the nuclear translocation of β-catenin. Concordantly, knockdown of KRT19 suppressed the nuclear translocation of β-catenin as well as β-catenin-mediated NUMB expression. Furthermore, modulation of KRT19-mediated regulation of NUMB and NOTCH1 expression led to the repression of the cancer stem cell properties of breast cancer patient-derived CD133high/CXCR4high/ALDH1high cancer stem-like cells (CSLCs), which showed very low KRT19 and high NOTCH1 expression. Taken together, our study suggests a novel function for KRT19 in the regulation of nuclear import of the β-catenin/RAC1 complex, thus modulating the NUMB-dependent NOTCH signaling pathway in breast cancers and CSLCs, which might bear potential clinical implications for cancer or CSLC treatment.


Figures

Figure 1
Figure 1
Knockdown of KRT19 increases cell proliferation, migration, invasion, drug resistance, and sphere formation in breast cancer cell lines. Data were obtained from three independent experiments and presented as average values±s.d. (*P<0.05, **P<0.01, ***P<0.001). (a) Expression fold changes for KRT genes (KRT1–20) in invasive ductal breast carcinoma versus (vs) normal breast tissue, hepatocellular carcinoma vs normal liver tissue, and colon adenocarcinoma vs normal colon tissue, as obtained from the Oncomine database. (b) mRNA expression of KRT genes in breast cancer (MCF7, SKBR3, and MDA-MB231), hepatocellular carcinoma (HepG2), neuroblastoma (SH-SY5Y), immortalized human keratinocytes (HaCaT), and immortalized human embryonic kidney (HEK293T) cell lines. Bands for KRTs in b were quantified by scanning densitometry and normalized to that of GAPDH (right panel). (c) KRT19 expression analyzed by reverse transcription polymerase chain reaction (RT–PCR) and western blot analysis. Either GAPDH or actin expression was used as control. Both KRT19 mRNA and protein expression were quantified by scanning densitometry and normalized to that of GAPDH and actin, respectively (right panel). (d) Effect of KRT19 knockdown on cell proliferation analyzed by cell counting. Cells were counted up to 4 days. (e) Migration capacity of the indicated cells analyzed using wound-healing/migration assay. The number of cells in the enclosure was enumerated at the indicated time points. (f) Effect of KRT19 suppression on cell invasion assessed using CytoSelect 96-Wells Cell Invasion Assay Kit. Fluorescent intensities (RFUs) of the invading cells were plotted for control, scrambled shRNA (scramble), and shKRT19 MDA-MB231 and MCF7 cells. (g) Effect of KRT19 knockdown on drug resistance measured by cell counting after 24 h of doxorubicin treatment (0.5 μM). The mRNA expression level of drug-resistance marker genes was analyzed in the shKRT19 knockdown cells. (h) Cells were cultured in suspension in sphere-forming media (SFM) using non-coated plates. The number of spheres was counted on day 5. (i) mRNA expression levels of stemness marker genes were analyzed in the scramble and/or shKRT19 MDA-MB231 and MCF7 cells.
Figure 1
Figure 1
Knockdown of KRT19 increases cell proliferation, migration, invasion, drug resistance, and sphere formation in breast cancer cell lines. Data were obtained from three independent experiments and presented as average values±s.d. (*P<0.05, **P<0.01, ***P<0.001). (a) Expression fold changes for KRT genes (KRT1–20) in invasive ductal breast carcinoma versus (vs) normal breast tissue, hepatocellular carcinoma vs normal liver tissue, and colon adenocarcinoma vs normal colon tissue, as obtained from the Oncomine database. (b) mRNA expression of KRT genes in breast cancer (MCF7, SKBR3, and MDA-MB231), hepatocellular carcinoma (HepG2), neuroblastoma (SH-SY5Y), immortalized human keratinocytes (HaCaT), and immortalized human embryonic kidney (HEK293T) cell lines. Bands for KRTs in b were quantified by scanning densitometry and normalized to that of GAPDH (right panel). (c) KRT19 expression analyzed by reverse transcription polymerase chain reaction (RT–PCR) and western blot analysis. Either GAPDH or actin expression was used as control. Both KRT19 mRNA and protein expression were quantified by scanning densitometry and normalized to that of GAPDH and actin, respectively (right panel). (d) Effect of KRT19 knockdown on cell proliferation analyzed by cell counting. Cells were counted up to 4 days. (e) Migration capacity of the indicated cells analyzed using wound-healing/migration assay. The number of cells in the enclosure was enumerated at the indicated time points. (f) Effect of KRT19 suppression on cell invasion assessed using CytoSelect 96-Wells Cell Invasion Assay Kit. Fluorescent intensities (RFUs) of the invading cells were plotted for control, scrambled shRNA (scramble), and shKRT19 MDA-MB231 and MCF7 cells. (g) Effect of KRT19 knockdown on drug resistance measured by cell counting after 24 h of doxorubicin treatment (0.5 μM). The mRNA expression level of drug-resistance marker genes was analyzed in the shKRT19 knockdown cells. (h) Cells were cultured in suspension in sphere-forming media (SFM) using non-coated plates. The number of spheres was counted on day 5. (i) mRNA expression levels of stemness marker genes were analyzed in the scramble and/or shKRT19 MDA-MB231 and MCF7 cells.
Figure 2
Figure 2
Silencing of KRT19 expression upregulates the NOTCH signaling pathway by downregulating NUMB expression. Data were obtained from three independent experiments and presented as average values±s.d. (*P<0.05, **P<0.01, ***P<0.001). (a) Expression levels of WNT1, CTNNB1, AXIN2, TCF7, LEF1, and NUMB were analyzed using RT–PCR. Bands were quantified by scanning densitometry and normalized to that of GAPDH (right panel). (b) The TOP-/FOP-Flash assays were evaluated using luciferase assay system. The indicated cells were transfected with TOP- or FOP-Flash plasmid, and then luciferase activity was measured. (c) Expression levels of NOTCH1, MAML1, RBPjK, HES1, CCND1, and H-RAS were analyzed using RT–PCR; protein levels of NICD, HES1, cyclinD1, H-RAS, and NUMB were assessed using western blotting (lower panel). Bands were quantified by scanning densitometry and normalized to that of GAPDH or actin (right panel). (d) Relative levels of KRT19, NOTCH1, and NUMB expression were analyzed in normal and invasive breast carcinomas using different Oncomine databases. Box, whiskers and asterisks reflect the interquartile range, 10–90% range, and the minimum or maximum values, respectively. Data are normalized facilitating inter-study comparison. The image was downloaded from the Oncomine datasets provided by Ma et al., Finak et al., Radvanyi et al. or Zhao et al.
Figure 2
Figure 2
Silencing of KRT19 expression upregulates the NOTCH signaling pathway by downregulating NUMB expression. Data were obtained from three independent experiments and presented as average values±s.d. (*P<0.05, **P<0.01, ***P<0.001). (a) Expression levels of WNT1, CTNNB1, AXIN2, TCF7, LEF1, and NUMB were analyzed using RT–PCR. Bands were quantified by scanning densitometry and normalized to that of GAPDH (right panel). (b) The TOP-/FOP-Flash assays were evaluated using luciferase assay system. The indicated cells were transfected with TOP- or FOP-Flash plasmid, and then luciferase activity was measured. (c) Expression levels of NOTCH1, MAML1, RBPjK, HES1, CCND1, and H-RAS were analyzed using RT–PCR; protein levels of NICD, HES1, cyclinD1, H-RAS, and NUMB were assessed using western blotting (lower panel). Bands were quantified by scanning densitometry and normalized to that of GAPDH or actin (right panel). (d) Relative levels of KRT19, NOTCH1, and NUMB expression were analyzed in normal and invasive breast carcinomas using different Oncomine databases. Box, whiskers and asterisks reflect the interquartile range, 10–90% range, and the minimum or maximum values, respectively. Data are normalized facilitating inter-study comparison. The image was downloaded from the Oncomine datasets provided by Ma et al., Finak et al., Radvanyi et al. or Zhao et al.
Figure 3
Figure 3
DAPT treatment and NUMB overexpression help to overcome the effects of KRT19 knockdown on proliferation, migration, invasion, and sphere formation in breast cancer cell lines. Data were obtained from three independent experiments and presented as average values±s.d. (*P<0.05, **P<0.01, ***P<0.001). (a) Cell proliferation upon DAPT treatment (20 μM) was analyzed by cell counting. Cells were counted up to 4 days. (b) Wound-healing/migration assay in DAPT-treated shKRT19 knockdown cells. Images were acquired at the indicated time points using bright-field microscopy (upper panel). The number of cells in the enclosure was counted (lower panel). (c) Invasiveness was analyzed in DAPT-treated shKRT19 knockdown cells. (d) The indicated cells were cultured in suspension in SFM using non-coated plates. The number of spheres was stained with crystal violet (upper panel), and counted (lower panel) on day 5. (e) Cell proliferation upon NUMB overexpression in shKRT19 cells was analyzed by cell counting. Cells were counted up to 4 days. (f) Wound-healing/migration assay was conducted in NUMB-overexpressed shKRT19 knockdown cells. Images were acquired at the indicated time points using bright-field microscopy (upper panel). The number of cells in the enclosure was counted (lower panel). (g) The indicated cells were cultured in suspension in SFM using non-coated plates. The number of spheres was stained with crystal violet (upper panel), and counted (lower panel) on day 5.
Figure 3
Figure 3
DAPT treatment and NUMB overexpression help to overcome the effects of KRT19 knockdown on proliferation, migration, invasion, and sphere formation in breast cancer cell lines. Data were obtained from three independent experiments and presented as average values±s.d. (*P<0.05, **P<0.01, ***P<0.001). (a) Cell proliferation upon DAPT treatment (20 μM) was analyzed by cell counting. Cells were counted up to 4 days. (b) Wound-healing/migration assay in DAPT-treated shKRT19 knockdown cells. Images were acquired at the indicated time points using bright-field microscopy (upper panel). The number of cells in the enclosure was counted (lower panel). (c) Invasiveness was analyzed in DAPT-treated shKRT19 knockdown cells. (d) The indicated cells were cultured in suspension in SFM using non-coated plates. The number of spheres was stained with crystal violet (upper panel), and counted (lower panel) on day 5. (e) Cell proliferation upon NUMB overexpression in shKRT19 cells was analyzed by cell counting. Cells were counted up to 4 days. (f) Wound-healing/migration assay was conducted in NUMB-overexpressed shKRT19 knockdown cells. Images were acquired at the indicated time points using bright-field microscopy (upper panel). The number of cells in the enclosure was counted (lower panel). (g) The indicated cells were cultured in suspension in SFM using non-coated plates. The number of spheres was stained with crystal violet (upper panel), and counted (lower panel) on day 5.
Figure 4
Figure 4
KRT19 regulates nuclear translocation of the β-catenin-RAC1 complex. (a) Levels of phospho (p)-AKT, AKT, p-GSK3β, and GSK3β analyzed in the indicated cells using western blotting. (b) β-catenin and RAC1 levels in cytosolic and nuclear fractions as analyzed by western blotting. c-JUN and actin were used as nuclear and cytoplasmic markers, respectively. (c) Subcellular localization of β-catenin and RAC1 monitored by immunocytochemistry. Scale bar represents 100 μm.
Figure 5
Figure 5
KRT19 interacts with β-catenin and RAC1. (a) Lysates from the indicated cells were used for immunoprecipitation using Protein A/G Sepharose, antibodies specific for KRT19, β-catenin, and RAC1, and normal IgG. The immunoprecipitates were analyzed by western blotting with the antibodies indicated. For inputs, lysates were analyzed by western blotting with the indicated antibodies. (b) Immunoprecipitation conducted with the indicated antibodies using lysates from the indicated cells. For inputs, lysates were analyzed by western blotting with the indicated antibodies. (c) Cells were treated with MG132 and the protein levels of KRT19, β-catenin, and RAC1 were assessed by western blotting. (d) Immunoprecipitation assay was performed after MG132 treatment, using the antibodies indicated.
Figure 6
Figure 6
Patient-derived CD133high/CXCR4high/ALDH1high cancer stem-like cells (KU-CSLCs) show significantly decreased expression of KRT19 and highly enhanced CSLC properties. Data were obtained from three independent experiments and presented as average values±s.d. *P<0.05, **P<0.01, ***P<0.001). (a) mRNA expression of KRT19 analyzed by RNA sequencing in MDA-MB231 cells and KU-CSLCs. (b) Expression levels of KRT19, NUMB, NOTCH1, and HES1 analyzed using reverse transcription polymerase chain reaction (RT–PCR) and western blotting. (c and d) Sphere-formation analysis in either growth (GM) or SFM medium using non-coated plates. Spheres from either MDA-MB-231 cells or KU-CSLCs were collected after 5 days of culture, stained with crystal violet (c) and counted (d). (e and f) mRNA expression levels of stemness (OCT4, SOX2, and NANOG) and epithelial-to-mesenchymal (EMT; N- and E-cadherin) markers analyzed using RT–PCR (e) and quantitative (qPCR) (f) in MDA-MB231 cells and KU-CSLCs cultured in either GM or SFM. (g) Representative images of the MDA-MB231- or KU-CSLC-injected SCID mice (left), and the excized tumors (right) 4 weeks post tumor formation (n=5). Tumor volume (mm3) (h) and weight (g) (i) assessed after biopsy. (j) Expression of KRT19, NUMB, NOTCH1, and HES1 analyzed in the indicated cells after treatment with DAPT (20 μM). (k) Proliferation of the indicated cells was assessed for 4 days after DAPT treatment. (l) Wound-healing/migration assay in control and DAPT-treated cells. The number of cells in the enclosure was enumerated at the time points indicated.
Figure 7
Figure 7
Overexpression of KRT19 or knockdown of NOTCH1 leads to decreased CSLC properties in KU-CSLCs. Data were obtained from three independent experiments and presented as average values±s.d. (*P<0.05, **P<0.01, ***P<0.001). (a) Expression of KRT19, NUMB, NOTCH1, and HES1 analyzed in the KRT19-overexpressing or NOTCH1-knocked down KU-CSLCs using reverse transcription polymerase chain reaction (RT–PCR; upper panel). Protein levels of KRT19, NUMB, NICD, and HES1 were assessed by western blotting. (b) Proliferation of the indicated cells was assessed for 4 days. (c) Wound-healing/migration assay for the indicated cells. The number of cells in the enclosure was counted at the time points indicated. (d) Cell survival measured by cell counting after 24 h of treatment with doxorubicin (0.5 μM) (upper panel) and expression of drug-resistance markers analyzed by RT–PCR (lower panel). (e) Sphere formation in SFM using non-coated plates. Spheres from the indicated cells were collected after 5 days of culture, stained with crystal violet (upper panel) and counted (lower panel). (f) Expression of stemness markers in the indicated cells.
Figure 8
Figure 8
Schematic diagram depicting the KRT19-mediated regulation of NUMB expression, NOTCH signaling pathway and cancer/cancer stem-like cells (CSLC) properties in KRT19-overexpressing breast cancer cells. (a) KRT19 directly interacts with the β-catenin-RAC1 complex and stabilizes the ubiquitination and proteasomal degradation of β-catenin. This increases the nuclear translocation of β-catenin, enhancing NUMB expression in the process, which downregulates NOTCH signaling, its target genes, and consequently, cell proliferation, migration, invasion, drug resistance, and sphere formation. Patient-derived CD133high/CXCR4high/ALDH1high KU-CSLCs, which showed significantly reduced KRT19 expression, (b) displayed highly enhanced CSLC properties.

Similar articles

Cited by

References

    1. Lopez de Silanes I, Quesada MP, Esteller M. Aberrant regulation of messenger RNA 3'-untranslated region in human cancer. Cell Oncol 2007; 29: 1–17. - PMC - PubMed
    1. Ignatiadis M, Xenidis N, Perraki M, Apostolaki S, Politaki E, Kafousi M et al. Different prognostic value of cytokeratin-19 mrna–positive circulating tumor cells according to estrogen receptor and HER2 status in early-stage breast cancer. J Clin Oncol 2007; 25: 5194–5202. - PubMed
    1. Bozionellou V, Mavroudis D, Perraki M, Papadopoulos S, Apostolaki S, Stathopoulos E et al. Trastuzumab administration can effectively target chemotherapy-resistant cytokeratin-19 messenger RNA–positive tumor cells in the peripheral blood and bone marrow of patients with breast cancer. Clin Cancer Res 2004; 10: 8185–8194. - PubMed
    1. Coulombe PA, Wong P. Cytoplasmic intermediate filaments revealed as dynamic and multipurpose scaffolds. Nat Cell Biol 2004; 6: 699–706. - PubMed
    1. Omary MB, Ku N-O, Tao G-Z, Toivola DM, Liao J. ‘Heads and tails' of intermediate filament phosphorylation: multiple sites and functional insights. Trends Biochem Sci 2006; 31: 383–394. - PubMed

Publication types

MeSH terms