. 2016 Jun 27:6:28696.
doi: 10.1038/srep28696.

Comparative Structural and Computational Analysis Supports Eighteen Cellulose Synthases in the Plant Cellulose Synthesis Complex

Affiliations

Comparative Structural and Computational Analysis Supports Eighteen Cellulose Synthases in the Plant Cellulose Synthesis Complex

B Tracy Nixon et al. Sci Rep. .

Abstract

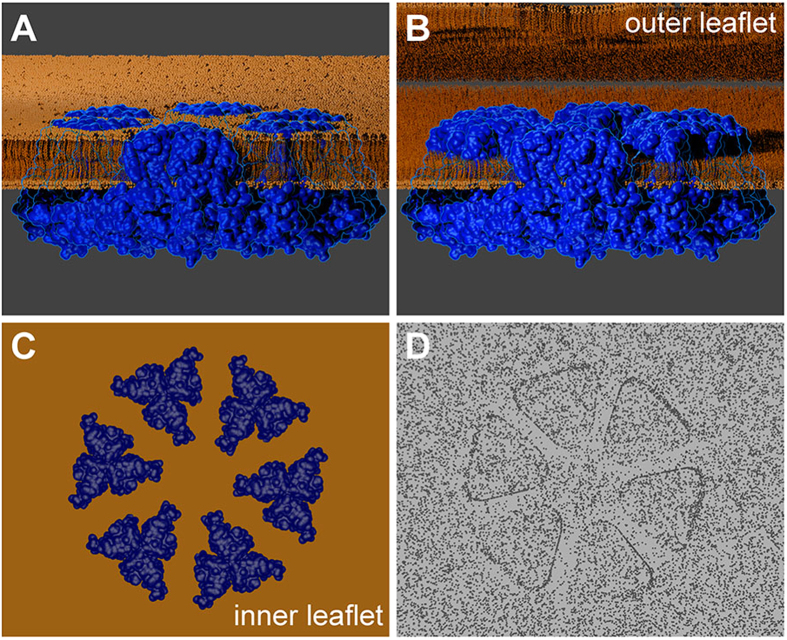
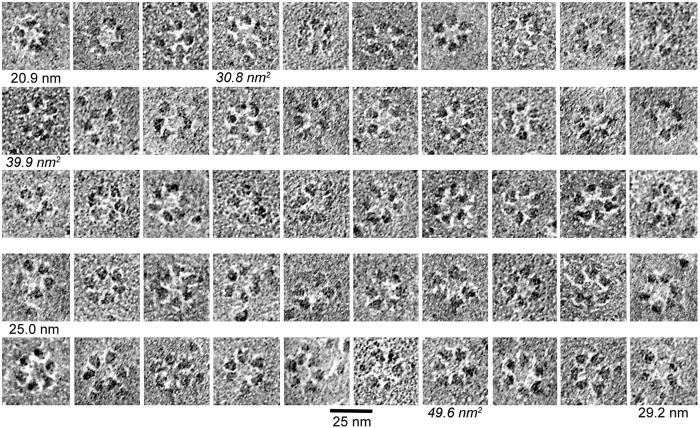
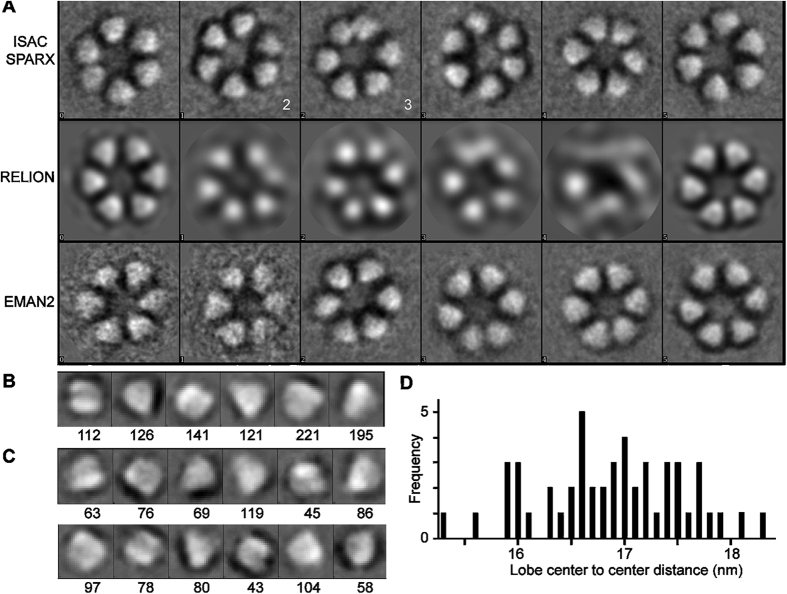
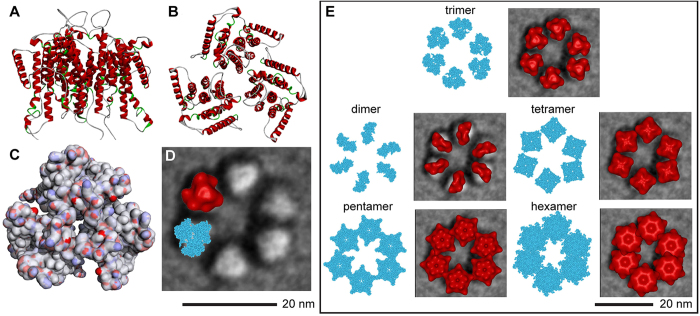
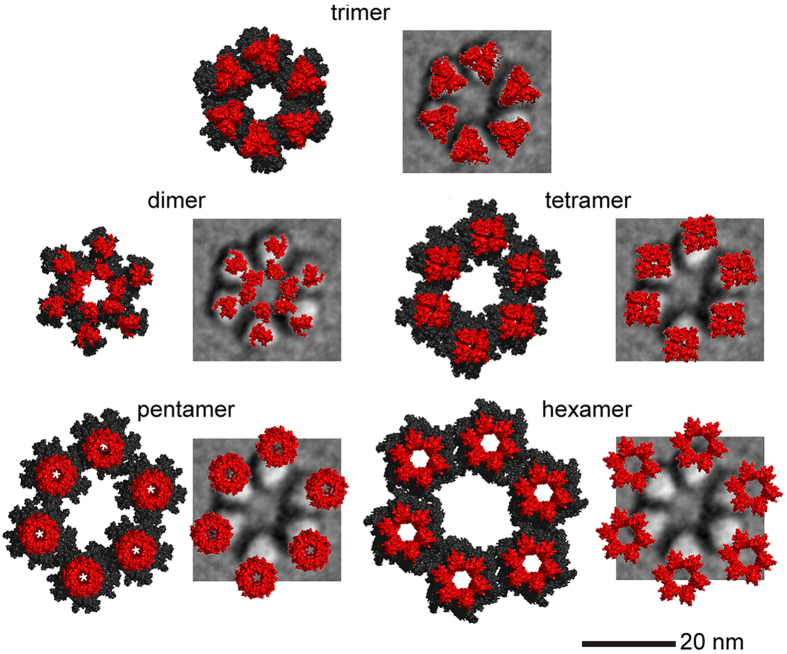
A six-lobed membrane spanning cellulose synthesis complex (CSC) containing multiple cellulose synthase (CESA) glycosyltransferases mediates cellulose microfibril formation. The number of CESAs in the CSC has been debated for decades in light of changing estimates of the diameter of the smallest microfibril formed from the β-1,4 glucan chains synthesized by one CSC. We obtained more direct evidence through generating improved transmission electron microscopy (TEM) images and image averages of the rosette-type CSC, revealing the frequent triangularity and average cross-sectional area in the plasma membrane of its individual lobes. Trimeric oligomers of two alternative CESA computational models corresponded well with individual lobe geometry. A six-fold assembly of the trimeric computational oligomer had the lowest potential energy per monomer and was consistent with rosette CSC morphology. Negative stain TEM and image averaging showed the triangularity of a recombinant CESA cytosolic domain, consistent with previous modeling of its trimeric nature from small angle scattering (SAXS) data. Six trimeric SAXS models nearly filled the space below an average FF-TEM image of the rosette CSC. In summary, the multifaceted data support a rosette CSC with 18 CESAs that mediates the synthesis of a fundamental microfibril composed of 18 glucan chains.


Figures

Figure 1
Figure 1. Cartoon to show how the TMH region of the CSC is viewed within replicas prepared by FF-TEM.
The cartoon was based on the 7 TMH CESA model as described in Supplementary Methods. (A) The membrane-spanning CESAs (blue) within a rosette CSC are embedded in the intact plasma membrane bilayer (orange). The membrane is cut away to reveal one of six lobes in face view. The top of the TMH region emerges minimally on the surface of the plasma membrane, and the catalytic domain is in the cytoplasm. (B) During specimen fracture, the outer leaflet of the plasma membrane is typically removed so that half of each ‘column’ of assembled TMH is revealed above the interior face of the inner plasma membrane leaflet (called the protoplasmic fracture, PF, face in FF-TEM terminology58). (C) A top-down view of the TMH of the rosette CSC, embedded within the inner leaflet of the plasma membrane, prior to metal shadowing and replication. The cytosolic portions of the assembled CESA proteins remain unseen beneath the membrane. (D) A representation of the metal replica that is finally viewed in the TEM after the removal of the biological material.
Figure 2
Figure 2. Gallery of fifty original FF-TEM images of rosette CSCs.
The gallery is arranged in order of estimated circular diameter, from smallest (20.9 nm) to largest (29.2 nm) as labeled below the panels. A rosette CSC with circular diameter near the mean value (25.0 nm) for the original images is also labeled. Three rosette CSCs labeled with nm2 in italic text are those with the minimum, mean, and maximum values for individual lobe area, as measured in the original images and averaged across the six lobes of each CSC. The 25 nm scale bar applies to all images.
Figure 3
Figure 3. Class averages of rosette CSCs and individual lobes imaged by FF-TEM.
(A) Class averages of entire rosette CSCs as derived from the three programs named on the left of each row. The white lobes arose from reversal of the original image contrast before averaging. ISAC/SPARX class average 2 was used for further comparisons because the spacing of its opposite lobes matched the average shown in (D). ISAC/SPARX class average 3 shows two lobes close together at the top of the image. ISAC/SPARX gave 6 class averages, so the programs RELION and EMAN2 were also set to provide 6 classes. Each side of the box containing a rosette CSC = 31.6 nm. (B) Six or (C) 12 class averages as derived by EMAN2 from individual lobes are shown, with the number of lobes in each class indicated below each panel. Each side of the box containing a lobe = 10.6 nm. (D) The distribution of center-to-center distances between opposite lobes in the class averages of the rosette CSCs in (A).
Figure 4
Figure 4. Computational prediction of a trimer of the putative 8 TMH region and spatial comparison to the rosette CSC.
In this analysis, only 8 TMH were included and the oligomers were centered manually on the lobes of the rosette CSC. (A) View from the side of 24 total alpha helices (red), eight within the TMH region of each CESA monomer. (B) View from the top (outside the cell). (C) Solvent accessible surface, as viewed from the top, colored by electrostatic potential. Blue, white or red represent positive, neutral charge, or negative charge, respectively. (D) A representative class average image of the rosette CSC (ISAC/SPARX class average 2 from Fig. 3) overlaid with the computed trimer of the TMH region depicted as Van der Waal spheres (cyan) or as an isosurface of the structure blurred to 2.5 nm resolution (red). A 20 nm scale bar for this panel is shown below. (E) The various oligomers were replicated six times (shown separately in cyan representations of atomic van der Waals spheres) and overlaid on the ISAC/SPARX class average 2 image of the rosette CSC. In the overlays, the atomic models are rendered as isosurfaces and shown in red. All views are ‘top down’, as if viewed from outside the cell. A 20 nm scale bar for this panel is in the lower right.
Figure 5
Figure 5. Computational predictions of the various oligomers of the putative 7 TMH CESA model and spatial comparisons to the rosette CSC.
In this analysis, seven TMH and the large catalytic/cytosolic domain were included in the model, and the oligomers were refined in MD simulations. All views are ‘top down’, from outside the cell. For each modeled oligomer (see labels in the figure), the left member of the pair shows the catalytic/cytosolic domain in black and the TMH in red. The right member of the pair shows only the TMH region overlaid on the ISAC/SPARX class average 2 image of the rosette CSC. The six-fold assembly of the trimeric TMH has the best fit with both the diameter and triangular lobe shape of the FF-TEM average image. The 20 nm scale bar applies to all images.
Figure 6
Figure 6. Comparison of images and models shows that a maximum of 18 CESAs can exist within the rosette CSC.
(A) A class average image of the negative stained trimeric AtCESA1 cystolic domain (left panel) with a cross-sectional area close to the mean value (108.7 nm2; see Supplementary Fig. S7). The class average image was superimposed with the SAXS filtered average model (middle panel; yellow triangle; 100 nm2 cross-sectional area) or a flat rendering of the cytosolic portion of the trimeric 7 TMH CESA model (right panel, blue molecular shape; 104 nm2 cross-sectional area). (B–D) Top, bottom and side views of the SAXS volume in (A) superimposed with the cytosolic domain of the trimeric 7 TMH CESA model. The 10 nm scale bar applies to panels B-D. (E) Six-fold replication of a semi-transparent rendering of the trimeric SAXS model overlaid onto an average FF-TEM image of the assembled TMH regions of the rosette CSC (ISAC/SPARK class average 2). This schematic represents the rosette CSC structure as if viewed from the cytosolic side. A 20 nm scale bar for this panel is shown.

References

    1. Stone B. Cellulose. structure and distribution. Encyclopedia of Life Sciences , 10.1038/npg.els.0003892 (2005). - DOI
    1. Mueller S. C. & Brown R. M. Evidence for an intramembrane component associated with a cellulose microfibril-synthesizing complex in higher plants. J. Cell Biol. 84, 315–326, 10.1083/jcb.84.2.315 (1980). - DOI - PMC - PubMed
    1. Giddings T. H., Brower D. L. & Staehelin L. A. Visualization of particle complexes in the plasma-membrane of Micrasterias denticulata associated with the formation of cellulose fibrils in primary and secondary cell-walls. J. Cell Biol. 84, 327–339, 10.1083/jcb.84.2.327 (1980). - DOI - PMC - PubMed
    1. Severs N. J. & Shotton D. M. Rapid Freezing, Freeze Fracture, and Deep Etching . 1st edn, (Wiley-Liss Inc., 1995).
    1. Kimura S. et al. Immunogold labeling of rosette terminal cellulose-synthesizing complexes in the vascular plant Vigna angularis. Plant Cell 11, 2075–2085, 10.1105/tpc.11.11.2075 (1999). - DOI - PMC - PubMed

Publication types

LinkOut - more resources