. 2016 Jun 27:6:28750.
doi: 10.1038/srep28750.

Netrin-G1 regulates fear-like and anxiety-like behaviors in dissociable neural circuits

Affiliations

Netrin-G1 regulates fear-like and anxiety-like behaviors in dissociable neural circuits

Qi Zhang et al. Sci Rep. .

Abstract

In vertebrate mammals, distributed neural circuits in the brain are involved in emotion-related behavior. Netrin-G1 is a glycosyl-phosphatidylinositol-anchored synaptic adhesion molecule whose deficiency results in impaired fear-like and anxiety-like behaviors under specific circumstances. To understand the cell type and circuit specificity of these responses, we generated netrin-G1 conditional knockout mice with loss of expression in cortical excitatory neurons, inhibitory neurons, or thalamic neurons. Genetic deletion of netrin-G1 in cortical excitatory neurons resulted in altered anxiety-like behavior, but intact fear-like behavior, whereas loss of netrin-G1 in inhibitory neurons resulted in attenuated fear-like behavior, but intact anxiety-like behavior. These data indicate a remarkable double dissociation of fear-like and anxiety-like behaviors involving netrin-G1 in excitatory and inhibitory neurons, respectively. Our findings support a crucial role for netrin-G1 in dissociable neural circuits for the modulation of emotion-related behaviors, and provide genetic models for investigating the mechanisms underlying the dissociation. The results also suggest the involvement of glycosyl-phosphatidylinositol-anchored synaptic adhesion molecules in the development and pathogenesis of emotion-related behavior.


Figures
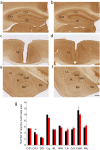
Figure 1
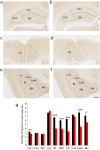
Figure 1. Differential c-Fos expression patterns in netrin-G1 gKO mice after elevated plus maze.
(a,c,e) Representative images of hippocampus, cingulate cortex, and amygdala from WT mice. (b,d,f) Representative images of the corresponding brain regions from netrin-G1 gKO mice. (g) The number of c-Fos positive cells in each ROI was compared between WT and netrin-G1 gKO mice using Student’s two-tailed t test, n = 8, (2 animals × 4 sections) per genotype. Netrin-G1 gKO mice had significantly fewer c-Fos positive cells in CA3 (p = 0.01) and marginally fewer c-Fos positive cells in the cingulate cortex (Cg, p = 0.066). The number of c-Fos positive cells was not significantly different in the CA1 (p = 0.84), dentate gyrus (DG, p = 0.68), or in any of the amygdala subnuclei: basolateral (BL, p = 0.95), basomedial (BM, p = 0.24), lateral (LA, p = 0.39), lateral central nucleus (CeL, p = 0.58), medial central nucleus (CeM, p = 0.33), and medial nucleus (Me, p = 0.44). Black columns represent WT and red columns represent gKO, and the data are represented as mean + SEM. *p < 0.05; scale bar: 500 μm (a,b); 250 μm (c,d); 280 μm (e,f).
Figure 2
Figure 2. Differential c-Fos expression patterns in netrin-G1 gKO mice after fear conditioning.
(a,c,e) Representative images of hippocampus, cingulate cortex, and amygdala from WT mice. (b,d,f) Representative images of the corresponding brain regions from netrin-G1 gKO. (g) The number of c-Fos positive cells in each ROI was compared between WT and netrin-G1 gKO mice using Student’s two-tailed t test, n = 8, (4 animals × 2 sections) per genotype. Netrin-G1 gKO mice had significantly fewer c-Fos-positive cells in CA1 compared with WT mice (p < 0.01), while there was no significant difference in the CA3 (p = 0.62), DG (p = 0.44) and Cg (p = 0.31). In the amygdala, the number of c-Fos positive cells was markedly decreased in almost all subnuclei of the amygdala, including the BL (p < 0.001), BM (p < 0.001), LA (p < 0.001), CeM (p < 0.001), and Me (p = 0.03). In the CeL, however, there was no significant difference between genotypes (p = 0.31). Black columns represent WT and red columns represent gKO, and the data are represented as the mean + SEM. *p < 0.05, **p < 0.01, ***p < 0.001; scale bar: 500 μm (a,b); 250 μm (c,d); 280 μm (e,f).
Figure 3
Figure 3. Construction and validation of netrin-G1 floxed mice.
(a) Schematic diagram of the strategy to generate netrin-G1 floxed mice. The targeting vector contains exon 2 in the targeting region. The 5′ probe with KpnI digest and 3′ probe with NcoI digest are indicated. The PCR primers for the targeted alleles are shown (red arrows). (b) Targeted events were identified by Southern blot analysis of KpnI-digested genomic ES cell DNA with a 5′-flanking probe, the WT allele 11.5 kb and the targeted allele 13.2 kb. (c) Southern blot analysis of NcoI-digested genomic ES cell DNA with a 3′-flanking probe, the WT allele 11.8 kb, and the targeted allele 6.4 kb. (d) The 3′ targeting was further confirmed by long PCR, which produced a 5-kb fragment. (e,f) ISH of NetrinG1f/f and NetrinG1f/f: CAG-Cre+, respectively, revealed that netrin-G1 expression was totally ablated in NetrinG1f/f: CAG-Cre+ mice. Scale bar: 1 mm.
Figure 4
Figure 4. Ablation of netrin-G1 in excitatory neurons in the cortex and thalamus.
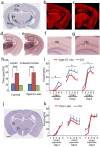
(a) X-gal staining of coronal sections of a NetrinG1-NLS-LacZ mouse. (b–d) X-gal staining of Rosa-NLS-LacZ reporter mice crossed with Emx1-Cre (b), 5HTT-Cre (c), and Pkcd-Cre (d) lines, respectively. (ej) Representative images from ISH of netrin-G1 (Ntng1). Horizontal sections from control (e) and Emx1-G1-cKO mice (f) show that cortical expression of netrin-G1 was abolished. Coronal sections from control (g) and 5HTT-G1-cKO (h) mice show the selective reduction of netrin-G1 in the ventral basal nucleus (Vbn) and lateral geniculate nucleus (Lgn). Coronal sections from control (i) and Pkcd-G1-cKO (j) mice show the dramatic reduction of netrin-G1 in almost the entire thalamus. (kp) Representative images from immunohistochemistry of netrin-G1. In Emx-G1-cKO (l) mice, netrin-G1 disappeared in the Slm and Oml of the hippocampus and piriform cortex layer I compared with the control (k). In 5HTT-G1-cKO (n) mice, netrin-G1 dramatically decreased in cortex layer IV compared with the control (m). In Pkcd-G1-cKO (p) mice, netrin-G1 disappeared from cortical layers IV and I compared with the control (o). Scale bar: 1 mm (af); 800 μm (gj); 750 μm (kp). (qs) Behaviors in the EPM. (q) The littermate control mice spent a significantly greater amount of time in the closed arms while Emx1-G1-cKO mice showed no preference between open and closed arms (n = 11/genotype). (r) 5HTT-G1-cKO mice showed no differences from the control mice (n = 12 per genotype). (s) Pkcd-G1-cKO mice showed no differences from the control mice (n = 12 per genotype). Shown are the mean + SEM. Unpaired two-tailed Student’s t test; ***p < 0.001; ns, not significant. (tv) Percent freezing behavior in the fear conditioning (day 1), context-dependent memory (day 2), and cue-dependent memory (day 3) tests. (t) No significant effect of genotype was detected in Emx-G1-cKO mice in all tests (n = 14 per genotype). (u) No significant effect of genotype was detected in 5HTT-G1-cKO mice in all tests (n = 12 per genotype). (v) No significant effect of genotype was detected in Pkcd-G1-cKO mice in all tests (n = 12 per genotype). Shown are the mean + SEM. Two-way ANOVA was conducted between time and genotype.
Figure 5
Figure 5. Netrin-G1 expression in inhibitory neurons.
(a) Coronal sections containing different brain regions were co-immunostained with antibodies against ß-gal (1: green) and GABA (2: red), and colocalization was observed (3: green + red). (a1–a3) represent cortex (Ctx) and (b1–b3) are higher magnified images of the areas indicated by the white boxes in a1–a3. (c1–c3) represent hippocampus (Hip) and (d1–d3) are higher magnified images (white boxes in c1–c3). (e1–e3) represent zona incerta (ZI) and (f1–f3) are higher magnified images (white boxes in e1–e3). (g1–g3) represent thalamus and (h1–h3) and (i1–i3) are higher magnified images from Vbn (white boxes in g1–g3) and reticular nucleus (Rt; yellow boxes in g1–g3). (j1–j3) represent amygdala, (k1–k3) and (l1–l3) are higher magnified images from LA (white boxes in j1–j3) and the dorsal intercalated cluster (ITC; yellow boxes in j1–j3). Scale bar: 120 μm (a,c,e,g,j); 30 μm (b,d,f,h,i,k,l). (b) Mean percentage of GABA-positive cells among ß-gal-positive cells for each ROI was calculated (n = 16, 4 animals × 4 sections). NA represents “not applicable”, because there is no ß-gal positive cell in Rt and 0 cannot be a denominator. (c) Mean percentage of ß-gal-positive cells among GABA-positive cells for each ROI was calculated (n = 16, 4 animals × 4 sections). We analyzed a total of 3340 (Ctx), 924 (Hip), 1779 (ZI), 6972 (Tha), 5228 (LA), and 976 (ITC) cells.
Figure 6
Figure 6. Ablation of netrin-G1 in inhibitory neurons.
(a) X-gal staining of coronal sections of Rosa-NLS-LacZ reporter mice crossed with the Vgat-Cre line. (b,c) Representative immunohistochemical images of netrin-G1 in control and Vgat-G1-cKO mice, respectively. No apparent difference was observed. (dg) Representative images of ISH of netrin-G1 from the control (d,f) and Vgat-G1-cKO (e,g) mice, respectively. (f,g) are magnified images of the areas marked with a square in (d,e), respectively. Note that in (f) the positive signal is sparsely distributed, and the signal is dramatically decreased in (g). Scale bar: 1 mm (a,d,e,j); 750 μm (b,c); 200 μm (f,g). (h) Percent time spent in the open and closed arms of the EPM. Both the control and Vgat-G1-cKO mice spent significantly greater amounts of time in the closed arms than in the open arms. Statistical analysis between percent time spent in the open arms and the closed arms was conducted using the unpaired two-tailed Student’s t test (n = 9 per genotype). Columns and bars represent the mean + SEM, respectively. ***p < 0.001. (i) Percent time exhibiting freezing behavior during fear conditioning (day1), context-dependent memory (day2) and cue-dependent memory (day3). Mean freezing duration was significantly reduced in Vgat-G1-cKO mice during all 3 stages. *p < 0.05 (n = 9 per genotype). Two-way ANOVA was conducted between time and genotype. Colored lines and bars represent the mean + SEM, respectively. (j) X-gal staining of coronal sections of Rosa-NLS-LacZ reporter mice crossed with the ZI-Cre line showing that Cre was mainly expressed in the reticular nucleus and zona incerta, with sparse expression in the striatum. (k) In the FC test, no significant effect of genotype on freezing behavior was detected between ZI-G1-cKO and control groups during the conditioning, and contextual and cued fear-related memory retrieval phases. Two-way ANOVA was conducted between time and genotype (n = 9 per genotype). Colored lines and bars represent the mean + SEM, respectively.

Similar articles

Cited by

References

    1. Sylvers P., Lilienfeld S. O. & LaPrairie J. L. Differences between trait fear and trait anxiety: implications for psychopathology. Clin Psychol Rev 31, 122–137 (2011). - PubMed
    1. Grupe D. W. & Nitschke J. B. Uncertainty and anticipation in anxiety: an integrated neurobiological and psychological perspective. Nat Rev Neurosci 14, 488–501 (2013). - PMC - PubMed
    1. Johansen J. P. Neuroscience: anxiety is the sum of its parts. Nature 496, 174–175 (2013). - PubMed
    1. Johansen J. P., Cain C. K., Ostroff L. E. & LeDoux J. E. Molecular mechanisms of fear learning and memory. Cell 147, 509–524, 10.1016/j.cell.2011.10.009 (2011). - DOI - PMC - PubMed
    1. Rodrigues S. M., Schafe G. E. & LeDoux J. E. Molecular mechanisms underlying emotional learning and memory in the lateral amygdala. Neuron 44, 75–91, 10.1016/j.neuron.2004.09.014 (2004). - DOI - PubMed

Publication types