. 2016 Jun 27:6:28710.
doi: 10.1038/srep28710.

Evidence of extensive non-allelic gene conversion among LTR elements in the human genome

Affiliations

Evidence of extensive non-allelic gene conversion among LTR elements in the human genome

Beniamino Trombetta et al. Sci Rep. .

Abstract

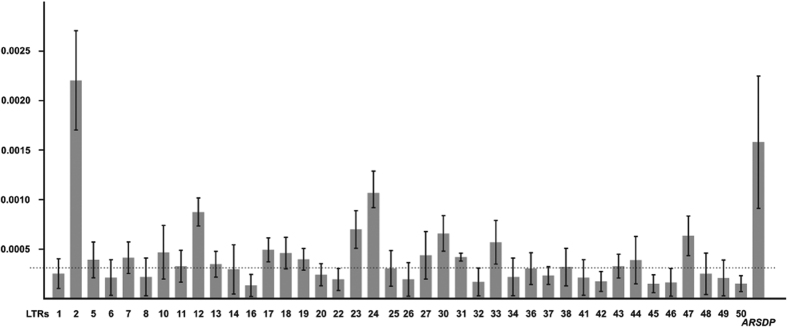
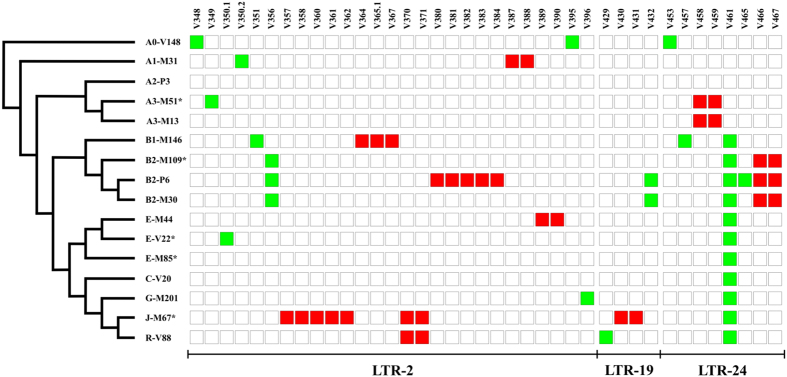
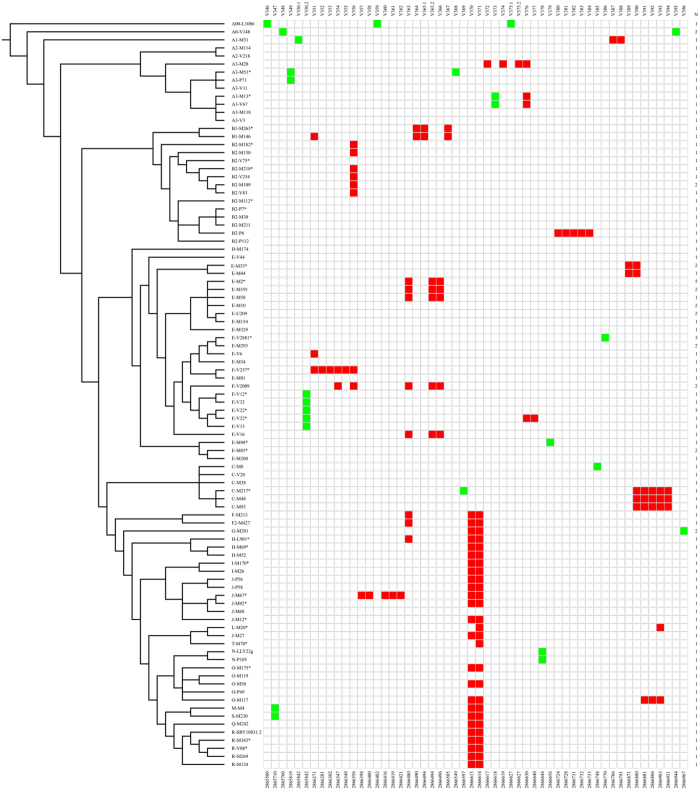
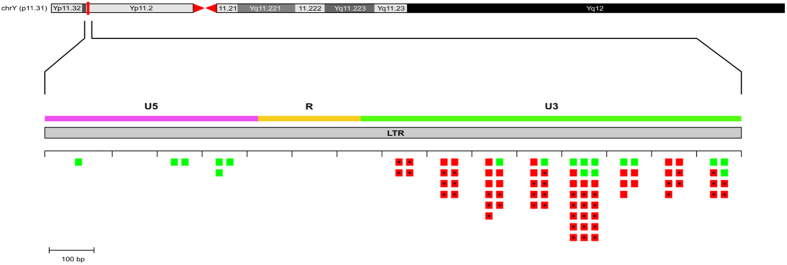
Long Terminal Repeats (LTRs) are nearly identical DNA sequences found at either end of Human Endogenous Retroviruses (HERVs). The high sequence similarity that exists among different LTRs suggests they could be substrate of ectopic gene conversion events. To understand the extent to which gene conversion occurs and to gain new insights into the evolutionary history of these elements in humans, we performed an intra-species phylogenetic study of 52 LTRs on different unrelated Y chromosomes. From this analysis, we obtained direct evidence that demonstrates the occurrence of ectopic gene conversion in several LTRs, with donor sequences located on both sex chromosomes and autosomes. We also found that some of these elements are characterized by an extremely high density of polymorphisms, showing one of the highest nucleotide diversities in the human genome, as well as a complex patchwork of sequences derived from different LTRs. Finally, we highlighted the limits of current short-read NGS studies in the analysis of genetic diversity of the LTRs in the human genome. In conclusion, our comparative re-sequencing analysis revealed that ectopic gene conversion is a common event in the evolution of LTR elements, suggesting complex genetic links among LTRs from different chromosomes.


Figures

Figure 1
Figure 1. Nucleotide diversity of the LTR elements analysed in the present study.
Only LTRs with π > 0 are shown. Dotted line represents the mean value of π. The π value of the ARSDP was calculated from data reported in Trombetta et al..
Figure 2
Figure 2. SNPs identified in three LTRs.
To the left, a simplified version of the Y-chromosome tree showing the phylogenetic relationships of the 16 sequenced chromosomes. LTRs without clusters of SNPs are not shown. The names of LTRs and SNPs are at the bottom and at the top, respectively. Square colours represent the allelic state for each SNP: White, ancestral allele; red, closely spaced derived SNPs arisen on the same branch of the Y phylogeny; green, «conventionally» derived SNPs.
Figure 3
Figure 3. SNPs identified in LTR 2.
To the left, a simplified version of the Y-chromosome tree showing the phylogenetic relationships of the Y chromosomes sequenced. The names and position of the SNPs are given at the top and at the bottom, respectively. Square colours represent the allelic state for each SNP: White, ancestral allele; red, closely spaced SNPs arisen on the same branch of the Y phylogeny; green, «conventional» SNPs. N represents the number of Y chromosomes sequenced for each of the haplogroups shown to the left; when N > 1, chromosomes belonging to different subhaplogroups were chosen.
Figure 4
Figure 4. Locations of observed mutational events in the LTR 2 element.
Each mutational event is represented by a square placed in the correct 100 bp segment of the element. Green square: conventional SNPs. Red square: clustered SNPs. Square with the dot represents recurrent mutational events. The boundaries of the functional domains of the element are approximate.
Figure 5
Figure 5. SNPs identified in LTR 24.
To the left, a simplified version of the Y-chromosome tree showing the phylogenetic relationships of the Y chromosomes sequenced. The names and positions of the nucleotides are given at the top and at the bottom, respectively. Square colours represent the allelic state for each SNP: White, ancestral allele; red, closely spaced SNPs arisen on the same branch of the Y phylogeny; green, «conventional» SNPs. N represents the number of Y chromosomes sequenced for each of the haplogroups shown to the left; when N > 1, chromosomes belonging to different subhaplogroups were chosen.

References

    1. Cordaux R. & Batzer M. A. The impact of retrotransposons on human genome evolution. Nat. Rev. Genet. 10, 691–703 (2009). - PMC - PubMed
    1. Kurth R. & Bannert N. Beneficial and detrimental effects of human endogenous retroviruses. Int. J. Cancer. 126, 306–314 (2010). - PubMed
    1. Feschotte C. & Gilbert C. Endogenous viruses: insights into viral evolution and impact on host biology. Nat. Rev. Genet. 13, 283–296 (2012). - PubMed
    1. Rebollo R. et al. Epigenetic interplay between mouse endogenous retroviruses and host genes. Genome Biol. 13, R89 (2012). - PMC - PubMed
    1. Stoye J. P. Studies of endogenous retroviruses reveal a continuing evolutionary saga. Nat. Rev. Microbiol. 10, 395–406 (2012). - PubMed

Publication types

LinkOut - more resources