. 2016 Jul 12;16(2):559-570.
doi: 10.1016/j.celrep.2016.05.091. Epub 2016 Jun 23.

5-Hydroxymethylcytosine Remodeling Precedes Lineage Specification during Differentiation of Human CD4(+) T Cells

Affiliations

5-Hydroxymethylcytosine Remodeling Precedes Lineage Specification during Differentiation of Human CD4(+) T Cells

Colm E Nestor et al. Cell Rep. .

Abstract

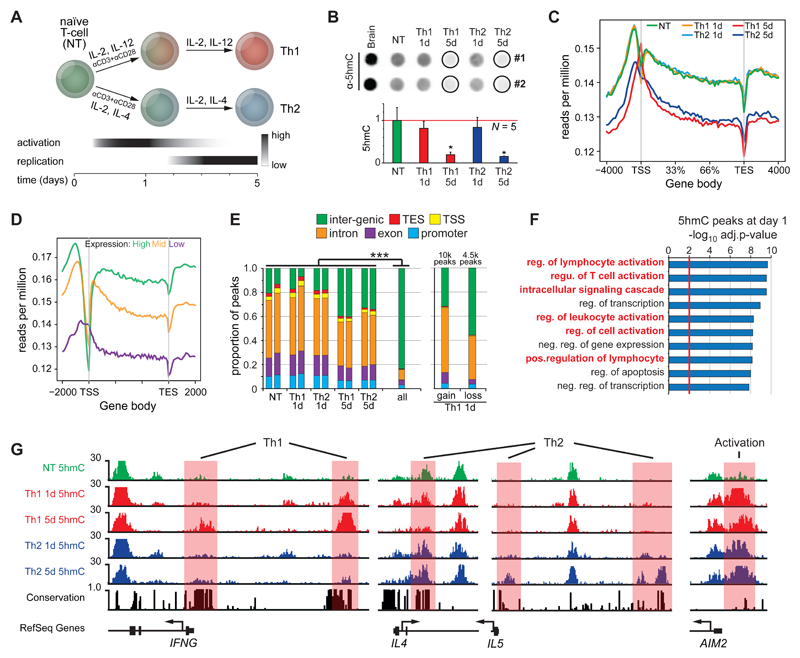
5-methylcytosine (5mC) is converted to 5-hydroxymethylcytosine (5hmC) by the TET family of enzymes as part of a recently discovered active DNA de-methylation pathway. 5hmC plays important roles in regulation of gene expression and differentiation and has been implicated in T cell malignancies and autoimmunity. Here, we report early and widespread 5mC/5hmC remodeling during human CD4(+) T cell differentiation ex vivo at genes and cell-specific enhancers with known T cell function. We observe similar DNA de-methylation in CD4(+) memory T cells in vivo, indicating that early remodeling events persist long term in differentiated cells. Underscoring their important function, 5hmC loci were highly enriched for genetic variants associated with T cell diseases and T-cell-specific chromosomal interactions. Extensive functional validation of 22 risk variants revealed potentially pathogenic mechanisms in diabetes and multiple sclerosis. Our results support 5hmC-mediated DNA de-methylation as a key component of CD4(+) T cell biology in humans, with important implications for gene regulation and lineage commitment.


Conflict of interest statement

The authors declare no conflicts of interest.

Figures

Figure 1
Figure 1. Dynamic remodeling of 5-hydroxymethylcytosine (5hmC) during in vitro polarization of human CD4+ T-cells.
(A) Schematic figure of experimental design for T-cell polarization. (B) Global 5hmC content measured by immuno-dot blot using a 5hmC antibody. Naïve T-cells (NT) were cultured under Th1 or Th2 polarizing conditions for up to 5 days. Brain is shown as a tissue with high 5hmC content. Data shown as mean ±SD, representative of 5 biological replicates. *p<0.05 Student’s t test. (C) Normalized 5hmC density profiles across gene body ± 4 kb flanking regions. (D) Normalized 5hmC density profiles across gene body ± 2 kb flanking regions in NT cells binned into three equal sized groups based on gene expression levels. (E) Genomic distribution of 5hmC peaks during T-cell differentiation in vitro. ***p<0.001 Fisher’s Exact test. (F) Gene ontology (GO) enrichment of 5hmC peaks in T-cells differentiated in vitro for 1 day. (G) Coverage plots of 5hmC levels at IFNG, IL4, IL5, AIM2 and IL23R loci showing subset specific changes. See also Figure S1
Figure 2
Figure 2. DNA de-methylation occurs via 5-hydroxymethylcytosine (5hmC) during in vitro differentiation of human CD4+ T-cells.
(A) Volcano plot showing changes in DNA methylation (5mC) during in vitro polarization of CD4+ T-cells relative to Naïve T-cells (NT). Vertical lines indicates a change of 20%. 5mC measured by 450K methylation array. (B) 5hmC regions show major loss of 5mC during T-cell polarization. Background represents a randomly sampled group with the same size of probes in 5hmC peaks. Fisher’s exact test was used to calculate significance (rightmost). (C) Line plot (top) showing regions getting hypomethylated typically gain 5hmC at day 1 of T cell polarization. Box plot (bottom) showing genes associated with regions becoming hypermethylated decrease in expression levels. ***p<0.001 one-way ANOVA Tukey’s test. (D) Coverage plot showing active enhancers (H3K4me1, H3K27ac) gaining 5hmC and losing 5mC during T-cell polarization. Representative loci of AIM2 and CCL5 shown. (E) Bar chart of 5mC changes in T-cell specific enhancer regions (H3K4me1, H3K27ac) show higher degree of remodeling in these regions compared to genome-wide. 5mC was measured by 450K methylation array. (F, G) Distribution of 5mC changes at T-cell specific enhancers (H3K4me1, H3K27ac) show an early loss of 5mC in these regions. See also Figure S2
Figure 3
Figure 3. Tight regulation of TET gene expression is required for appropriate T-cell differentiation
(A) Barplot of TET1 gene expression in healthy human primary tissues (pool of at least 5 individuals) and primary immune cell subsets analyzed by qPCR. NT: Naïve T-cell. (B, C) Barplots of TET gene expression measured by qPCR in Naïve T-cells (NT) cultured under Th1 or Th2 polarizing conditions. Expression levels shown relative to GUSB. Data shown as mean ±SD, representative of 3 biological replicates. *p<0.05, **p<0.01 Student’s t test. (D) Schematic figure of plasmids containing full length TET1 (TET1fl), catalytic domain of TET1 (TET1cd) and mutated catalytic domain of TET1 (TET1mut). (E, F) Barplots of gene expression for selected genes in NT cells transfected with TET1 plasmids then cultured under Th1 polarizing conditions for 24h. Lines indicate a log2 fold change of 0.5. Gene expression measured by microarray. See also Figure S3
Figure 4
Figure 4. Early DNA methylation remodeling persists in CD4+ memory T-cells in vivo.
(A) Barplot of TET gene expression in primary CD4+Naïve T-cells (NT), central memory (TCM) and effector memory (TEM) cells. Gene expression of TET1/2/3 was measured by qPCR. (B) Barplot of global 5hmC content measured by immuno-dot blot using a 5hmC antibody in primary NT, TCM and TEM cells. (C) Heatmap of gene expression in primary NT, TCM and TEM cells showing subset specific gene signatures. Gene expression measured by microarray. (D) Unsupervised hierarchical clustering of DNA methylation (5mC) in NT, TCM and TEM cells measured by 450K methylation array. Significance calculated by bootstrap resampling. (E) Volcano plot of 5mC changes in memory subsets showing a predominant loss in both TCM and TEM cells. Vertical lines indicate a change of 30%. (F) Correlation between 5mC and gene expression in TEM cells calculated using Spearman’s rank correlation coefficient. 5mC measured by 450k array and gene expression measured by microarray. (G) 5hmC regions show major loss of 5mC in TEM cells. Background represents a randomly sampled group with the same size of probes in 5hmC peaks. Significance calculated using Fisher’s exact test (rightmost). (H) Venn diagram of sites losing 5mC in TEM cells and after 5 days of polarization towards Th1 and Th2. Sites losing 5mC defined as a loss of 20% or 30% 5mC vs. NT for polarization and TEM, respectively, and p<0.05. P-value for overlaps calculated using Fisher exact test. (I) Coverage plot of 5mC in NT,TCM and TEM cells showing loss at representative loci marked by 5hmC during in vitro polarization of T-cells. ***p<0.001 Student’s t test. (A, B) Data shown as mean ±SD of at least 3 biological replicates. *p<0.05, **p<0.01, ***p<0.001, Student’s t test.
Figure 5
Figure 5. 5hmC regions are highly enriched for disease-associated variants.
(A) ChromHMM heatmap of enrichment and colocalization of 5hmC with other epigenetic marks in Naïve CD4+T-cells. (B) Enrichment of disease-associated variants in peaks gaining- (left) and losing 5hmc (right) after 1 day of CD4+T-cell polarization. (C) Venn diagram of disease-associated variant localization in 5hmC 1 day gain peaks and CD4+T-cell enhancers. (D, E) EMSA analysis of protein-DNA binding showing changes in binding upon introduction of disease-associated variants in 5hmC regions using nuclear protein extracts from Jurkat T-cell line (D) and primary CD4+T-cells (E). Dashed boxes indicate shifts in binding, arrows indicate shifts not observed in cell line. (F) Barplot of capture Hi-C (cHi-C) interactions overlapping variants in identified 5hmC regions or T-cell enhancers. Region sizes were normalized to avoid size bias and P-values calculated using bootstrap resampling n=10,000. (G) Genomic plot of variant rs7203150 located in identified 5hmC region showing interactions with nearby gene promoters (left). Heatmap of co-expression during T-cell polarization showing high degree of co-expression between genes interacting with variant rs7203150 (right). cHi-C: capture Hi-C. See also Figure S5

References

    1. Bernstein BE, Stamatoyannopoulos JA, Costello JF, Ren B, Milosavljevic A, Meissner A, Kellis M, Marra MA, Beaudet AL, Ecker JR, et al. The NIH Roadmap Epigenomics Mapping Consortium. Nature biotechnology. 2010;28:1045–1048. - PMC - PubMed
    1. Cartron PF, Nadaradjane A, Lepape F, Lalier L, Gardie B, Vallette FM. Identification of TET1 Partners That Control Its DNA-Demethylating Function. Genes & cancer. 2013;4:235–241. - PMC - PubMed
    1. Claussnitzer M, Dankel SN, Klocke B, Grallert H, Glunk V, Berulava T, Lee H, Oskolkov N, Fadista J, Ehlers K, et al. Leveraging cross-species transcription factor binding site patterns: from diabetes risk loci to disease mechanisms. Cell. 2014;156:343–358. - PMC - PubMed
    1. Davison LJ, Wallace C, Cooper JD, Cope NF, Wilson NK, Smyth DJ, Howson JM, Saleh N, Al-Jeffery A, Angus KL, et al. Long-range DNA looping and gene expression analyses identify DEXI as an autoimmune disease candidate gene. Human molecular genetics. 2012;21:322–333. - PMC - PubMed
    1. Delatte B, Deplus R, Fuks F. Playing TETris with DNA modifications. The EMBO journal. 2014;33:1198–1211. - PMC - PubMed