. 2016 Jul 12;16(2):487-497.
doi: 10.1016/j.celrep.2016.06.004. Epub 2016 Jun 23.

FOXR2 Interacts with MYC to Promote Its Transcriptional Activities and Tumorigenesis

Affiliations

FOXR2 Interacts with MYC to Promote Its Transcriptional Activities and Tumorigenesis

Xu Li et al. Cell Rep. .

Abstract

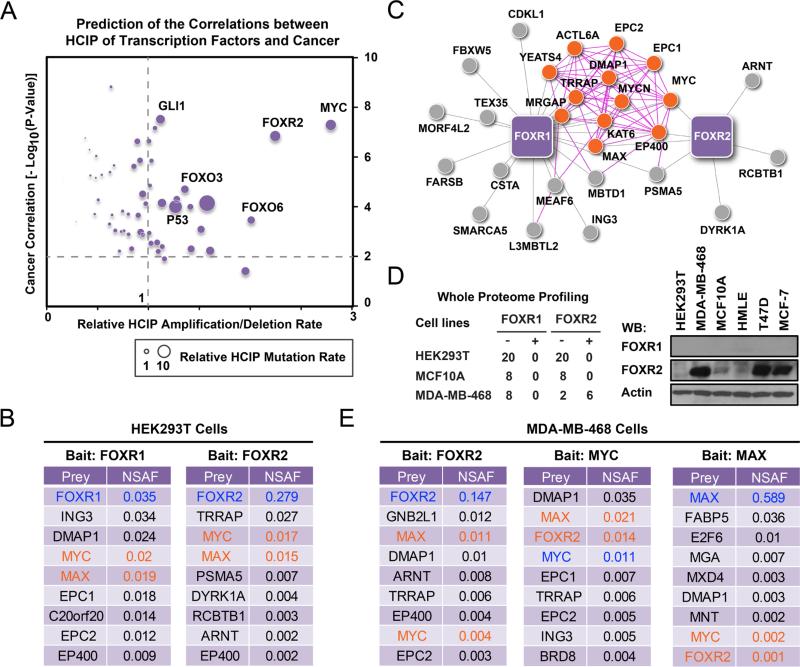
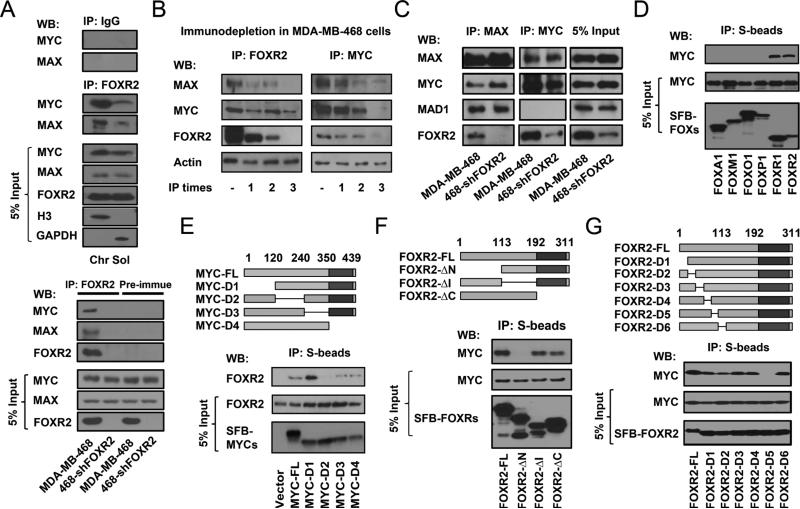
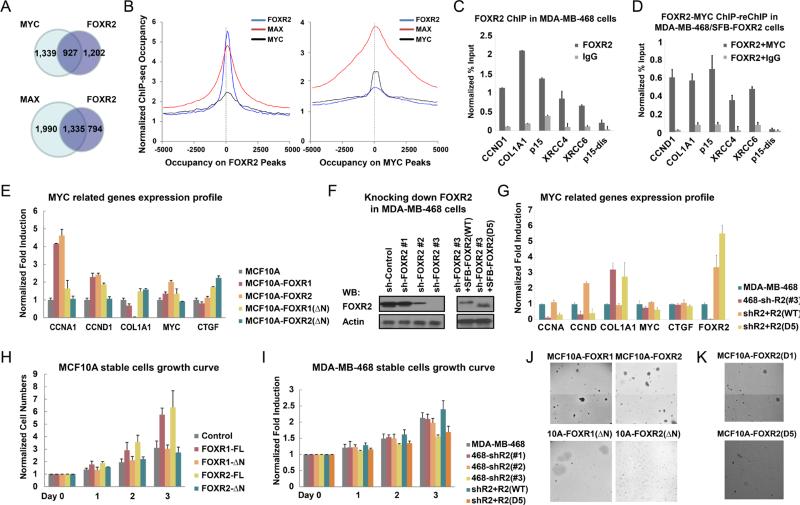
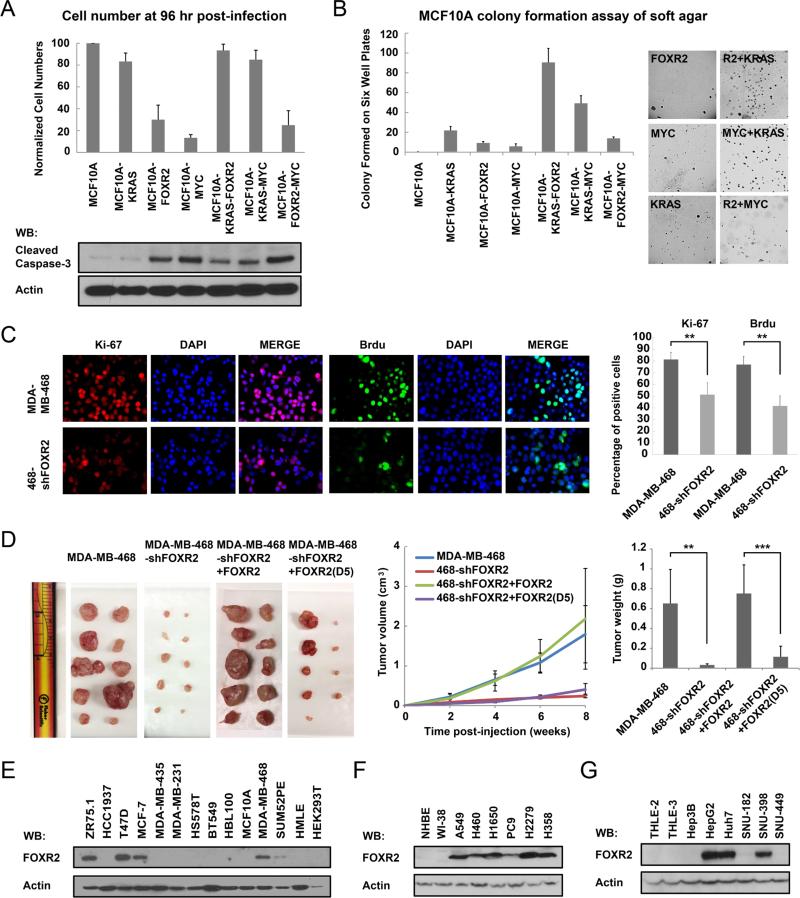
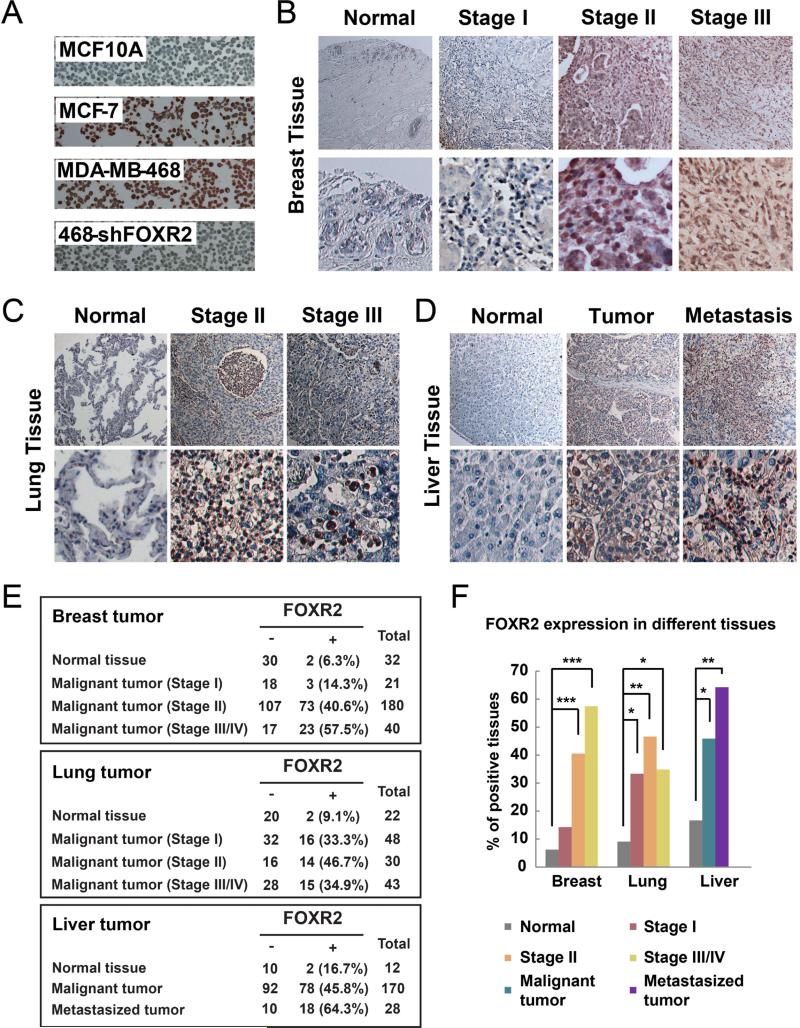
By combining the results of a large-scale proteomic analysis of the human transcription factor interaction network with knowledge databases, we identified FOXR2 as one of the top-ranked candidate proto-oncogenes. Here, we show that FOXR2 forms a stable complex with MYC and MAX and subsequently regulates cell proliferation by promoting MYC's transcriptional activities. We demonstrate that FOXR2 is highly expressed in several breast, lung, and liver cancer cell lines and related patient tumor samples, while reduction of FOXR2 expression in a xenograft model inhibits tumor growth. These results indicate that FOXR2 acts with MYC to promote cancer cell proliferation, which is a potential tumor-specific target for therapeutic intervention against MYC-driven cancers.

Keywords: FOXR2; MYC; forkhead box; protein-protein interaction.


Figures

Figure 1
Figure 1. FOXR2 forms a stable complex with MYC/MAX
(A) Prediction of transcription factors' involvement in tumorigenesis is based on their HCIPs identified by TAP-MS analysis. The cancer correlations were generated by searching the HCIP datasets of each transcription factors in the knowledge base to estimate the significance of these correlations. Transcription factor interactomes were searched for their alteration (numbers and rates) in multiple TCGA databases using their HCIP sets. X axis indicates the relative average expression alteration of indicated TF HCIP dataset in multiple TCGA databases. Y axis indicates cancer correlation for each transcription factor, estimated on the basis of their HCIPs identified in chromatin fractions. The size of each dot indicates the relative average mutation rate of TF HCIP dataset in multiple TCGA databases. (B) Top HCIPs of FOXR1 and FOXR2 in HEK293T cells are listed together with their NSAF values. Baits are highlighted in blue; MYC and MAX are highlighted in orange. (C) Schematic representation of FOXR1 and FOXR2 interactomes with top-ranked interacting proteins. The interaction networks were visualized using unweighted force-directed distributions. Purple lines indicate interactions defined by the literature. Grey lines indicate newly identified interactions on the basis of the results of our proteomic study. Orange dots indicate MYC-MAX complex members reported in the literature. (D) FOXR2 expression in HEK293T, MCF10A and MDA-MB-468 cells were evaluated using whole proteome profiling and WB analysis with antibodies against endogenous FOXR2. (E) TAP-MS was performed with MDA-MB-468 cells that stably expressed SFB-tagged FOXR2, MYC, or MAX. Top-ranked interacting proteins are listed together with their NSAF values. Baits are highlighted in blue; prey FOXR2, MYC, and MAX are highlighted in orange. (B and E) All the data listed here are statistical significant.
Figure 2
Figure 2. FOXR2 associates with MYC/MAX on chromatin through its N-terminal region
(A) Upper panel: Co-IP of endogenous MAX or MYC with FOXR2 was performed with IgG or anti-FOXR2 antibody using soluble and chromatin fractions prepared from MDA-MB-468 cells. 5% of the corresponding cell lysate used in the IP was included as input control. Immunoblotting was conducted using the indicated antibodies. Lower panel: Co-IP of endogenous MAX or MYC with FOXR2 was performed with anti-FOXR2 antibody or pre-immune serum from the same mouse, using chromatin fractions prepared from MDA-MB-468 and MDA-MB-468/sh-FOXR2 cells. (B) Immunodepletion of FOXR2 and MYC performed using extracts prepared from MDA-MB-468 cells. MDA-MB-468 cell lysates were immunoprecipitated with FOXR2 or MYC antibodies three times. FOXR2, MYC, MAX, and β-actin levels were measured after each round. (C) Cell lysates of MDA-MB-468 and MDA-MB-468/sh-FOXR2 cells were immunoprecipitated with MYC or MAX antibodies and immunoblotted with the indicated antibodies. (D) HEK293T cells were transfected with constructs encoding the indicated FOX proteins. Co-IP experiments were performed using S-protein beads and blotted with antibodies recognizing the Flag-epitope tag or endogenous MYC. 5% of the corresponding cell lysate used in the IP was included as input control. Only FOXR1 and FOXR2 were able to pull down endogenous MYC. (E) Schematic diagram of MYC mutants is shown. The bHLH domain is depicted as dark grey. The mutants were: D1: (Δ1-120); D2: (Δ120-240); D3: (Δ240-350); D4: (Δ350-439). SFB-tagged wild-type and mutants of MYC were subjected to co-precipitation experiments with endogenous FOXR2 in MDA-MB-468 cells. 5% of the corresponding cell lysate used in the IP was included as input control. (F, G) Schematic diagram of FOXR2 mutants is shown. The FOX domain appears as dark grey. The mutants were: ΔN: (Δ1-113); ΔI: (Δ113-192); ΔC: (Δ192-311); D1: (Δ1-20); D2: (Δ20-40); D3: (Δ40-60); D4: (Δ60-80); D5: (Δ80-100); D6: (Δ100-113). SFB-tagged wild-type and mutants of FOXR2 were subjected to co-precipitation experiments with endogenous MYC in HEK293T cells. 5% of the corresponding cell lysate used in the IP was included as input control.
Figure 3
Figure 3. FOXR2 promotes MYC transcriptional activities and cell proliferation
(A) Chromatin IP-sequencing (ChIP-seq) assay was performed in MDA-MB-468 cells using endogenous antibodies against FOXR2, MYC or MAX. Overlap between FOXR2 and MAX or MYC target genes were evaluated. (B) The global analyses of relative peak positions of FOXR2 and MYC or MAX were shown. (C) A chromatin IP (ChIP) assay was performed in MDA-MB-468 cells using FOXR2 antibody or control IgG. The recovery of MYC downstream gene promoter regions was examined by real-time PCR. All the promoters except the control p15-distal promoter have significantly enriched in the FOXR2 (P < 0.001) but not IgG immunoprecipitants. (D) A ChIP-reChIP assay was performed in MDA-MB-468 cells overexpressing SFB-tagged FOXR2 using streptavidin-beads, eluted with biotin and re-IPed with MYC-antibody or control IgG. The recovery of MYC downstream gene promoter regions was examined by real-time PCR. All the promoters except the control p15-distal promoter have significantly enriched in the MYC (P < 0.001) but not IgG immunoprecipitants. (E) MYC target gene expression profiles were evaluated by RT PCR in MCF10A, MCF10A-FOXR1, -R2, -R1 (ΔN), and -R2 (ΔN) cells. mRNA levels were determined by real-time RT-PCR and normalized with GAPDH. CCNA, CCND1 (P < 0.01) and COL1A1 (P < 0.05) expression levels have been significantly changed in MCF10A-FOXR1/R2 cells comparing with MCF10A cells. (F) Knocking down FOXR2 in MDA-MB-468 cells and reconstitution with wild-type or D5 mutant of FOXR2 were confirmed by immunoblotting, as indicated. (G) MYC target gene expression profiles were evaluated by RT PCR in MDA-MB-468, MDA-MB-468-shFOXR2, MDA-MB-468-shFOXR2+SFB-FOXR2 and MDA-MB-468-shFOXR2+SFB-FOXR2(D5) cells. mRNA levels were determined by real-time RT-PCR and normalized with GAPDH. CCNA, CCND1 and COL1A1 expression levels have been significantly changed in MDA-MB-468-shFOXR2 and MDA-MB-468-shFOXR2+SFB-FOXR2(D5) cells (P < 0.01), comparing with MDAMB-468 cells. (H) Growth curve of MCF10A derivative cells used in (C). MCF10A-FOXR1/R2 cells have significantly more cell numbers after 3 days (P < 0.01), comparing with MCF10A cells. Data are averages (± SD) of three independent experiments. (I) Growth curves of MDA-MB-468 parental and derivative cells used in (E) are shown. MDA-MB-468-shFOXR2 and MDA-MB-468-shFOXR2+SFB-FOXR2(D5) cells have significantly less cell numbers after 3 days (P < 0.01), comparing with MDA-MB-468 cells. (J, K) Soft agar colony formation of MCF10A cells that stably expressed indicated proteins was assessed and is presented. Colony numbers: MCF10A-FOXR1: 12.4 ± 2.2; MCF10A-FOXR1(ΔN): 1.4 ± 1.3; MCF10A-FOXR2: 14.2 ± 2.4; MCF10A-FOXR2(ΔN): 0.8 ± 0.8; MCF10A-FOXR2(D1): 9.7 ± 1.8; MCF10A-FOXR2(D5): 2.8 ± 1.9. The P < 0.001 between MCF10A-FOXR1 and MCF10A-FOXR1(ΔN); MCF10A-FOXR2 and MCF10A-FOXR2(ΔN); MCF10A-FOXR2(D1) and MCF10AFOXR1(D5).
Figure 4
Figure 4. FOXR2 facilitates MYC's activities and promotes tumor proliferation both in vitro and in vivo
(A) MCF10A cells were infected in six-well plates with retroviruses encoding RAS, MYC, FOXR2, or any two together. Cells were counted after 96 hours of infection. Normalized cell numbers are presented. Data are averages (± SD) of three independent experiments. Cell lysates of each cell lines were immunoblotted with the indicated antibodies. (B) Soft agar colony formation of MCF10A cells that stably expressed the indicated proteins was assessed and is presented. (C) Ki-67 and BrdU staining of MDA-MB-468 and MDA-MB-468/sh-FOXR2 cells was performed as indicated. The percentages of positive cells are summarized on the right. **P < 0.01. (D) Xenograft tumor growth studies. 5 × 10⁶ MDA-MB-468 and MDA-MB-468/sh-FOXR2 cells were resuspended in 100 μL of Matrigel diluted with PBS at 1:1 ratio and injected subcutaneously into left and right flanks of 10 anesthetized 6- to 8-week-old female BALB/c nude mice respectively. 5 × 10⁶ MDA-MB-468/sh-FOXR2+SFB-FOXR2 and MDAMB-468/sh-FOXR2+SFB-FOXR2(D5) cells were resuspended in 100 μL of Matrigel diluted with PBS at 1:1 ratio and injected subcutaneously into left and right flanks of 10 anesthetized 6- to 8-week-old female BALB/c nude mice respectively. Starting from the day 0, the tumor weight and size were measured bi-weekly. Mice were euthanized after 8 weeks of injection. The tumors were excised, photographed, and weighed. *** P < 0.001. (E) Immunoblotting of FOXR2 in normal and breast cancer cell lines, with HEK293T cells as the negative control. (F) Immunoblotting of FOXR2 in normal and lung cancer cell lines. (F) Immunoblotting of FOXR2 in normal and liver cancer cell lines.
Figure 5
Figure 5. FOXR2 is overexpressed in cancers
(A) Immunohistochemical staining of breast cell lines was performed using FOXR2 antibody to validate the specificity of our anti-FOXR2 antibody. (B-E) FOXR2 staining of normal and tumor tissue microarrays of breast (B), lung (C), and liver (D) samples. The data were summarized in (E), with case numbers and percentages. (F) Bar graph summary of data presented in (B-E). *P < 0.05, **P < 0.01, ***P < 0.001.

References

    1. Amati B, Brooks MW, Levy N, Littlewood TD, Evan GI, Land H. Oncogenic activity of the c-Myc protein requires dimerization with Max. Cell. 1993;72:233–245. - PubMed
    1. Askew DS, Ashmun RA, Simmons BC, Cleveland JL. Constitutive c-myc expression in an IL-3-dependent myeloid cell line suppresses cell cycle arrest and accelerates apoptosis. Oncogene. 1991;6:1915–1922. - PubMed
    1. Bader GD, Betel D, Hogue CW. BIND: the Biomolecular Interaction Network Database. Nucleic Acids Res. 2003;31:248–250. - PMC - PubMed
    1. Barrett T, Wilhite SE, Ledoux P, Evangelista C, Kim IF, Tomashevsky M, Marshall KA, Phillippy KH, Sherman PM, Holko M, et al. NCBI GEO: archive for functional genomics data sets--update. Nucleic Acids Res. 2013;41:D991–995. - PMC - PubMed
    1. Beroukhim R, Mermel CH, Porter D, Wei G, Raychaudhuri S, Donovan J, Barretina J, Boehm JS, Dobson J, Urashima M, et al. The landscape of somatic copy-number alteration across human cancers. Nature. 2010;463:899–905. - PMC - PubMed

MeSH terms

Substances