. 2016 Jul 7;99(1):139-53.
doi: 10.1016/j.ajhg.2016.05.013. Epub 2016 Jun 23.

Contrasting the Genetic Architecture of 30 Complex Traits from Summary Association Data

Affiliations

Contrasting the Genetic Architecture of 30 Complex Traits from Summary Association Data

Huwenbo Shi et al. Am J Hum Genet. .

Abstract

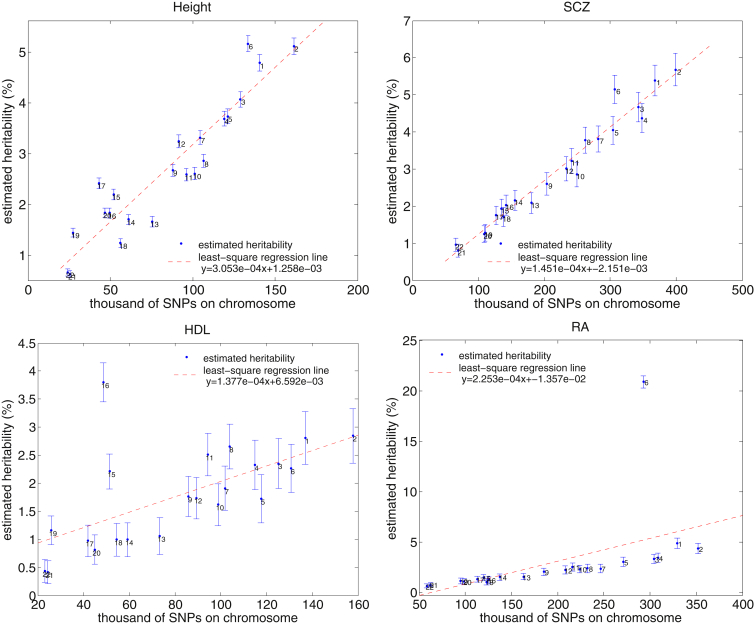
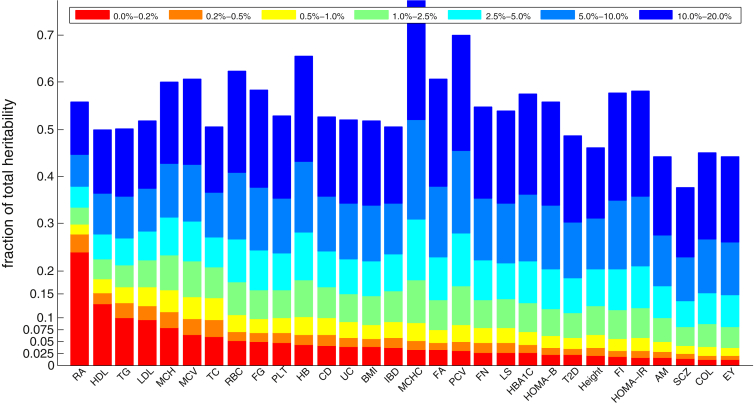
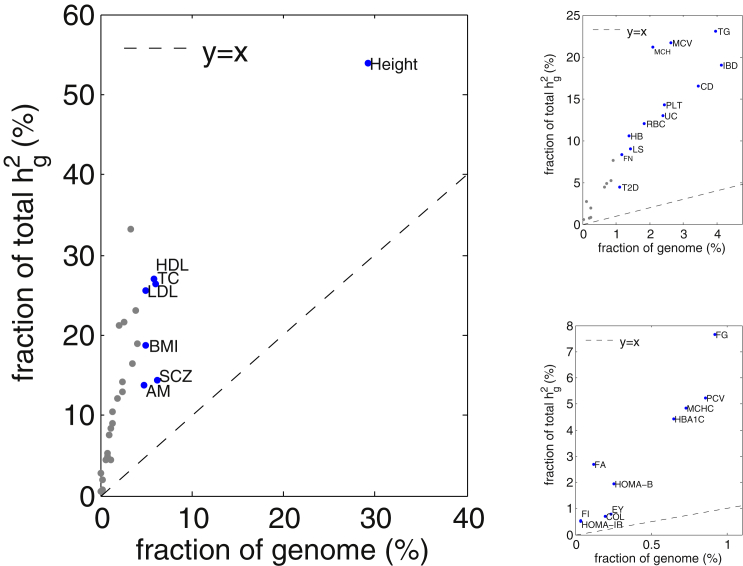
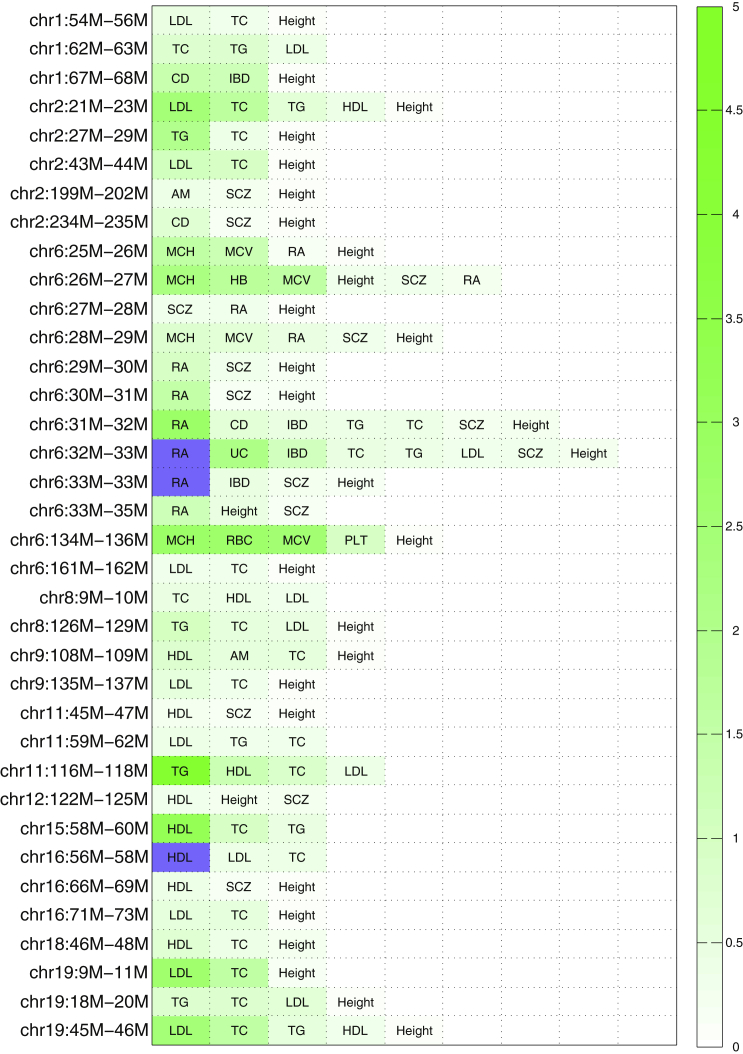
Variance-component methods that estimate the aggregate contribution of large sets of variants to the heritability of complex traits have yielded important insights into the genetic architecture of common diseases. Here, we introduce methods that estimate the total trait variance explained by the typed variants at a single locus in the genome (local SNP heritability) from genome-wide association study (GWAS) summary data while accounting for linkage disequilibrium among variants. We applied our estimator to ultra-large-scale GWAS summary data of 30 common traits and diseases to gain insights into their local genetic architecture. First, we found that common SNPs have a high contribution to the heritability of all studied traits. Second, we identified traits for which the majority of the SNP heritability can be confined to a small percentage of the genome. Third, we identified GWAS risk loci where the entire locus explains significantly more variance in the trait than the GWAS reported variants. Finally, we identified loci that explain a significant amount of heritability across multiple traits.


Figures

Figure 1
Figure 1
Estimates of Total SNP Heritability in the Whole-Chromosome Simulation for Different Numbers of Eigenvectors Included We saw a slight downward bias when the number of eigenvectors, k, was small (e.g., k = 30) and an upward bias when k was large (e.g., k = 60). When k = 50, we attained an approximately unbiased estimate of total SNP heritability. Error bars represent twice the SE.
Figure 2
Figure 2
HESS Provides Superior Accuracy over LDSC in Estimating Local Heritability HESS attains unbiased estimates when in-sample LD is used (top) and approximately unbiased estimates when reference LD is used (bottom). The mean and SE in these figures were computed on the basis of 500 simulations, each involving 50,000 simulated GWAS datasets. Error bars represent twice the SE.
Figure 3
Figure 3
Manhattan-Style Plots of Regional Heritability across the Genome for the Traits Height, HDL, and SCZ See Figures S16 and S17 for results across all traits.
Figure 4
Figure 4
Fraction of hg2 per Chromosome across the 30 Traits Studied Here, we obtained the chromosomal heritability by summing local heritability at loci within the chromosome. For each chromosome, we plot the box plots of estimates at the 30 considered traits. Chromosomes are ordered by size. With some notable exceptions, all traits show a strong polygenic signature of genetic architecture.
Figure 5
Figure 5
Heritability Attributable to Each Chromosome for Four Example Traits We obtained the chromosomal heritability by summing local heritability at loci within the chromosome. We obtained SE by taking the square root of the sum of variance estimation. See Figures S13–S15 for results across all traits. Error bars represent twice the SE.
Figure 6
Figure 6
Stacked Bar Plot Showing the Percentage of Total Heritability Attributable to Different Fractions of the Genome We rank ordered all genomic loci by their explained heritability and quantified the fraction of total heritability attributable to different percentile ranges. Traits with high polygenicity (e.g., height and SCZ) tend to have bars with a height proportional to bin size, whereas less polygenic traits (e.g., RA and HDL) tend to have bars much larger than bin size.
Figure 7
Figure 7
Fraction of hg2 Explained by All Loci Containing a GWAS Hit versus the Fraction of Genome Covered by These Loci Images on the right focus successively on the traits near the bottom left.
Figure 8
Figure 8
Heatmap Showing the Fraction of Total SNP Heritability, hg2, Contributed by Each of the 36 “Pleiotropic” Loci For each locus, we only display traits to which the locus contributes a significant amount of heritability. We mark traits to which the locus contributes more than 5% of the total SNP heritability in dark blue.

Similar articles

Cited by

References

    1. Locke A.E., Kahali B., Berndt S.I., Justice A.E., Pers T.H., Day F.R., Powell C., Vedantam S., Buchkovich M.L., Yang J., LifeLines Cohort Study. ADIPOGen Consortium. AGEN-BMI Working Group. CARDIOGRAMplusC4D Consortium. CKDGen Consortium. GLGC. ICBP. MAGIC Investigators. MuTHER Consortium. MIGen Consortium. PAGE Consortium. ReproGen Consortium. GENIE Consortium. International Endogene Consortium Genetic studies of body mass index yield new insights for obesity biology. Nature. 2015;518:197–206. - PMC - PubMed
    1. Wood A.R., Esko T., Yang J., Vedantam S., Pers T.H., Gustafsson S., Chu A.Y., Estrada K., Luan J., Kutalik Z., Electronic Medical Records and Genomics (eMEMERGEGE) Consortium. MIGen Consortium. PAGEGE Consortium. LifeLines Cohort Study Defining the role of common variation in the genomic and biological architecture of adult human height. Nat. Genet. 2014;46:1173–1186. - PMC - PubMed
    1. Willer C.J., Schmidt E.M., Sengupta S., Peloso G.M., Gustafsson S., Kanoni S., Ganna A., Chen J., Buchkovich M.L., Mora S., Global Lipids Genetics Consortium Discovery and refinement of loci associated with lipid levels. Nat. Genet. 2013;45:1274–1283. - PMC - PubMed
    1. Welter D., MacArthur J., Morales J., Burdett T., Hall P., Junkins H., Klemm A., Flicek P., Manolio T., Hindorff L., Parkinson H. The NHGRI GWAS Catalog, a curated resource of SNP-trait associations. Nucleic Acids Res. 2014;42(Database issue, D1):D1001–D1006. - PMC - PubMed
    1. Yang J., Benyamin B., McEvoy B.P., Gordon S., Henders A.K., Nyholt D.R., Madden P.A., Heath A.C., Martin N.G., Montgomery G.W. Common SNPs explain a large proportion of the heritability for human height. Nat. Genet. 2010;42:565–569. - PMC - PubMed

MeSH terms