

Partitional Classification: A Complement to Phylogeny
- PMID: 27346943
- PMCID: PMC4912232
- DOI: 10.4137/EBO.S38288
Partitional Classification: A Complement to Phylogeny
Abstract
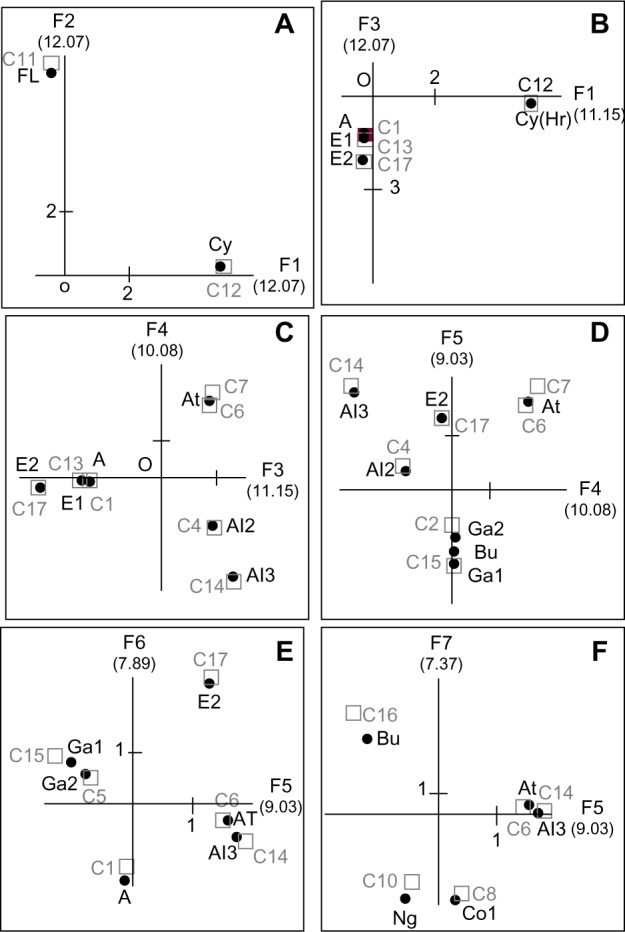
The tree of life is currently an active object of research, though next to vertical gene transmission non vertical gene transfers proved to play a significant role in the evolutionary process. To overcome this difficulty, trees of life are now constructed from genes hypothesized vital, on the assumption that these are all transmitted vertically. This view has been challenged. As a frame for this discussion, we developed a partitional taxonomical system clustering taxa at a high taxonomical rank. Our analysis (1) selects RNase P RNA sequences of bacterial, archaeal, and eucaryal genera from genetic databases, (2) submits the sequences, aligned, to k-medoid analysis to obtain clusters, (3) establishes the correspondence between clusters and taxa, (4) constructs from the taxa a new type of taxon, the genetic community (GC), and (5) classifies the GCs: Archaea-Eukaryotes contrastingly different from the six others, all bacterial. The GCs would be the broadest frame to carry out the phylogenies.
Keywords: RNase P RNA; bioinformatics; classification; cluster analysis; evolution; k-medoid analysis.
Figures

References
-
- Everitt BS, Landau S, Leese M. Cluster Analysis. London: Wiley; 2001.
-
- Gan G, Chaoqun M, Wu J. Data Clustering: Theory, Algorithms and Applications; 20 of Series on Statistics and Applied Probability. Philadelphia, PA; Alexandria, VA: Siam Press; 2007.
-
- Edwards AWF, Cavalli-Sforza LL. A method for cluster analysis. Biometrics. 1965;21:362–75. - PubMed
-
- Gower JC. A comparison of some methods of cluster analysis. Biometrics. 1967;23:623–37. - PubMed
LinkOut - more resources
Full Text Sources
Other Literature Sources
Research Materials
Miscellaneous
