. 2016 Aug;34(8):857-62.
doi: 10.1038/nbt.3594. Epub 2016 Jun 27.

Wide field-of-view, multi-region, two-photon imaging of neuronal activity in the mammalian brain

Affiliations

Wide field-of-view, multi-region, two-photon imaging of neuronal activity in the mammalian brain

Jeffrey N Stirman et al. Nat Biotechnol. 2016 Aug.

Abstract

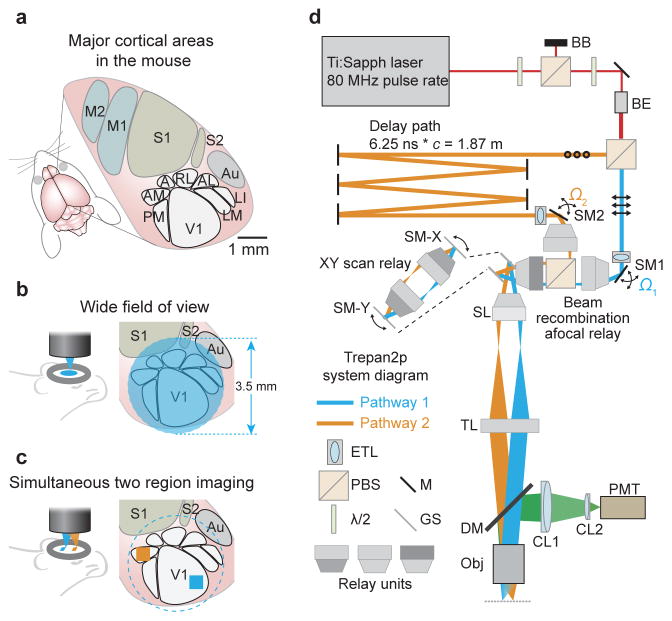
Two-photon calcium imaging provides an optical readout of neuronal activity in populations of neurons with subcellular resolution. However, conventional two-photon imaging systems are limited in their field of view to ∼1 mm(2), precluding the visualization of multiple cortical areas simultaneously. Here, we demonstrate a two-photon microscope with an expanded field of view (>9.5 mm(2)) for rapidly reconfigurable simultaneous scanning of widely separated populations of neurons. We custom designed and assembled an optimized scan engine, objective, and two independently positionable, temporally multiplexed excitation pathways. We used this new microscope to measure activity correlations between two cortical visual areas in mice during visual processing.


Conflict of interest statement

COMPETING FINANCIAL INTERESTS

The authors declare no competing interests.

Figures

Figure 1
Figure 1. Treapn2p system layout
(a) In the mouse, primary visual cortex (V1) is surrounded by higher visual areas (HVAs; PM = posteromedial; AM = anteromedial; A = anterior; RL = rostrolateral; AL = anterolateral; LM = lateromedial; LI = laterointermediate), which are distributed across several millimeters of cortex (M1,M2 = primary and secondary motor cortex; S1,S2 = primary and secondary somatosensory cortex; Au = auditory cortex). A wide field of view (FOV) is required to image neuronal activity in these distributed cortical areas simultaneously. (b) The 3.5 mm FOV can encompass V1 and HVAs. (c) The individual imaging regions can be independently positioned and repositioned anywhere within the full FOV by the steering mirrors (SM1, SM2 in d) for XY position, and the tunable lenses (ETL in d) for independent Z positioning. (d) Two imaging beams are temporally multiplexed and independently positioned in XY and Z prior to the scan mirrors (SM-X, SM-Y). First, overall power is attenuated using a half-wave plate (λ/2), a polarizing beam splitting cube (PBS) and a beam block (BB). After a second λ/2 (used to determine the power ratio sent to the two pathways) and a beam expander (BE), a second PBS divides the beam into two pathways. Pathway 1 (in blue, p-polarization, indicated by the arrows) passes directly to a motorized steering mirror (SM1) for positioning in XY. Pathway 2 (in orange, s-polarization, indicated by the circles) passes to a delay arm where it travels 1.87 meters further than pathway 1 using mirrors (M), thus delaying it by 6.25 ns before being directed to SM2. Directly prior to SM1 and SM2 are electrically tunable lenses (ETL) that can adjust the Z position (focal plane) of the pathways independently. The two pathways are recombined (beam recombination relay), and sent to X and Y galvanometer scanners (GS) that are connected by an afocal relay (expanded view inset). A scan lens (SL) and tube lens (TL) focuses the two multiplexed beams onto the back aperture of the objective (Obj). Fluorescence is directed to a photomultiplier tube (PMT) via an infrared-passing dichroic mirror (DM) and two collection lenses (CL1, CL2).
Figure 2
Figure 2. Focal excitation PSF profile of the Trepan2p system
(a) 0.2 μm fluorescent beads were embedded in 0.75% agarose gel. 50 μm z-stacks were acquired, each centered at one of three depths (55 μm, 275 μm, 550 μm). This was done on axis, and at the edges of the 3.5 mm field of view. (b,c) Radial and axial excitation PSF measurements were made at the indicated locations and depths by fitting a Gaussian curve to the intensity profiles of the beads in the XY plane (measured in both the X and Y directions and averaged) and in the Z direction (measured in Z in both the XZ and YZ planes and averaged). (d) A summary of the excitation PSF measurements at three depths, for three locations, and for both of the temporally multiplexed beam pathways are shown (full width at half maximum of the Gaussian fits +/− the standard deviation for measurements from 8 different beads). The excitation PSF typically increases in axial extent with imaging depth beyond the optimized focal plane (275 μm), but the optimized aberration correction and moderate NA combine to largely mitigate that effect and preserves the excitation PSF across the full field and hundreds of microns of imaging depth.
Figure 3
Figure 3. Two-photon imaging of neural activity across 9.6 mm2 of mouse cortex with single neuron resolution
(a) The wide FOV provides optical access to thousands of neurons and multiple cortical areas. (b) A transgenic mouse expressing the genetically encoded fluorescent calcium indicator GCaMP6s in excitatory neurons was used to examine neuronal activity (maximum projection). Prior to 2p imaging, intrinsic signal optical imaging was used to map out the higher visual areas (yellow outlines). The expanded inlays (white) show cellular resolution is preserved across the FOV (also see Supplementary Figure 12 and Supplementary Video 3). (c) Segmenting the image sequence yields 5,361 active neurons, (d) whose visually-evoked responses were recorded, and (e) revealing clear fluorescence transients (traces for the first 50 neurons in panel d). Imaging depth was 265 μm. The animal was shown the naturalistic movie during these recordings.
Figure 4
Figure 4. Temporally multiplexed, independently repositionable imaging pathways for simultaneous scanning two regions
(a) The individual imaging regions can be independently positioned and repositioned anywhere within the full FOV. (b) Within the same session, without moving the mouse or the microscope, the two pathways were moved to various configurations (left) to image neuronal activity (3.8 frames/s per region) (left, segmented active ROIs within the 500 μm imaging region; right, five example traces from each region). (c) There is no lower limit to the XYZ separation between imaging pathways (from the mechanical point-of-view). In this imaging session (9.5 frames/s per region), the XY locations were identical and the pathways only differed in the Z depth (left, segmented active ROIs within the 500 μm imaging region; right, five example traces from each region; Supplementary Video 5). (d, e) By combing temporal multiplexing (Pathways 1 and 2) with serially changing the offset voltage on the galvanometer scanner, four regions can be rapidly imaged (10 frames/s per region). (d) Pathway 1 and 2 are positioned at the same XY location and offset in Z. The galvanometers serially position the imaging region (of each pathway) anywhere within the larger field of view (left, segmented active ROIs within the 400 μm imaging region; right, five example traces from each region; Supplementary Video 6) (e) Pathway 1 and 2 are positioned at different XY locations as well as offset in Z. The galvanometers serially position the imaging region (of each pathway) anywhere within the larger field of view (left, segmented active ROIs within the 400 μm imaging region; right, five example traces from each region). (f) Resonant scanning was performed for faster frame rates (30 frames/s per region) (left, segmented active ROIs within the 500 μm imaging region; right, six example traces from each region; Supplementary Video 7). (g) Neuronal activity was imaged in two regions (20 frames/s per region), V1 and in an ROI encompassing retinotopically matched regions of AM and PM, simultaneously. Visual stimuli, either drifting gratings or a naturalistic movie, were used to evoke responses (left, segmented active ROIs within the 400 μm imaging region; right, five example traces from each region and for each visual stimulus). (h) Ca2+ signals were used to infer spike times and examine correlations. Activity correlations were measured between pairs of cells, each pair consisting of a V1 neuron and a neuron in AM or PM. These correlations were higher during presentation of the naturalistic movie compared to those during the drifting gratings (cross correlation with gratings, mean ± SEM: 0.0157 ± 0.0003; with naturalistic movie: 0.0218 ± 0.0003; N = 12,160 neuron pairs; P < 10–10; rank-sum test). The neurons on both axes were ordered from low to high average correlation for presentation clarity on the left (naturalistic movie), and the same ordering is used on the right (gratings). Imaging depth for both pathways was 235 μm. For all panels the vertical scale bar is 200% ΔF/F and the horizontal scale bar is 10 s. All imaging depths are indicated in the panels. The depth offset in Pathway 2 (orange) was accomplished using the tunable lens.

References

    1. Denk W, Strickler JH, Webb WW. Two-photon laser scanning fluorescence microscopy. Science. 1990;248:73–6. - PubMed
    1. Stosiek C, Garaschuk O, Holthoff K, Konnerth A. In vivo two-photon calcium imaging of neuronal networks. Proc Natl Acad Sci U S A. 2003;100:7319–24. - PMC - PubMed
    1. Chen TW, et al. Ultrasensitive fluorescent proteins for imaging neuronal activity. Nature. 2013;499:295–300. - PMC - PubMed
    1. Theer P, Denk W. On the fundamental imaging-depth limit in two-photon microscopy. J Opt Soc Am A Opt Image Sci Vis. 2006;23:3139–49. - PubMed
    1. Ohki K, Chung S, Ch’ng YH, Kara P, Reid RC. Functional imaging with cellular resolution reveals precise micro-architecture in visual cortex. Nature. 2005;433:597–603. - PubMed

Publication types

MeSH terms