. 2016 Aug;19(8):1025-33.
doi: 10.1038/nn.4335. Epub 2016 Jun 27.

Segregated cholinergic transmission modulates dopamine neurons integrated in distinct functional circuits

Affiliations

Segregated cholinergic transmission modulates dopamine neurons integrated in distinct functional circuits

Daniel Dautan et al. Nat Neurosci. 2016 Aug.

Abstract

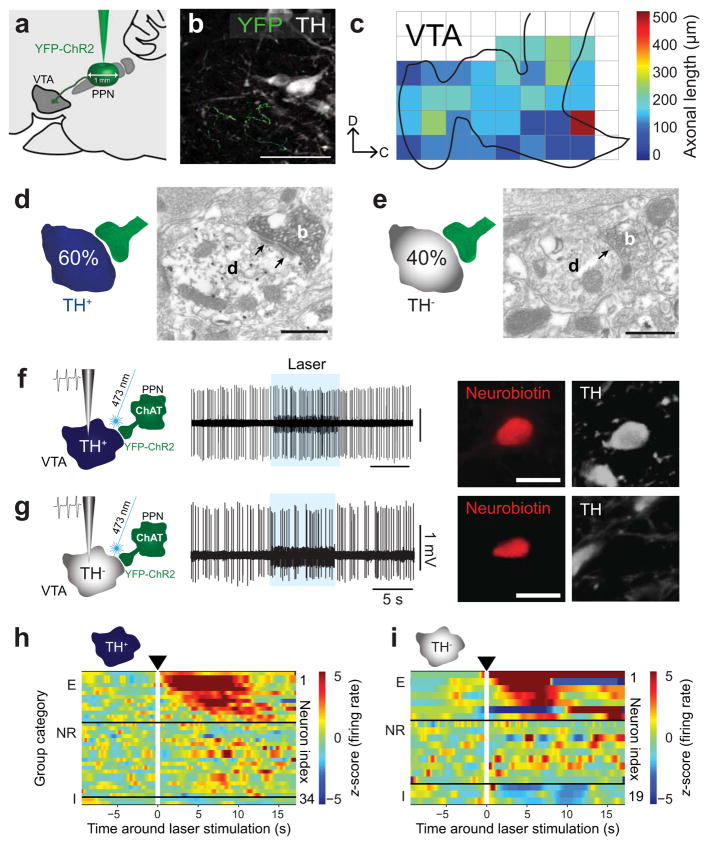
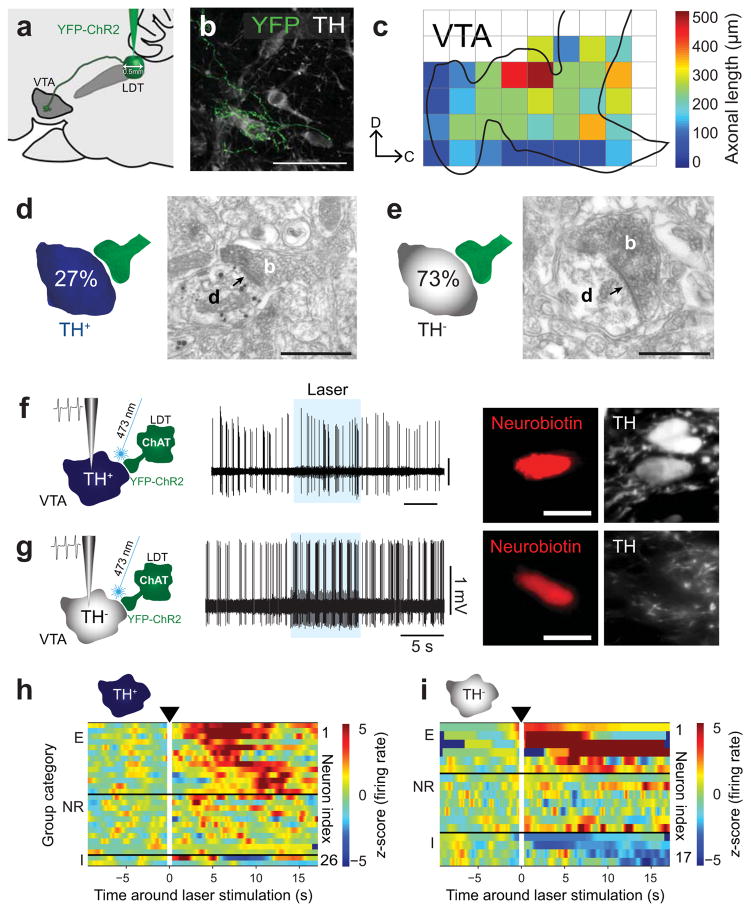
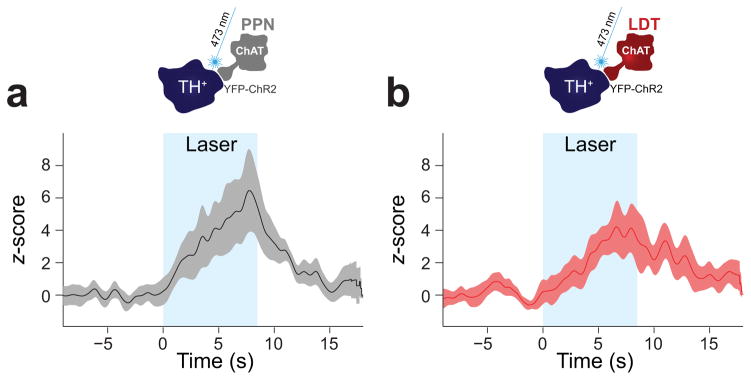
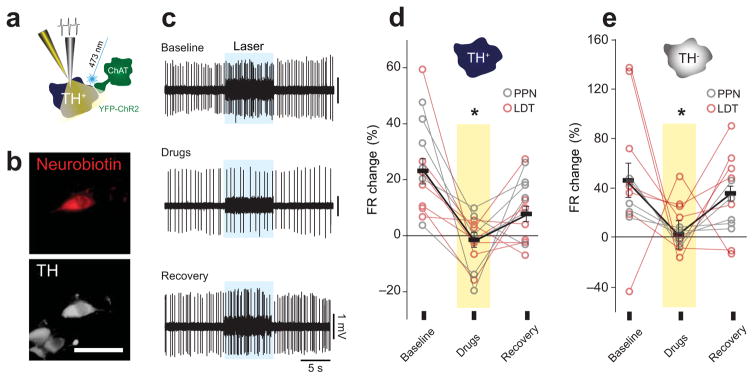
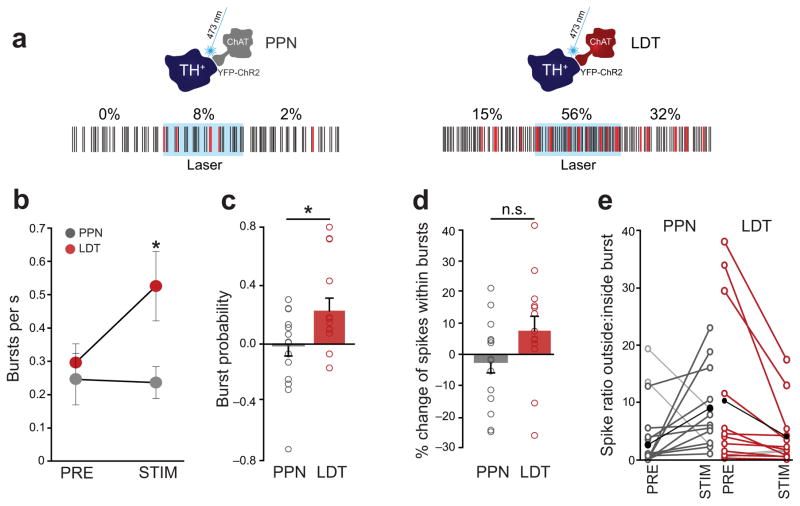
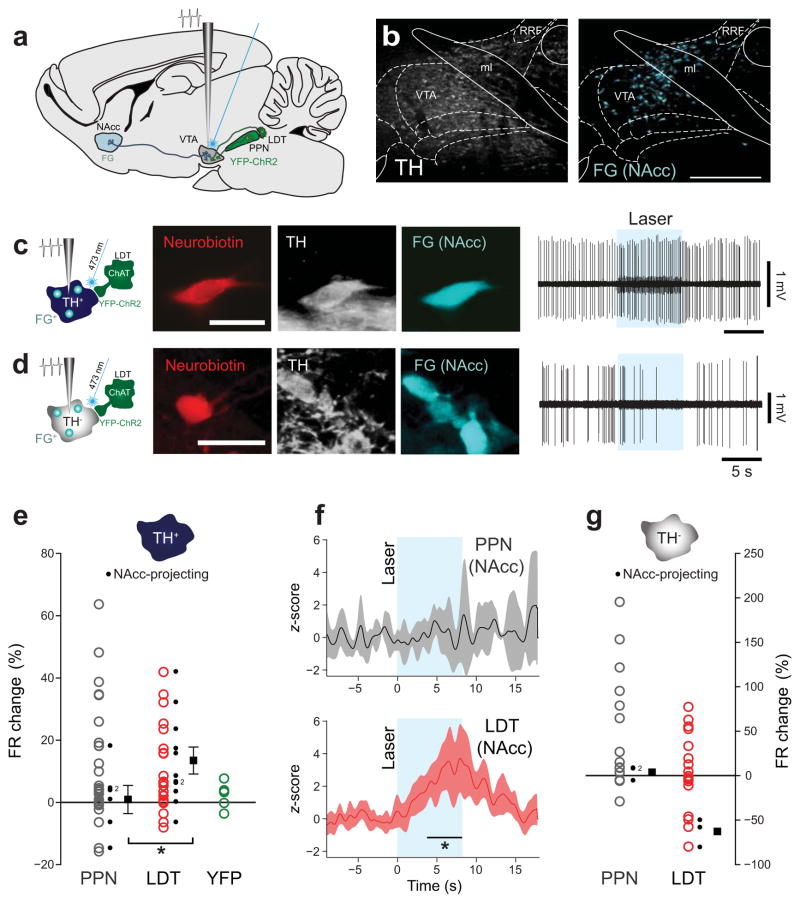
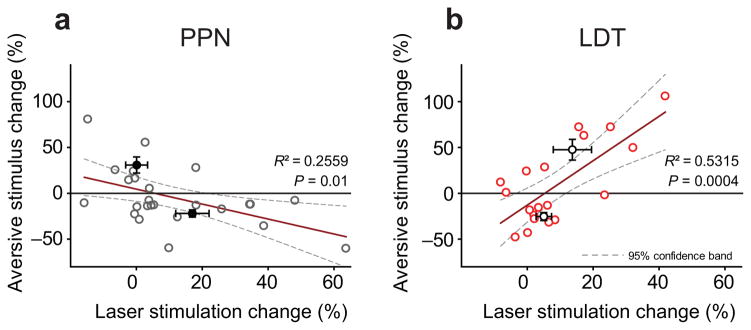
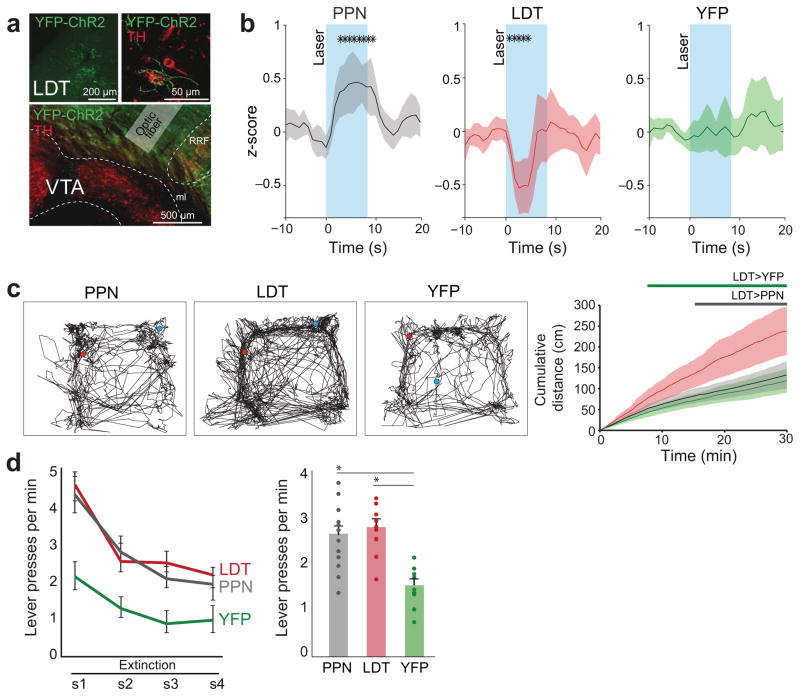
Dopamine neurons in the ventral tegmental area (VTA) receive cholinergic innervation from brainstem structures that are associated with either movement or reward. Whereas cholinergic neurons of the pedunculopontine nucleus (PPN) carry an associative/motor signal, those of the laterodorsal tegmental nucleus (LDT) convey limbic information. We used optogenetics and in vivo juxtacellular recording and labeling to examine the influence of brainstem cholinergic innervation of distinct neuronal subpopulations in the VTA. We found that LDT cholinergic axons selectively enhanced the bursting activity of mesolimbic dopamine neurons that were excited by aversive stimulation. In contrast, PPN cholinergic axons activated and changed the discharge properties of VTA neurons that were integrated in distinct functional circuits and were inhibited by aversive stimulation. Although both structures conveyed a reinforcing signal, they had opposite roles in locomotion. Our results demonstrate that two modes of cholinergic transmission operate in the VTA and segregate the neurons involved in different reward circuits.


Conflict of interest statement

Competing financial interests statement

The authors declare no competing financial interests.

Figures

Figure 1
Figure 1. Optogenetic activation of PPN cholinergic axons modulates DA and non-DA neurons of the VTA
(a) An AAV vector (AAV2-DIO-E1Fa-YFP-ChR2) was injected into the caudal PPN of ChAT::Cre+ rats (n = 22). (b) YFP-positive axons were detected in the VTA and (c) mapped using 250-μm2 grids (n = 6). (d, e) PPN cholinergic axons (n = 10; b, bouton) make synaptic contacts (arrows) with both TH+ and TH dendrites (d). (f) Individual TH+ neurons (n = 34) were recorded in vivo during optogenetic stimulation of PPN axons (8 s, 10 Hz, 50 ms pulses) and were subsequently labeled with neurobiotin. (g) The same protocol was followed for TH neurons (n = 19). (h) Normalized firing rate (z-score along the whole trial period) for each TH+ neuron around the laser stimulation in the VTA showing three categories of neurons: excited (E, 38%), non-responsive (NR, 56%), and inhibited (I, 6%) (cluster based permutation test, P < 0.05; 200 permutations). (i) Normalized firing rates of TH neurons show similar proportions in each group in relation to their response (E, 37%; NR, 47%; I, 16%). Scale bars (in μm): b, 70; d and e, 0.5; f and g, 50.
Figure 2
Figure 2. Optogenetic activation of LDT cholinergic axons modulates DA and non-DA neurons of the VTA
(a) Virus injections were delivered into the LDT (n = 19 rats). (b) YFP-positive axons were observed more frequently than in PPN-injected animals. (c) The total axonal length was higher for the LDT, suggesting a higher level of collateralization (n = 6; see Supplementary Fig. 3c for a comparison). (d, e) LDT cholinergic axons (n = 11; b, bouton) make synaptic contacts (arrows) with TH processes more often than with TH+ processes (d, dendrite). (f, g) Protocol for recording, stimulation (8 s, 10 Hz, 50 ms pulses) and labeling of TH+ (n = 26) and TH (n = 17) neurons. (h) Neurons were separated into three categories according to their responses to the laser stimulation: excited (E, 50%), non-responsive (NR, 42%), and inhibited (I, 8%) (cluster based permutation test, P < 0.05; 200 permutations). (i) There was more variability in the responses of TH neurons to the LDT stimulation (E, 35%; NR, 41%; I, 24%). Scale bars (in μm): b, 70; d and e, 0.5; f and g, 50.
Figure 3
Figure 3. Activation of cholinergic axons produces a slow and robust excitation of DA neurons
The normalized firing rate of all TH+ neurons that were excited by the laser stimulation show a similar slow modulation when cholinergic axons of either PPN (a; n = 15) or LDT (b; n = 15) were stimulated. The responses following PPN cholinergic axon stimulation were greater in magnitude, no significant differences were observed (cluster based permutation test, P = 0.715; 200 permutations). Data are depicted as mean ± CI.
Figure 4
Figure 4. Cholinergic antagonists block the response to laser stimulation in DA and non-DA neurons
(a) Individual TH+ and TH neurons were recorded in vivo during optogenetic stimulation of PPN axons and local microiontophoretic administration of nicotinic and muscarinic antagonists (methyllycaconitine 20 mM, dihydro-β-erythroidine 40 mM, atropine 40 mM and mecamylamine 100 μM; n = 5 rats). (b) Neurons were subsequently labeled with neurobiotin and their neurochemical profile identified. (c) Example of a neuron that was recorded during a baseline response to the optogenetic activation of LDT cholinergic axons. Following the iontophoretic application of the acetylcholine antagonist cocktail, the same laser stimulation failed to produce a response, but the responsiveness to the laser stimulation recovered following drug wash-out (2 min after). (d, e) Excitatory responses to laser stimulation of both PPN and LDT cholinergic axons were blocked in DA (n = 14; F1, 12 = 21.3, P = 0.0006, 2-way mixed ANOVA) and non-DA (n = 12; F1, 9 = 20.26, P = 0.001, 2-way mixed ANOVA) neurons following the administration of acetylcholine antagonist cocktail and recovered following wash-out. No significant effects in the axon source (PPN/LDT) factor or in the interaction (stimulation × source) were observed. Bars represent mean ± SEM. Scale bar in b: 50 μm.
Figure 5
Figure 5. Laser stimulation of cholinergic axons modifies the bursting activity of DA neurons
(a) DA neurons modified their bursting activity following optogenetic activation of PPN or LDT cholinergic axons. Red numbers represent the percentage of spikes within a burst before, during and after laser stimulation. While PPN stimulation tended to switch the pattern of activity of DA neurons, LDT axon stimulation did not change the bursting regime but increased the number of spikes within bursts (red) of already bursting neurons. (b) LDT axon stimulation significantly increased the number of bursts in those neurons already bursting when compared to the baseline (F1, 12 = 7.18, P = 0.02, 1-way RM ANOVA, n = 13) and to PPN axon stimulation (U = 47.5, P = 0.02, Mann-Whitney, n = 15). (c) Increased burst probability during LDT-axon stimulation (t = 2.18, t-test, P = 0.039). (d) LDT axon stimulation produced more spikes within bursts during the stimulation (t = 1.96, P = 0.06) whereas PPN stimulation resulted in fewer spikes within bursts when compared to LDT (t = 1.76; P = 0.09). (e) Ratio of spikes outside:inside bursts during baseline and laser stimulation. During PPN axon stimulation, in all but 2 cases (light gray), there was a disruption in the bursting activity characterized by a larger number of spikes outside bursts. In contrast, during LDT axon stimulation, in all but 2 cases (gray) there was an increase in the concentration of spikes within bursts (P = 0.006 between PPN and LDT). This change in the ratio was significantly different between PPN (n = 15) and LDT (n = 13; t = 2.72; P = 0.011). Group means are depicted in black. Circles in b, and bars in c and d, represent average ± SEM.
Figure 6
Figure 6. LDT cholinergic axons preferentially target mesolimbic DA and non-DA VTA neurons
(a) Schematic of the experimental design. Fluorogold (FG) was injected into the nucleus accumbens (NAcc) of ChAT::Cre+ rats that also received a virus injection into the PPN or LDT. (b) FG-labeled neurons were observed throughout the VTA, most prominently in the dorsal regions. (c) Example of a FG+/TH+ neuron that was excited by LDT-axon stimulation. (d) Example of a FG+/TH neuron that was inhibited by LDT axon stimulation. The basal firing rate and action potential duration of mesolimbic neurons was not significantly different to that of neurons that did not contain the tracer (TH+, n = 43; TH, n = 30; basal firing rate: TH+, U = 322, P = 0.854; TH, U = 138, P = 0.495; action potential duration: TH+, U = 397.5, P = 0.649; TH, U = 165.5, P = 0.171, Mann-Whitney). (e) DA neurons that project to the NAcc were preferentially excited by the optogenetic stimulation of LDT cholinergic axons (n = 11). In contrast, PPN-axon stimulation did not activate NAcc-projecting neurons (n = 6; t = −1.84, one-tailed t-test, P = 0.04 between PPN and LDT for NAcc-projecting neurons). Control experiments, in which animals were transduced with YFP only (no ChR2, green, n = 5), did not show a response to the laser. (f) Normalized firing rate (mean ± CI) of all TH+/NAcc-projecting neurons following PPN or LDT cholinergic axon stimulation. Black line in the bottom panel represents the time points during which response to LDT stimulation was significantly greater than PPN (cluster-based permutation test; P = 0.02, 200 permutations). (g) Non-DA neurons that project to the NAcc were inhibited by LDT axon stimulation but not by PPN axon stimulation. Black boxes represent means ± SEM of NAcc-projecting neurons in e, or only means in g. Scale bars (in μm): b, 500; c and d, 30.
Figure 7
Figure 7. Cholinergic axon stimulation differentially modulates functionally distinct DA neurons
(a, b) Significant correlations were observed between the change in the firing rate of DA neurons during the hindpaw pinch (aversive stimulus) and their responses to the laser activation of PPN (a; n = 25) and LDT (b; n = 19) axons. Thus, DA neurons that are more inhibited by the pinch tend to respond more to PPN stimulation (7 out of 13) and less to LDT stimulation (3 out of 11), whereas DA neurons that were excited by the pinch are more strongly modulated by the LDT (5 out of 8) and less by the PPN (1 out of 7). Means and SEM for positive or negative values in the change to the aversive stimulus are indicated by black (PPN) and white (LDT) circles with error bars.
Figure 8
Figure 8. Optogenetic activation of cholinergic axons in the VTA in behaving rats
(a) Cholinergic neurons of the PPN and LDT were transduced with YFP and ChR2, and an optic fiber was chronically implanted above the VTA. (b) Optogenetic activation of cholinergic axons in the VTA produced different effects on stimulation-locked locomotor activity (10Hz, 50ms, 80 pulses, 13 stimulations): PPN axon stimulation (n = 12) increased motor activity whereas LDT axon stimulation (n = 10) decreased it; no changes were observed in control animals (n = 10) (2-way ANOVA; stimulation effect F(2, 58) = 3.569, P = 0.035; group effect F(2,58) = 0.325, P = 0.725; interaction F(4,58) = 16.58, P < 0.001; post hoc comparisons PPN vs WT: P = 0.029, PPN vs LDT: P < 0.001, LDT vs WT: P = 0.044). Asterisks represent significantly different time-points following laser stimulation based on a nonparametric cluster-based comparison (P = 0.002; n = 500 permutations). (c) Representative tracking traces and cumulative distance over a 30 min recording with pulses delivered every 2 min show significant differences for LDT, but not PPN, axon stimulation; control animals do not show any changes (1-way ANOVA: F(2,31) = 9.353, P = 0.001; post hoc comparisons: PPN vs control: P = 0.877, PPN vs LDT: P = 0.001, LDT vs control: P = 0.003). A nonparametric, cluster-based t-test analysis (n = 500 permutations) shows that there is a significantly higher value for movement in LDT stimulated animals compared to control (green bar) or PPN (gray bar) animals (P = 0.002). (d) Following training in a Pavlovian lever-press task in a progressive random interval schedule (see also Supplementary Fig. 11), sugar pellets delivery was replaced by optogenetic stimulation of either PPN or LDT cholinergic axons. Control animals also received laser pulses. Conditioned extinction was recorded during 4 consecutive days. PPN and LDT cholinergic axons stimulation produced a slowing in extinction compared to the control group, as shown by a significantly higher number of lever presses in PPN and LDT groups (2-way ANOVA; day effect: F(3, 27) = 15.747, P < 0.0001; group effect: F(2,29) = 13.781, P < 0.0001; interaction: F(6,54) = 0.785, P = 0.586; post hoc comparisons: PPN vs LDT: P = 0.839, PPN vs control: P = 0.000392, LDT vs control: P = 0.000148). Data in b and c are depicted as mean ± CI; data in d are depicted as mean ± SEM.

References

    1. Wise RA. Dopamine, learning and motivation. Nature Rev. 2004;5:483–494. - PubMed
    1. Montague PR, Hyman SE, Cohen JD. Computational roles for dopamine in behavioural control. Nature. 2004;431:760–767. - PubMed
    1. Joshua M, et al. Synchronization of midbrain dopaminergic neurons is enhanced by rewarding events. Neuron. 2009;62:695–704. - PubMed
    1. Schultz W. Updating dopamine reward signals. Curr Opinion Neurobiol. 2013;23:229–238. - PMC - PubMed
    1. Tsai HC, et al. Phasic firing in dopaminergic neurons is sufficient for behavioral conditioning. Science. 2009;324:1080–1084. - PMC - PubMed

Publication types

MeSH terms

LinkOut - more resources