. 2016 Aug 1;126(8):2970-88.
doi: 10.1172/JCI85456. Epub 2016 Jun 27.

Activation of tyrosine kinase c-Abl contributes to α-synuclein-induced neurodegeneration

Activation of tyrosine kinase c-Abl contributes to α-synuclein-induced neurodegeneration

Saurav Brahmachari et al. J Clin Invest. .

Abstract

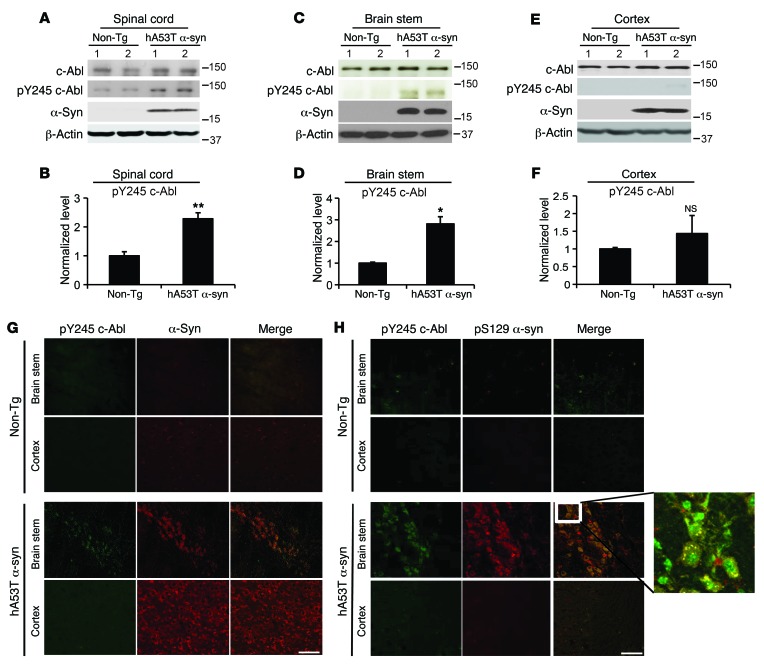
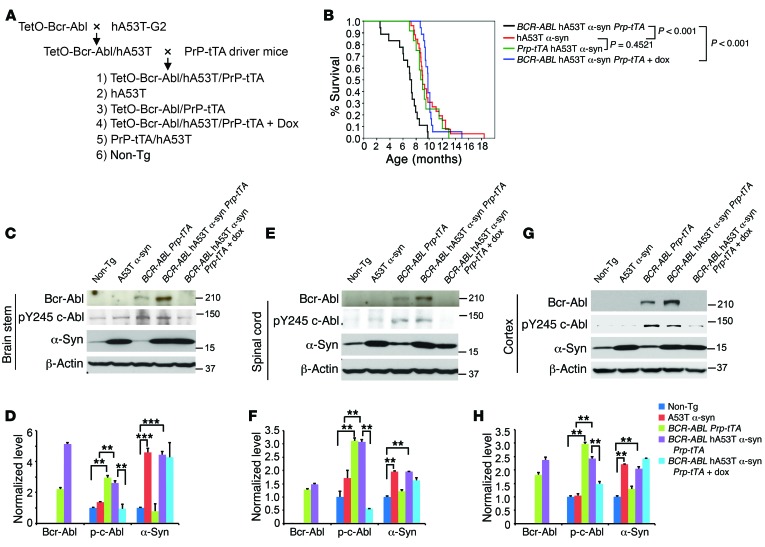
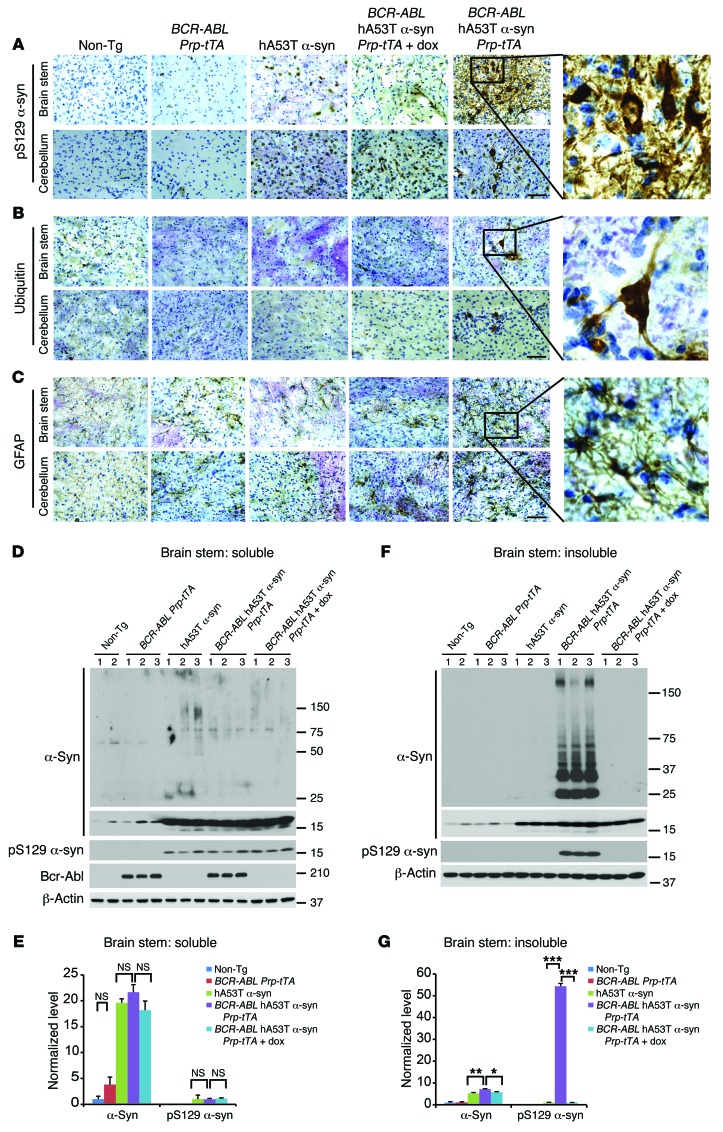
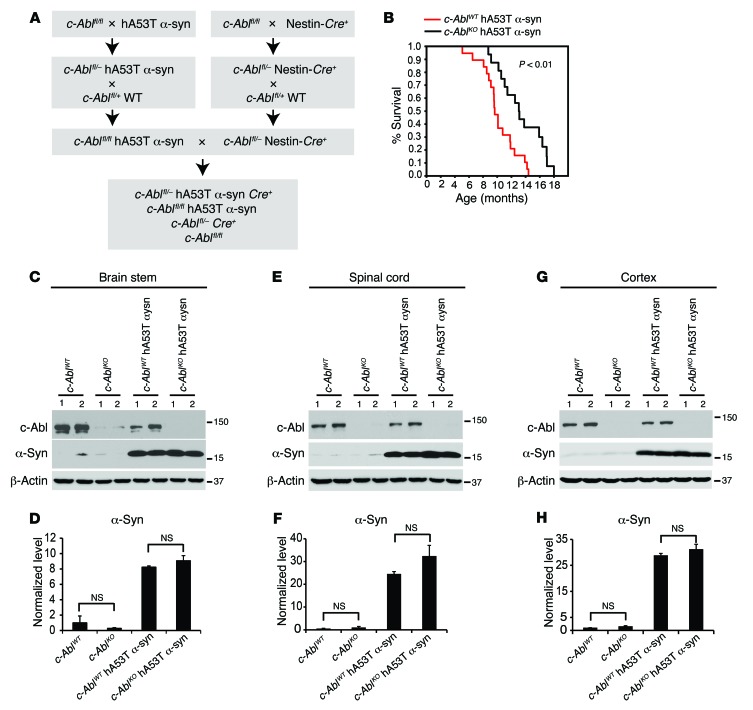
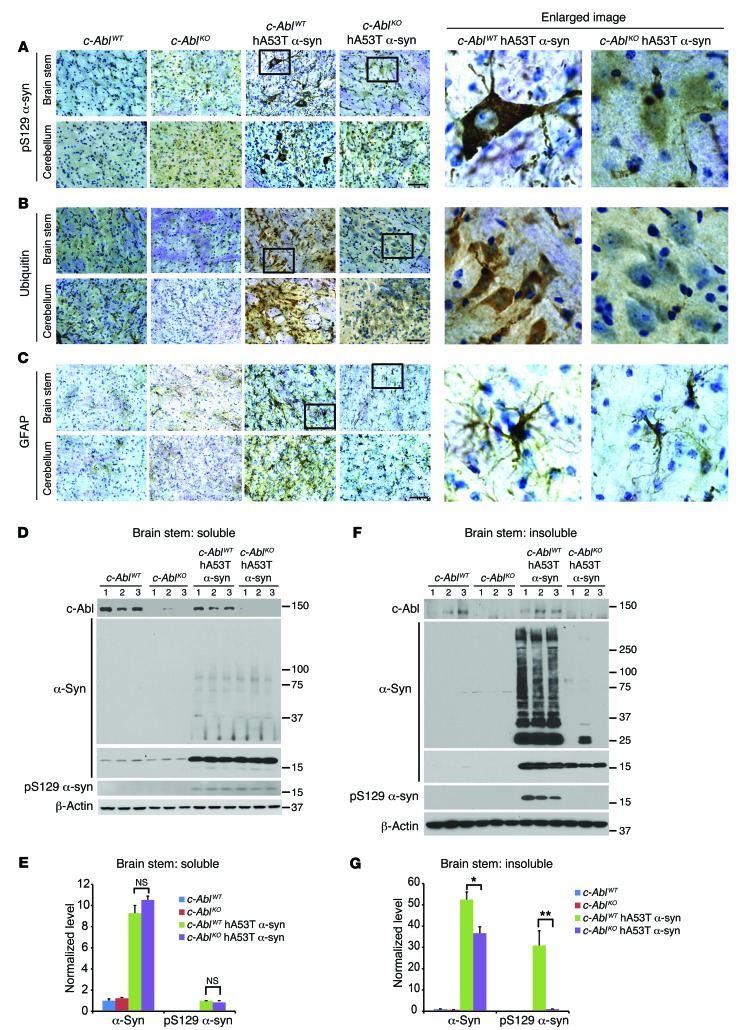
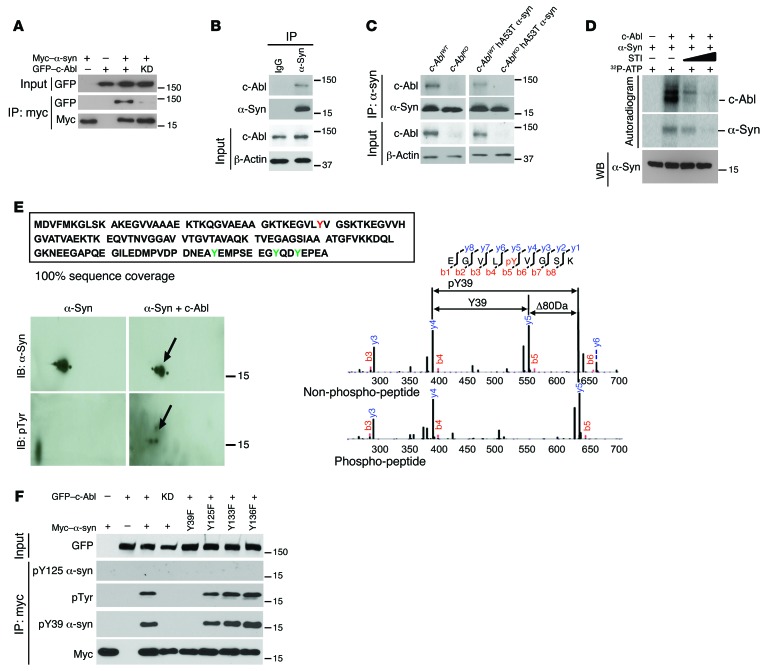
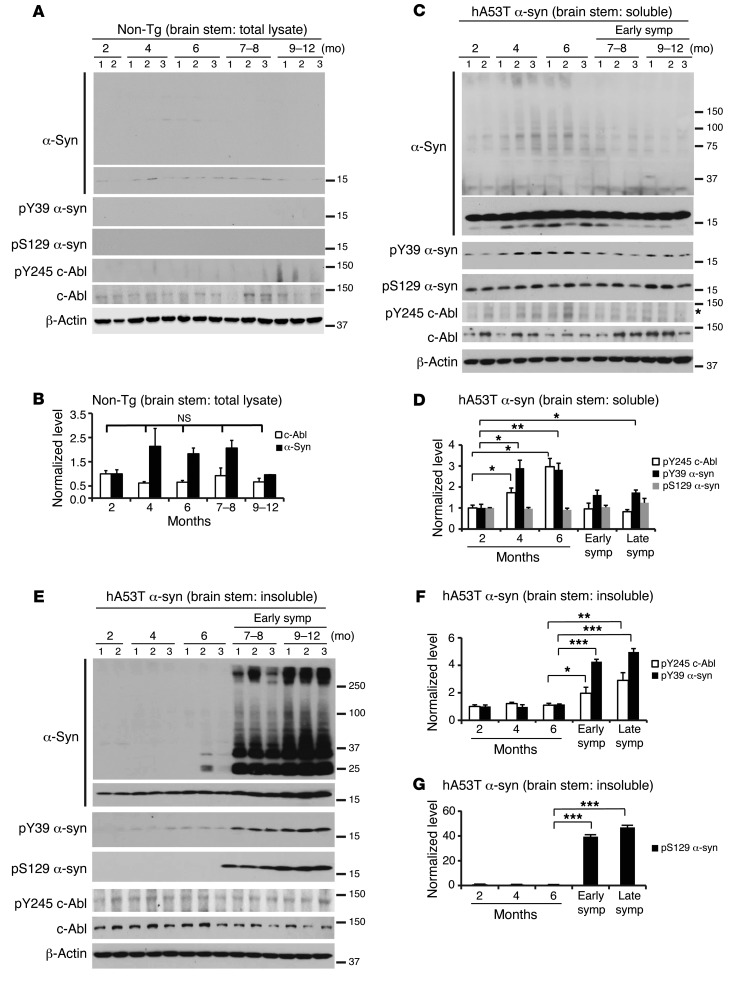
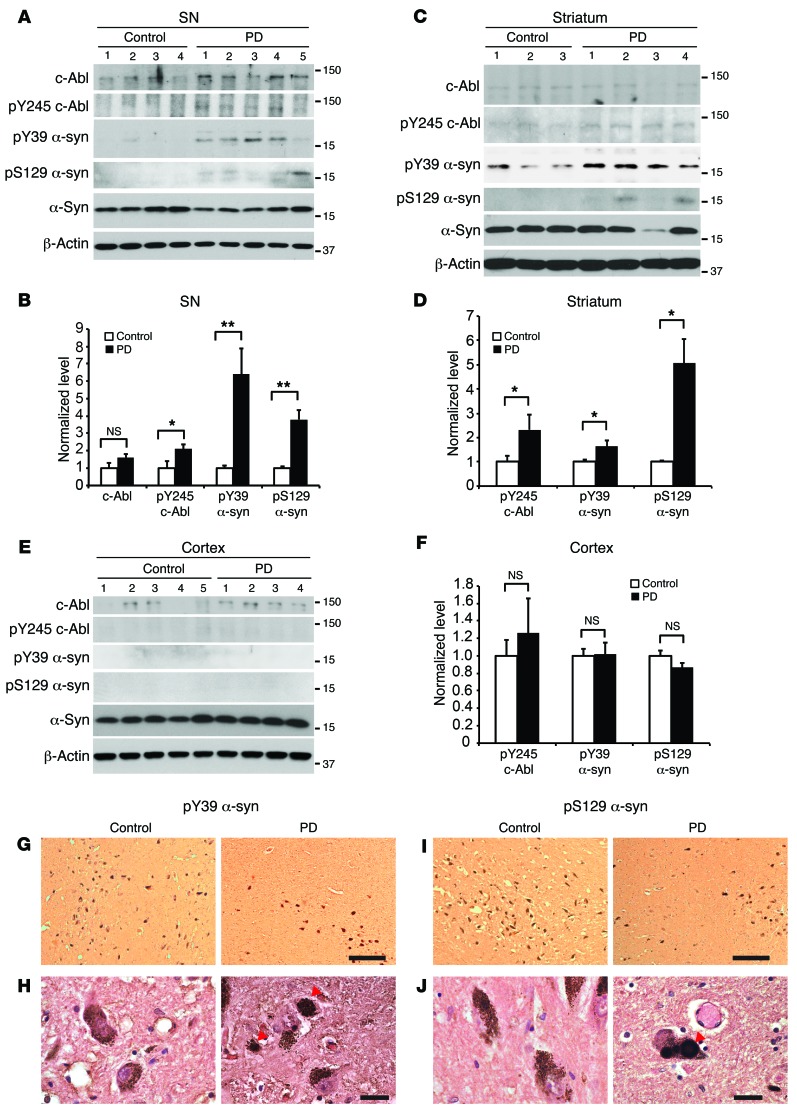
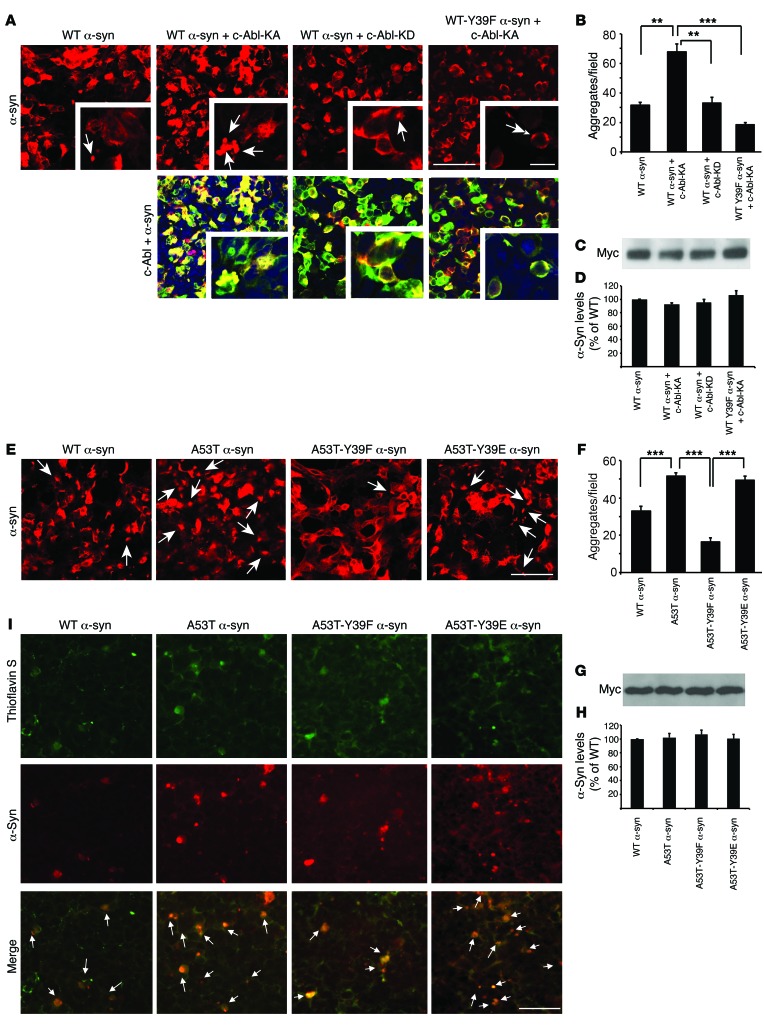
Aggregation of α-synuclein contributes to the formation of Lewy bodies and neurites, the pathologic hallmarks of Parkinson disease (PD) and α-synucleinopathies. Although a number of human mutations have been identified in familial PD, the mechanisms that promote α-synuclein accumulation and toxicity are poorly understood. Here, we report that hyperactivity of the nonreceptor tyrosine kinase c-Abl critically regulates α-synuclein-induced neuropathology. In mice expressing a human α-synucleinopathy-associated mutation (hA53Tα-syn mice), deletion of the gene encoding c-Abl reduced α-synuclein aggregation, neuropathology, and neurobehavioral deficits. Conversely, overexpression of constitutively active c-Abl in hA53Tα-syn mice accelerated α-synuclein aggregation, neuropathology, and neurobehavioral deficits. Moreover, c-Abl activation led to an age-dependent increase in phosphotyrosine 39 α-synuclein. In human postmortem samples, there was an accumulation of phosphotyrosine 39 α-synuclein in brain tissues and Lewy bodies of PD patients compared with age-matched controls. Furthermore, in vitro studies show that c-Abl phosphorylation of α-synuclein at tyrosine 39 enhances α-synuclein aggregation. Taken together, this work establishes a critical role for c-Abl in α-synuclein-induced neurodegeneration and demonstrates that selective inhibition of c-Abl may be neuroprotective. This study further indicates that phosphotyrosine 39 α-synuclein is a potential disease indicator for PD and related α-synucleinopathies.


Figures

Figure 1
Figure 1. c-Abl is overactivated in symptomatic hA53Tα-syn transgenic mice.
(A, C, and E) Representative immunoblots of c-Abl, pY245 c-Abl, α-synuclein (α-syn), and β-actin in the spinal cord, brain stem, and cortex from symptomatic hA53Tα-syn transgenic mice and age-matched nontransgenic (Non-Tg) littermate controls. (B, D, and F) Quantification of pY245 c-Abl protein levels normalized to c-Abl (n = 4 per group). Data are from 3 independent experiments. Statistical significance was determined by 2-tailed unpaired Student’s t test. Quantified data are expressed as the mean ± SEM. *P < 0.05, **P < 0.01. (G) Representative immunofluorescent images of pY245 c-Abl (green) and α-syn (red) in the brain stem and cortex from symptomatic hA53Tα-syn transgenic mice and age-matched nontransgenic littermate controls (n = 3 per group). Scale bar: 50 μm. (H) Representative confocal images of pY245 c-Abl (green) and pS129 α-syn (red) in the brain stem and cortex from symptomatic hA53Tα-syn transgenic mice and age-matched nontransgenic littermate controls (n =3 per group). Enlarged image (zoom-in, ×35; original magnification, ×40) at right shows colocalization of pY245 c-Abl and pS129 α-syn. Scale bar: 50 μm.
Figure 2
Figure 2. c-Abl overexpression decreases survival of hA53Tα-syn transgenic mice.
(A) Breeding strategy to generate BCR-ABL hA53Tα-syn PrP-tTA trigenic mice. (B) Kaplan-Meier survival curve analysis for hA53Tα-syn, PrP-tTA hA53Tα-syn, BCR-ABL hA53Tα-syn PrP-tTA trigenic, and BCR-ABL hA53Tα-syn PrP-tTA trigenic mice with doxycycline (n = 20–30 mice per group). Statistical analysis was performed by Mann-Whitney-Wilcoxon test. (C, E, and G) Representative immunoblots of BCR-ABL, pY245 c-Abl, α-syn, and β-actin in the brain stem, spinal cord, and cortex from 3-month-old BCR-ABL hA53Tα-syn PrP-tTA trigenic mice with or without doxycycline and age-matched littermate controls. (D, F, and H) Quantification of BCR-ABL, pY245 c-Abl, and α-syn protein levels normalized to β-actin (n = 3 per group). Data are from 3 independent experiments. Statistical significance was determined by 1-way ANOVA with Tukey’s post-test of multiple comparisons. Quantified data are expressed as the mean ± SEM. **P < 0.01, ***P < 0.001.
Figure 3
Figure 3. c-Abl overexpression exacerbates α-synuclein pathologies.
(AC) Representative pS129 α-syn, ubiquitin, and GFAP IHC in the brain stem and cerebellum of 6-month-old symptomatic BCR-ABL hA53Tα-syn PrP-tTA trigenic mice with or without doxycycline and age-matched littermate controls (n = 3 per group). Enlarged images (zoom-in, ×30; original magnification, ×40) of the indicated regions are shown at right. Scale bars: 50 μm. (D) Representative immunoblots of α-syn, pS129 α-syn, BCR-ABL, and β-actin in the detergent-soluble fraction of brain stem from 6-month-old symptomatic BCR-ABL hA53Tα-syn PrP-tTA trigenic mice with or without doxycycline and age-matched littermate controls. (E) Quantification of α-syn monomer and pS129 α-syn protein levels in D normalized to β-actin and α-syn monomer, respectively (n = 5 mice per group). (F) Representative immunoblots of α-syn, pS129 α-syn, and β-actin in the detergent-insoluble fraction of brain stem from 6-month-old symptomatic BCR-ABL hA53Tα-syn PrP-tTA trigenic mice with or without doxycycline and age-matched littermate controls. (G) Quantification of α-syn monomer and pS129 α-syn protein levels in F normalized to β-actin and α-syn monomer, respectively (n = 5 mice per group). (DG) Data are from 3 independent experiments. Statistical significance was determined by 1-way ANOVA with Tukey’s post-test of multiple comparisons. Quantified data are expressed as the mean ± SEM. *P < 0.05, **P < 0.01, ***P < 0.001.
Figure 4
Figure 4. c-Abl deletion extends survival of hA53Tα-syn transgenic mice.
(A) Breeding strategy to generate conditional c-AblKO hA53T α-syn (c-Ablfl/– hA53Tα-syn Nestin-Cre) mice. (B) Kaplan-Meier survival curve analysis for c-AblWT hA53Tα-syn and c-AblKO hA53T α-syn mice (n = 20–30 mice per group). Statistical analysis was performed by Mann-Whitney-Wilcoxon test. P < 0.01. (C, E, and G) Representative immunoblots of c-Abl, α-syn, and β-actin in the brain stem, spinal cord, and cortex from 2-month-old c-AblKO hA53Tα-syn mice and age-matched littermate controls. (D, F, and H) Quantification of α-syn protein levels normalized to β-actin (n = 3 per group). Data are from 3 independent experiments. Statistical significance was determined by 1-way ANOVA with Tukey’s post-test of multiple comparisons. Quantified data are expressed as the mean ± SEM.
Figure 5
Figure 5. c-Abl deletion reduces α-synuclein pathologies.
(AC) Representative pS129 α-syn, ubiquitin, and GFAP IHC in the brain stem and cerebellum of 9-month-old symptomatic c-AblWT hA53Tα-syn mice versus c-AblKO hA53Tα-syn mice and age-matched littermate control mice (n = 3 per group). Enlarged images (zoom-in, ×30; original magnification, ×40) of the indicated regions are shown at right. Scale bars: 50 μm. (D) Representative immunoblots of c-Abl, α-syn, pS129 α-syn, and β-actin in the detergent-soluble fraction of brain stem from 9-month-old symptomatic c-AblWT hA53Tα-syn transgenic mice versus c-AblKO hA53Tα-syn transgenic mice and age-matched littermate controls. (E) Quantification of α-syn monomer and pS129 α-syn protein levels in D normalized to β-actin and α-syn monomer, respectively (n = 7 mice per group). (F) Representative immunoblots of c-Abl, α-syn, pS129 α-syn, and β-actin in the detergent-insoluble fraction of brain stem from 9-month-old symptomatic c-AblWT hA53Tα-syn transgenic mice and age-matched littermate controls. (G) Quantification of α-syn monomer and pS129 α-syn protein levels in F normalized to β-actin and α-syn monomer, respectively (n = 7 mice per group). (DG) Data are from 3 independent experiments. Statistical significance was determined by 1-way ANOVA with Tukey’s post-test of multiple comparisons. Quantified data are expressed as the mean ± SEM. *P < 0.05, **P < 0.01.
Figure 6
Figure 6. c-Abl interacts with and phosphorylates α-synuclein.
(A) Coimmunoprecipitation of myc-tagged α-syn (myc-α-syn) and GFP-tagged c-Abl (GFP-c-Abl) by anti-myc antibody in SH-SY5Y cells cotransfected with myc-α-syn and GFP-c-Abl or kinase-dead (KD) (lysine 290 arginine) version of c-Abl (GFP-c-Abl-KD) followed by IB. (B) Coimmunoprecipitation of α-syn and c-Abl by anti–α-syn antibody in the brain stem from nontransgenic mice followed by IB. Anti-IgG was used as a negative control. (C) Coimmunoprecipitation of α-syn and c-Abl by anti–α-syn antibody in the brain tissue lysates from WT, c-Abl knockout (c-AblKO), hA53Tα-syn, and c-AblKO hA53Tα-syn mice followed by IB. (D) In vitro kinase assay showing that c-Abl phosphorylates α-syn. Autoradiogram indicates that STI-571, a c-Abl kinase inhibitor, dose-dependently reduced phosphorylation of α-syn and c-Abl. Immunoblot in the bottom panel shows equivalent amount of α-syn used in the experiment. (E) c-Abl phosphorylates α-syn on tyrosine (Y) 39. Mass spectrometric analysis reveals 100% sequence coverage of α-syn, showing that all tyrosine residues were investigated for phosphorylation status. Phosphorylated Y39 is indicated in red; other tyrosines are indicated in green (top). α-Syn phosphorylated by c-Abl was separated by 2-DE followed by IB (bottom left). The arrows indicate tyrosine phosphorylation of α-syn. Both nonphosphorylated and phosphorylated α-syn were subjected to liquid chromatography–tandem mass spectrometry (LC-MS/MS) to identify the phosphorylation site (bottom right). LC-MS/MS spectra of the nonphosphorylated peptide (EGVLYVGSK) and the phosphorylated peptide (EGVLpYVGSK) are compared, demonstrating that there is the 80-Da shift for the Y39 ion containing the phosphate moiety. The phosphorylated amino acid is preceded by a “p” and highlighted in red. (F) IP of myc-α-syn by anti-myc antibody in SH-SY5Y cells cotransfected with indicated plasmids followed by IB with anti-myc, anti-pY39 α-syn, anti-pTyr, or anti-pY125 α-syn antibodies. Inputs were immunoblotted with anti-GFP antibodies. All experiments were repeated at least 3 times.
Figure 7
Figure 7. Phosphotyrosine 39 α-synuclein increases in the brain stem of hA53Tα-syn transgenic mice.
(A) Representative immunoblots of α-syn, pY39 α-syn, pS129 α-syn, pY245-c-Abl, c-Abl, and β-actin in the brain stem from nontransgenic mice of different ages. (B) Quantification of α-syn monomer and c-Abl protein levels in A normalized to β-actin (n = 5 mice per group). (C) Representative immunoblots of α-syn, pY39 α-syn, pS129 α-syn, pY245-c-Abl, c-Abl, and β-actin in the detergent-soluble fraction of brain stem from hA53Tα-syn transgenic mice of different ages. Asterisk indicates nonspecific band. (D) Quantification of pY245-c-Abl protein level normalized to c-Abl and pY39 α-syn and pS129 α-syn protein levels normalized to α-syn monomer in A (n = 5–10 mice per group). (E) Representative immunoblots of α-syn, pY39 α-syn, pS129 α-syn, pY245-c-Abl, c-Abl, and β-actin in the detergent-insoluble fraction of brain stem from hA53Tα-syn transgenic mice of different ages. (F and G) Quantification of pY245-c-Abl protein level normalized to c-Abl and pY39 α-syn and pS129 α-syn protein levels normalized to α-syn monomer in E (n = 5–10 mice per group). Data are from 3 independent experiments. Statistical significance was determined by 1-way ANOVA with Tukey’s post-test of multiple comparisons. Quantified data are expressed as the mean ± SEM. *P < 0.05, **P < 0.01, ***P < 0.001.
Figure 8
Figure 8. Phosphotyrosine 39 α-synuclein level is elevated in PD patients and accumulates in Lewy bodies.
(A, C, and E) Representative immunoblots of c-Abl, pY245 c-Abl, pY39 α-syn, pS129 α-syn, α-syn, and β-actin in the total lysates from substantia nigra, striatum, and cortex regions from PD patient brains and age-matched controls. (B) Quantification of c-Abl protein level normalized to β-actin, pY245 c-Abl protein level normalized to c-Abl, and pY39 α-syn and pS129 α-syn protein levels normalized to α-syn in the substantia nigra (control n = 5, PD n = 8). (D and F) Quantification of pY245 c-Abl protein level normalized to c-Abl and pY39 α-syn and pS129 α-syn protein levels normalized to α-syn in the striatum (control n = 5, PD n = 7) (D) and cortex (control n = 7, PD n = 6). Data are from 3 independent experiments. Statistical significance was determined by 2-tailed unpaired Student’s t test. Quantified data are expressed as the mean ± SEM. *P < 0.05, **P < 0.01. (G and I) Representative pY39 α-syn and pS129 α-syn IHC in the substantia nigra from PD patient brains and age-matched controls (n = 2). Scale bars: 250 μm. (H and J) High-magnification images of G and I. Scale bars: 25 μm.
Figure 9
Figure 9. Phosphorylation of α-synuclein at tyrosine 39 triggers aggregation.
(A and E) Representative immunofluorescent images of myc-tagged α-syn (red) or GFP-tagged c-Abl and myc-tagged α-syn (merge) in HEK293T cells transfected with indicated plasmids. Single-headed arrows indicate aggregates. Double-headed arrow indicates area with no aggregation. Scale bars: 50 μm; 5 μm (inset). (B and F) Number of immunopositive aggregates per field was quantitated and compared with WT levels. (C and G) Immunoblots of cell lysates with antibodies against the myc epitope. (D and H) Quantifications of myc as percentage of WT levels. (I) Representative immunofluorescent images of thioflavin S staining in HEK293T cells overexpressing indicated myc-tagged α-syn. Single-headed arrows indicate colocalization of thioflavin S and α-syn. Scale bar: 25 μm. Data are from at least 3 independent experiments. (B, D, F, and H) Statistical significance was determined by 1-way ANOVA with Tukey’s post-test of multiple comparisons. Quantified data are expressed as the mean ± SEM. **P < 0.01, ***P < 0.001.

References

    1. Savitt JM, Dawson VL, Dawson TM. Diagnosis and treatment of Parkinson disease: molecules to medicine. J Clin Invest. 2006;116(7):1744–1754. doi: 10.1172/JCI29178. - DOI - PMC - PubMed
    1. Dauer W, Przedborski S. Parkinson’s disease: mechanisms and models. Neuron. 2003;39(6):889–909. doi: 10.1016/S0896-6273(03)00568-3. - DOI - PubMed
    1. Bonnet AM, Jutras MF, Czernecki V, Corvol JC, Vidailhet M. Nonmotor symptoms in Parkinson’s disease in 2012: relevant clinical aspects. Parkinsons Dis. 2012;2012: - PMC - PubMed
    1. Goedert M. α-Synuclein and neurodegenerative diseases. Nat Rev Neurosci. 2001;2(7):492–501. doi: 10.1038/35081564. - DOI - PubMed
    1. Goedert M, Spillantini MG, Del Tredici K, Braak H. 100 years of Lewy pathology. Nat Rev Neurol. 2013;9(1):13–24. - PubMed

Publication types

MeSH terms