

Innate immune defects in HIV permissive cell lines
- PMID: 27350062
- PMCID: PMC4924258
- DOI: 10.1186/s12977-016-0275-8
Innate immune defects in HIV permissive cell lines
Abstract
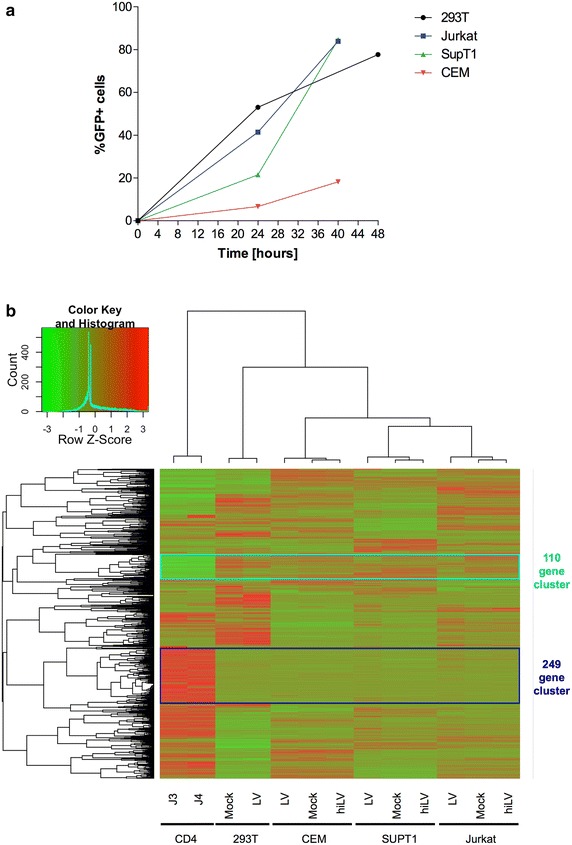
Background: Primary CD4+ T cells and cell lines differ in their permissiveness to HIV infection. Impaired innate immunity may contribute to this different phenotype.
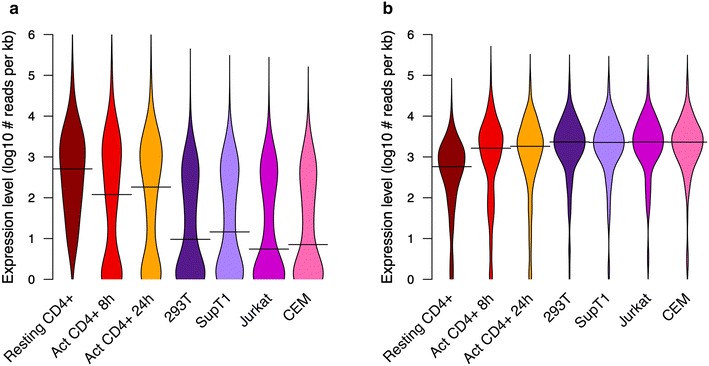
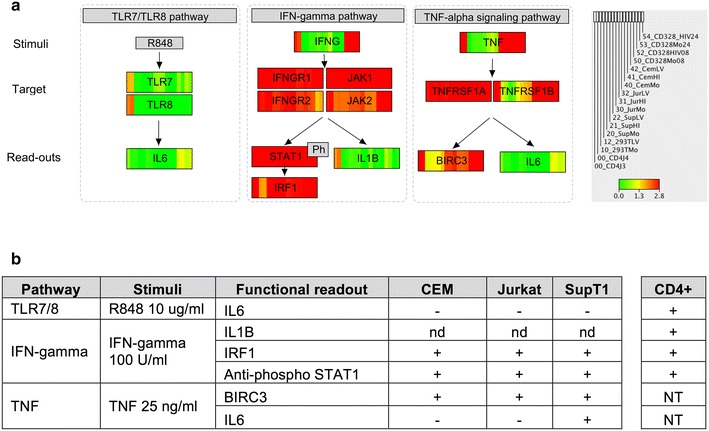
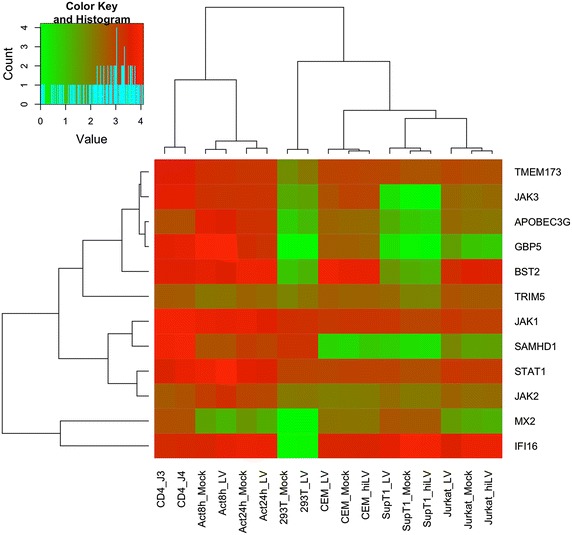
Findings: We used transcriptome profiling of 1503 innate immunity genes in primary CD4+ T cells and permissive cell lines. Two clusters of differentially expressed genes were identified: a set of 249 genes that were highly expressed in primary cells and minimally expressed in cell lines and a set of 110 genes with the opposite pattern. Specific to HIV, HEK293T, Jurkat, SupT1 and CEM cell lines displayed unique patterns of downregulation of genes involved in viral sensing and restriction. Activation of primary CD4+ T cells resulted in reversal of the pattern of expression of those sets of innate immunity genes. Functional analysis of prototypical innate immunity pathways of permissive cell lines confirmed impaired responses identified in transcriptome analyses.
Conclusion: Integrity of innate immunity genes and pathways needs to be considered in designing gain/loss functional genomic screens of viral infection.
Keywords: Cell lines; HIV; Innate immunity; RNA-Seq; TCR activation.
Figures
Similar articles
-
CD4-Dependent Modulation of HIV-1 Entry by LY6E.J Virol. 2019 Mar 21;93(7):e01866-18. doi: 10.1128/JVI.01866-18. Print 2019 Apr 1. J Virol. 2019. PMID: 30674630 Free PMC article.
-
Distinct gene-expression profiles associated with the susceptibility of pathogen-specific CD4 T cells to HIV-1 infection.Blood. 2013 Feb 14;121(7):1136-44. doi: 10.1182/blood-2012-07-446278. Epub 2012 Dec 20. Blood. 2013. PMID: 23258923 Free PMC article.
-
Extensive proteomic and transcriptomic changes quench the TCR/CD3 activation signal of latently HIV-1 infected T cells.PLoS Pathog. 2021 Jan 19;17(1):e1008748. doi: 10.1371/journal.ppat.1008748. eCollection 2021 Jan. PLoS Pathog. 2021. PMID: 33465149 Free PMC article.
-
Restrictions to HIV-1 replication in resting CD4+ T lymphocytes.Cell Res. 2013 Jul;23(7):876-85. doi: 10.1038/cr.2013.74. Epub 2013 Jun 4. Cell Res. 2013. PMID: 23732522 Free PMC article. Review.
-
Innate immunity and HIV-1 infection.Adv Dent Res. 2011 Apr;23(1):19-22. doi: 10.1177/0022034511399081. Adv Dent Res. 2011. PMID: 21441475 Review.
Cited by
-
Optimization of Bangladesh and Malaysian genotype recombinant reporter Nipah viruses for in vitro antiviral screening and in vivo disease modeling.Antiviral Res. 2024 Nov;231:106013. doi: 10.1016/j.antiviral.2024.106013. Epub 2024 Sep 24. Antiviral Res. 2024. PMID: 39326503 Free PMC article.
-
Viral vector platforms within the gene therapy landscape.Signal Transduct Target Ther. 2021 Feb 8;6(1):53. doi: 10.1038/s41392-021-00487-6. Signal Transduct Target Ther. 2021. PMID: 33558455 Free PMC article. Review.
-
The Role of Sustained Type I Interferon Secretion in Chronic HIV Pathogenicity: Implications for Viral Persistence, Immune Activation, and Immunometabolism.Viruses. 2025 Jan 22;17(2):139. doi: 10.3390/v17020139. Viruses. 2025. PMID: 40006894 Free PMC article. Review.
-
Human Three Prime Repair Exonuclease 1 Promotes HIV-1 Integration by Preferentially Degrading Unprocessed Viral DNA.J Virol. 2021 Aug 10;95(17):e0055521. doi: 10.1128/JVI.00555-21. Epub 2021 Aug 10. J Virol. 2021. PMID: 34105995 Free PMC article.
-
Limitations of dual-fluorescent HIV reporter viruses in a model of pre-activation latency.J Int AIDS Soc. 2019 Dec;22(12):e25425. doi: 10.1002/jia2.25425. J Int AIDS Soc. 2019. PMID: 31855322 Free PMC article.
References
-
- Ciuffi A, Bushman FD. Integration. In: Hope TJ, Stevenson M, Richman D, editors. Encyclopedia of AIDS. New York: Springer; 2013. p. 1–10. http://link.springer.com/referenceworkentry/10.1007/978-1-4614-9610-6_66-1. - DOI
Publication types
MeSH terms
Substances
Grants and funding
LinkOut - more resources
Full Text Sources
Other Literature Sources
Research Materials
